 Multi-family
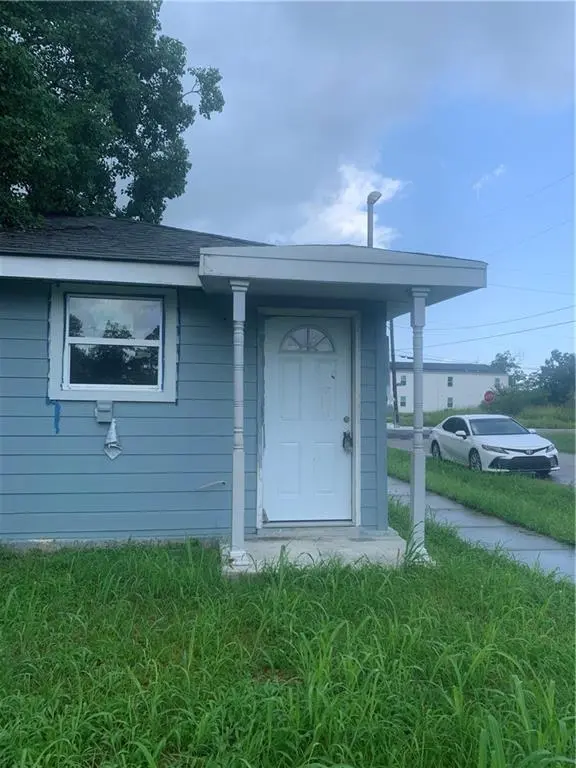
1841-43 Gordon St · New Orleans, LA
Flood risk 9/10 · Severe
- FEMA flood zone
- X (shaded)
- Chance of flooding over 30 yrs
- 0.77%
- Est. flood insurance / yr
- $507 – $1,088
Fire risk 1/10 · Minimal
- Est. fire insurance / yr
- $1,269 – $2,357
Heat risk 10/10 · Severe
- Hot days now (above 108°F)
- 7 days/yr
- Hot days in 30 yrs
- 21 days/yr
Wind risk 10/10 · Severe
- Chance of severe wind over 30 yrs
- 99.0%
Air-quality risk 3/10 · Minor
- Unhealthy air days now
- 3 days/yr
- Unhealthy air days in 30 yrs
- 3 days/yr
Risk factors via First Street. Map © Google.
Why this score? — see what drove the C- grade
The composite is a weighted blend of 9 inputs, each scored 0–100. Each bar is that input's sub-score; the figure is the points it added to the 100-point composite (weight × sub-score).
- Cash flow +26.7/30.0
- DSCR +9.2/10.0
- 1% rule +5.8/10.0
- Livability +4.0/5.0
- Rent growth +3.1/5.0
- Condition / age +2.5/5.0
- Schools +1.6/10.0
- ARV discount +0.0/15.0
- Appreciation +0.0/10.0
$230,000
🖨 Deal sheet 📄 Offer letter ✓ Due diligence
Multi-family units
County records classify this as Multi-Family (2-4 Unit). Listing-text estimate: 1 unit. estimate disagrees with records
Listing remarks MLS
Beautifully renovated corner double. 98% completed, each unit has its own identity, making it a great property for an owner-occupant. Let your tenant help pay the mortgage or consider it as an excellent addition to your investment portfolio. One side features elegant ceramic tile throughout, providing a sleek and modern aesthetic, while the other side combines laminate flooring with ceramic accents, offering both style and durability.This property is not just a living space; it's a versatile investment opportunity. With separate entrances and utilities, each unit maintains its privacy while still being part of a cohesive structure. The layout is thoughtfully designed to maximize space and comfort, making it appealing to a wide range of potential tenants.A must-see for anyone looking to invest or settle down, this property is conveniently located no far from amenities and transportation. Schedule a showing today using ShowingTime to experience the charm and potential this double offers firsthand. Don't miss out on this fantastic opportunity!
Key facts
- Laminate flooring
- Separate utilities
- Ceramic tile
Tags
Neighborhood map
What this means for you Summary
Snapshot
- This is a 4-bed/2.0-bath multifamily listed at $230k.
Deal economics
- At list price, monthly cash flow is $557 ($7k/yr) — positive.
- The deal already cash-flows at list — no discount required.
- Meets the 1% rule at list price ($2k rent vs $230k).
- Recommended offer: $202k (12.0% below list) — sets the bar for market timing.
- Cap rate 9.5% vs local median 4.4% in New Orleans — top-decile yield for the area; either an underpriced asset or a hidden risk that comps aren't pricing in. Stress-test before assuming the spread holds.
Location & tenants
- Location reads 81/100 on livability (#3 in LA, #1,383 nationally) — a professional / high-income tenant draw. Strengths: amenities A+, commute A+, health & safety A+; Watch: crime C-, employment D.
- Orleans Parish (urban): math 11% / reading 27% proficiency, ranked #69 of 98 in LA (top 70%) — low school quality limits family demand, transient renter base, plan for 1-2y turnover; 68% free/reduced lunch — lower-income household profile, screen leases tightly.
- Market conditions: Rents rising (+2.5%/yr); 581 active listings in the ZIP; 40 comparable units currently listed for rent nearby; rentals at typical pace (median 14d on market — plan ~3-4 weeks tenant-placement turnaround); 710 units permitted in Orleans Parish in 2024 (244 in 5+ unit buildings).
- At $2,492/mo this rent would consume 65% of the median local household income ($46k/yr) (locally 1988% of renters already pay >50% of income on rent) — very limited rent-growth headroom before tenants either downsize or default.
Forward outlook
- Local home prices are declining (-3.0%/yr); year-one equity from $2k of loan paydown is wiped out by about $7k of value loss. Plan a longer hold.
- Orleans County population projected at +61% by 2050 — long-run rental-demand tailwind backs the buy-and-hold thesis.
Negotiation context
- It's been on market 346 days — a 12% lower offer ($202k) is reasonable based on typical stale-listing flexibility.
- 2 sale attempts; this cycle's ask is 16329% above the opening price — seller raised mid-cycle; expect resistance to lowballs.
Risks & watch-outs
- Watch-outs: flood insurance adds $66/mo.
- Climate carrying-cost: severe flood risk; severe wind risk, 99% chance of damaging wind over 30y; extreme-heat days projected 7→21/yr by 2055 (HVAC capex compounding) — expect insurance premiums to compound above CPI over the hold.
Questions for the listing agent
- It's been on market 346 days. Have you received any prior offers? Is the seller open to a 12% concession, seller financing, or rate buy-down credit?
- Built in 1970 — when were the roof, HVAC, electrical panel, plumbing, and water heater last replaced?
- What's the actual annual flood-insurance premium (NFIP or private), and is the property in a SFHA with mandatory coverage?
- Why hasn't it sold? Are there any deal-killer items the seller is aware of (foundation, flood, title, zoning, code violations)?
- Is there a deadline driving the sale (1031 exchange, divorce, estate, relocation)? That informs how much negotiation room exists.
- What's the average days-on-market for RENTAL listings here right now (not sales)? A rising rental-DOM trend means longer vacancies and softer asking-rent achievability than the comps imply.
- What's the recent tenant-quality profile in this submarket — average credit score on applications, eviction rate, late-payment / NSF rate, and stable-employment percentage? A property-management company in the area should have these aggregated.
- How much new apartment / multifamily construction is in the pipeline within 1–3 miles? Heavy new supply (>2% of stock underway) typically softens rents 12–24 months out; light construction supports rent growth.
Investment metrics
- 1% rule
- 1.08% ✓
- Cap rate
- 9.54%
- Cash-on-cash
- 11.61%
- DSCR
- 1.52
- GRM
- 7.7
CMA / ARV
- ARV (median comp)
- $179,930
- List price
- $230,000
- Delta
- 27.83%
- Verdict
- OVERPRICED
- Comps
- 20 within 1.0 mi
Show comp detail 2 sales within ~0.75 mi
| Address | Dist | Beds/Ba | Sqft | Sold | Price | $/sf | Match |
|---|---|---|---|---|---|---|---|
| 5406 Urquhart St | 0.63mi | 4/2.0 | 1,368 (-8%) | 12mo | $90,000 | $66 | 47 |
| 1001 3 Gordon St | 0.65mi | 4/2.0 | 1,580 (+6%) | 22mo | $170,000 | $108 | 41 |
Match score weights: distance 35% · size 25% · config 20% · recency 20%. Top-matched comps best support the ARV.
Projected returns pro-forma
-3.0% appreciation · 2.49% rent growth · sell at horizon
- IRR
- -1.3%
- Equity multiple
- 0.95×
- Total profit
- $-3,154
- Equity at exit
- $34,294
- IRR
- 7.8%
- Equity multiple
- 1.58×
- Total profit
- $37,456
- Equity at exit
- $19,886
Cash invested: $64,400 (down + closing). Projections, not guarantees.
Landlord ↔ Tenant lean methodology
- Overall (STATE)
- 90 Strongly Landlord-Friendly
- State Louisiana
- 90 Strongly Landlord-Friendly · R+12
- County
- — inherits STATE
- City
- — inherits STATE
ZIP-level market 70117
- Rents YoY
- 2.5%
- Active inventory
- 581
- Price-to-rent
- 15.4×
Monthly cashflow live
- Estimated rent
- $2,492 high interval (Pro) →
- Mortgage (P&I)
- −$1,206
- Tax from tax record
- −$43 /mo · $522/yr
- Insurance
- −$96
- Flood insurance flood zone
- −$66 /mo · $798/yr
- HOA
- −$0
- Vacancy / Maint / Mgmt
- −$523
- Net cashflow
- $557
Break-even live
2-unit breakdown (identical units grouped — click to expand)
| Units | Beds | Baths | Est. rent |
|---|---|---|---|
| 2× units | 2 | 1 | $2,492 |
| #1 | 2 | 1 | $1,246 |
| #2 | 2 | 1 | $1,246 |
| Total (2 units) | $2,492 | ||
UW: 25.0% down · 7.5% · 30yr · 1.5% tax · 5.0% vac · 8.0% maint · 8.0% mgmt
Financing live
Cash to close
- Down payment
- $57,500
- Closing costs
- $6,900
- Reserves months
- —
- Total cash needed
- —
Loan-product check · same deal, 3 products live
Conventional
25% down · 7.5% · 30yr
- Down + closing
- —
- Monthly P&I
- —
- Monthly cashflow
- —
- DSCR
- —
- Eligible?
- —
Personal DTI + credit; lowest rate.
DSCR
20% down · 8.5% · 30yr
- Down + closing
- —
- Monthly P&I
- —
- Monthly cashflow
- —
- DSCR
- —
- Eligible?
- —
No personal income docs; deal must DSCR.
Hard money
10% down · 12.0% · 12mo
- Down + closing
- —
- Monthly P&I
- —
- Monthly cashflow
- —
- DSCR
- —
- Eligible?
- —
Short-term bridge; refi at stabilization.
Rent comps 40 comps
| Address | Beds | Baths | Sqft | Rent | $/sqft | DOM | Units | Dist |
|---|---|---|---|---|---|---|---|---|
| 1901 Tupelo St New Orleans, LA | 3.0 | 2.5 | 1568 | $2,300 | $1.47 | 3d | 1 | 0.05mi |
| 1824 Saint Maurice Ave New Orleans, LA | 4.0 | 2.0 | 1500 | $1,500 | $1.00 | 23d | 1 | 0.10mi |
| 1925 Alabo St Unit A New Orleans, LA | 3.0 | 2.0 | 1199 | $1,500 | $1.25 | 21d | 1 | 0.14mi |
| 5900 N Derbigny St Unit 1 New Orleans, LA | 3.0 | 2.0 | 1000 | $1,950 | $1.95 | 3d | 1 | 0.19mi |
| 1714 Tricou St New Orleans, LA | 3.0 | 2.0 | 1271 | $1,900 | $1.49 | 23d | 1 | 0.20mi |
| 5618 N Tonti St New Orleans, LA | 3.0 | 2.0 | 1128 | $1,550 | $1.37 | 23d | 1 | 0.40mi |
| 1835 Andry St New Orleans, LA | 3.0 | 2.0 | 918 | $1,800 | $1.96 | 23d | 1 | 0.47mi |
| 1314 Lamanche St New Orleans, LA | 4.0 | 1.0 | 1300 | $2,100 | $1.62 | 15d | 1 | 0.49mi |
| 1327 Fats Domino Ave Unit A New Orleans, LA | 3.0 | 2.0 | 1200 | $1,900 | $1.58 | 3d | 1 | 0.49mi |
| 1327 Fats Domino Ave Unit B New Orleans, LA | 4.0 | 2.0 | 1200 | $2,200 | $1.83 | 15d | 1 | 0.49mi |
| 1301 Lamanche St New Orleans, LA | 3.0 | 2.0 | 1178 | $1,600 | $1.36 | 23d | 1 | 0.49mi |
| 1301 Lamanche St New Orleans, LA | 3.0 | 2.0 | 1090 | $1,600 | $1.47 | 2d | 1 | 0.49mi |
| 1301 Lamanche St New Orleans, LA | 3.0 | 2.0 | 1090 | $1,600 | $1.47 | 3d | 1 | 0.49mi |
| 2012 Esteban St Arabi, LA | 3.0 | 2.0 | 1466 | $2,500 | $1.71 | 10d | 1 | 0.50mi |
| 1201 Gordon St New Orleans, LA | 3.0 | 2.5 | 1367 | $1,900 | $1.39 | 16d | 1 | 0.52mi |
| 1333 Angela Ave Arabi, LA | 3.0 | 2.0 | 1090 | $1,850 | $1.70 | 2d | 1 | 0.57mi |
| 2301 Esteban St Arabi, LA | 3.0 | 1.0 | 1102 | $1,800 | $1.63 | 14d | 1 | 0.59mi |
| 2539 Fats Domino Ave New Orleans, LA | 3.0 | 2.0 | 1184 | $1,850 | $1.56 | 20d | 1 | 0.59mi |
| 1422 Andry St New Orleans, LA | 3.0 | 2.0 | 1100 | $1,400 | $1.27 | 3d | 1 | 0.60mi |
| 5461 Saint Claude Ave New Orleans, LA | 4.0 | 2.0 | 1250 | $2,350 | $1.88 | 23d | 1 | 0.69mi |
| 6038 N Rampart St New Orleans, LA | 3.0 | 2.0 | 1080 | $1,795 | $1.66 | 23d | 1 | 0.69mi |
| 5459 Saint Claude Ave Unit 5461 New Orleans, LA | 4.0 | 2.0 | 1454 | $2,350 | $1.62 | 23d | 1 | 0.70mi |
| 906 Flood St New Orleans, LA | 3.0 | 3.0 | 1174 | $1,700 | $1.45 | 1d | 1 | 0.83mi |
| 1529 Schnell Dr Arabi, LA | 3.0 | 2.5 | 1736 | $2,600 | $1.50 | 1d | 1 | 0.91mi |
| 1511 Schnell Dr Arabi, LA | 4.0 | 3.0 | 1700 | $1,850 | $1.09 | 3d | 1 | 0.92mi |
| 7532 Patricia St Arabi, LA | 3.0 | 2.0 | 1850 | $1,900 | $1.03 | 1d | 1 | 1.05mi |
| 7532 Patricia St Arabi, LA | 3.0 | 2.0 | 1850 | $1,900 | $1.03 | 2d | 1 | 1.05mi |
| 6900 Royal St Arabi, LA | 3.0 | 2.0 | 1579 | $5,888 | $3.73 | 2d | 1 | 1.06mi |
| 617 Forstall St New Orleans, LA | 3.0 | 2.0 | 1262 | $2,200 | $1.74 | 3d | 1 | 1.13mi |
| 309 Fawn Dr Arabi, LA | 3.0 | 2.5 | 1745 | $2,500 | $1.43 | 1d | 1 | 1.16mi |
| 310 Lynx Dr Arabi, LA | 3.0 | 2.0 | 1050 | $1,775 | $1.69 | 23d | 1 | 1.16mi |
| 619 Reynes St New Orleans, LA | 3.0 | 2.0 | 1318 | $2,100 | $1.59 | 15d | 1 | 1.17mi |
| 438 Friscoville Ave Arabi, LA | 3.0 | 2.0 | 1500 | $3,200 | $2.13 | 2d | 1 | 1.22mi |
| 424 Chinchilla Dr Arabi, LA | 3.0 | 2.0 | 1735 | $3,500 | $2.02 | 15d | 1 | 1.23mi |
| 4318 N Robertson St New Orleans, LA | 3.0 | 1.0 | 1250 | $1,150 | $0.92 | 3d | 1 | 1.37mi |
| 4318 1/2 N Robertson St New Orleans, LA | 3.0 | 1.0 | 1250 | $1,150 | $0.92 | 2d | 1 | 1.38mi |
| 4230 N Claiborne Ave New Orleans, LA | 3.0 | 2.5 | 1296 | $1,750 | $1.35 | 23d | 1 | 1.40mi |
| 1403 Lesseps St New Orleans, LA | 3.0 | 3.0 | 1700 | $1,800 | $1.06 | 11d | 1 | 1.40mi |
| 4222 N Johnson St New Orleans, LA | 3.0 | 2.0 | 1100 | $1,895 | $1.72 | 23d | 1 | 1.40mi |
| 4317 Urquhart St New Orleans, LA | 3.0 | 2.0 | 1300 | $1,650 | $1.27 | 23d | 1 | 1.41mi |
Listing history 16 events
-
2026-06-18days on market $230,000 Active 346 DOM
-
2026-06-17days on market $230,000 Active 345 DOM
-
2026-06-16days on market $230,000 Active 344 DOM
-
2026-06-15days on market $230,000 Active 343 DOM
-
2026-06-13days on market $230,000 Active 341 DOM
-
2026-06-10days on market $230,000 Active 338 DOM
-
2026-06-09days on market $230,000 Active 337 DOM
-
2026-06-08days on market $230,000 Active 336 DOM
-
2026-06-07days on market $230,000 Active 335 DOM
-
2026-06-05days on market $230,000 Active 332 DOM
-
2026-06-03days on market $230,000 Active 331 DOM
-
2026-06-02days on market $230,000 Active 330 DOM
-
2026-06-01days on market $230,000 Active 329 DOM
-
2026-05-31days on market $230,000 Active 328 DOM
-
2026-05-15$1,400
-
2025-06-24$230,000 Active 1056-char remark
Show marketing remark (1056 chars)
Beautifully renovated corner double. 98% completed, each unit has its own identity, making it a great property for an owner-occupant. Let your tenant help pay the mortgage or consider it as an excellent addition to your investment portfolio. One side features elegant ceramic tile throughout, providing a sleek and modern aesthetic, while the other side combines laminate flooring with ceramic accents, offering both style and durability.This property is not just a living space; it's a versatile investment opportunity. With separate entrances and utilities, each unit maintains its privacy while still being part of a cohesive structure. The layout is thoughtfully designed to maximize space and comfort, making it appealing to a wide range of potential tenants.A must-see for anyone looking to invest or settle down, this property is conveniently located no far from amenities and transportation. Schedule a showing today using ShowingTime to experience the charm and potential this double offers firsthand. Don't miss out on this fantastic opportunity!
ⓘ Source: listings_history table (triggers on properties + properties_extension) + one-shot
backfill from property_details.listing_events for pre-trigger history.
Tax reassessment forecast LA · Resets to sale price
- Current annual tax
- $522 · $43/mo
- Projected year-2 tax
- $1,265 · $105/mo
- Expected delta
- +$743/yr (+$62/mo · 142.4%)
ⓘ Screening estimate from a state-policy table — verify with the county assessor before closing.
Climate risk First Street
- Flood 9/10 Extreme FEMA zone X (shaded) · 77% chance over 30 yrs
- Wildfire 1/10 Low
- Heat 10/10 Extreme 7 d/yr ≥108°F today · 21 d/yr by 30 yrs out
- Wind 10/10 Extreme 99% chance of damaging wind over 30 yrs
- Air quality 3/10 Moderate 3 unhealthy d/yr today · 3 by 30 yrs out
Nearby sold comps map
Loading sold comps map…
Walkable amenities ~0.75 mi
Loading nearby amenities…
Taxation est. · year 1
- Rental income
- $29,904
- − Mortgage interest
- −$12,884
- − Property taxes
- −$522
- − Insurance
- −$1,948
- − Repairs & maintenance
- −$2,392
- − Management
- −$2,392
- − Depreciation
- −$6,691
- Taxable income
- $3,075
- Est. tax owed @ 24.0%
- −$738
- After-tax cash flow
- $5,943/yr
For passive investors: Depreciation is non-cash, so a rental often shows a tax loss while cash-flowing — sheltering income. Rental losses are passive: they offset passive income freely, and up to $25,000/yr can offset ordinary (W-2) income if you actively participate and your MAGI is under $100k (phasing out to $0 by $150k); unused losses carry forward. On sale, claimed depreciation is recaptured at up to 25%, and gains may owe capital-gains tax (a 1031 exchange can defer both). Figures are a year-1 estimate at your 24.0% rate — not tax advice; consult a CPA.
Schools (NCES district)
- District
- Orleans Parish
- NCES district ID
- 2201170
- Math proficiency
- 11% ▼ -52.00%
- Reading proficiency
- 27% ▼ -46.00%
- Median HH income
- $37,011
- Composite
- 15.78/100
- National rank
- #9271
- State rank
- #69 of 98 in LA
Livability — New Orleans
- Score
- 81/100
- State rank
- #3
- US rank
- #1383
Category grades
Schools grade is shown separately in the Schools card above.
Census & demographics
- Census place
- New Orleans, LA
- County
- Orleans Parish · 338,817 people
- City population
- 338,817
- Metro
- New Orleans-Metairie, LA
- Population (ZIP)
- 25,652
- Household income
- $45,764
- Rent vs Own
- Severe rent burden
- 1988.0
Population outlook (Orleans County) Hauer SSP2
- Today (2025)
- 513,025 people
- By 2030
- 575,781 · +12.2%
- By 2040
- 700,174 · +36.5%
- By 2050
- 826,541 · +61.1%
- By 2075
- 1,123,374 · +119.0%
- By 2100
- 1,355,609 · +164.2%
Race, ethnicity, and origin ACS 2023
- Neighborhood character
- Majority Black (60%)
- Race & ethnicity
- Black 60% White 30% Two or more races 6% Hispanic / Latino 5%
- Common ancestry
- Lithuanian 5% Italian 1% Romanian 1%
- Foreign-born
- 5% · Canada, South Korea
- Languages at home
- 93% English-only · Spanish 3% Other Indo-European 1% French/Haitian/Cajun 1%
Political lean MEDSL · Orleans
- 2024 margin
- Solid D (+67.0) · D 82.2% · R 15.2% · Other 2.7%
- 2008→2024 swing
- +6.7pp toward D · 2008: 60.3pp · 2024: 67.0pp
- All cycles
- 2024: D+67.0 2020: D+68.2 2016: D+66.2 2012: D+62.5 2008: D+60.3
Not yet ingested
- Civics
- —
Market trends
- HPI YoY
- ▼ -177.22%
- Current HPI
- 184.6061
- Rent YoY
- ▲ 2.49%
- Metro
- New Orleans-Metairie, LA
- State GDP YoY
- ▲ 3.29%
- F500 in state
- 10
Industry mix (Fortune 500 HQ in LA)
| Industry | F500 HQs | Revenue |
|---|---|---|
| Telecommunications | 2 | $23B |
|
||
| Utilities | 1 | $12B |
|
||
| Wholesale / Distribution | 1 | $5B |
|
||
| Advertising | 1 | $2B |
|
||
Price history
-99.4% since first listed2 events — show timeline
- 2026-05-15 Listed for Rent $1,400 RAAMLS
- 2025-06-24 Listed $230,000 AcadianaMLS
Property tax history
+9.2%/yrLatest (2026): $522 · +1.1% YoY. Source: county tax records.
Cash-flow waterfall
monthlySold comps — $/sqft
last 12 mo · ≤1 miLoading sold comps…