28542 Sweet Meadow Dr · North Fort Myers, FL
Flood risk 1/10 · Minimal
- FEMA flood zone
- X (unshaded)
- Chance of flooding over 30 yrs
- 0.0%
- Est. flood insurance / yr
- $507 – $1,088
Fire risk 8/10 · Major
- Est. fire insurance / yr
- $947 – $1,759
Heat risk 9/10 · Severe
- Hot days now (above 107°F)
- 7 days/yr
- Hot days in 30 yrs
- 27 days/yr
Wind risk 10/10 · Severe
- Chance of severe wind over 30 yrs
- 99.0%
Air-quality risk 2/10 · Minimal
- Unhealthy air days now
- 0 days/yr
- Unhealthy air days in 30 yrs
- 3 days/yr
Risk factors via First Street. Map © Google.
Why this score? — see what drove the B+ grade
The composite is a weighted blend of 9 inputs, each scored 0–100. Each bar is that input's sub-score; the figure is the points it added to the 100-point composite (weight × sub-score).
- Cash flow +30.0/30.0
- ARV discount +15.0/15.0
- 1% rule +10.0/10.0
- DSCR +10.0/10.0
- Schools +4.6/10.0
- Condition / age +4.0/5.0
- Livability +3.7/5.0
- Rent growth +2.5/5.0
- Appreciation +0.0/10.0
$224,499
🖨 Deal sheet 📄 Offer letter ✓ Due diligence
Listing remarks
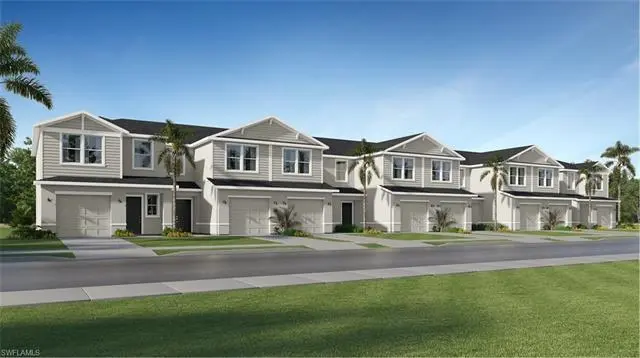
One or more photo(s) has been virtually staged, AI generated or rendered. Discover the enchanting new community of Willow in Punta Gorda, where unparalleled resort-style amenities meet effortless coastal living just minutes from Charlotte Harbor. This new two-story townhome features a smart layout designed to maximize space. On the first floor is an open-plan layout connecting a multifunctional kitchen, lovely dining area and welcoming Great Room, which features sliding glass doors to a patio that’s perfect for outdoor relaxation. Ideally situated upstairs are two secondary bedrooms and a tranquil owner’s suite complete with a private bathroom. Prices, dimensions and features ma
Key facts
- Open plan layout
- Sliding glass doors
- Welcoming great room
Tags
Neighborhood map
What this means for you Summary
Snapshot
- This is a 3-bed/2.5-bath townhouse listed at $224k. Condition is rated good.
Deal economics
- At list price, monthly cash flow is $1k ($17k/yr) — positive.
- The deal already cash-flows at list — no discount required.
- Meets the 1% rule at list price ($4k rent vs $224k).
- Recommended offer: $221k (1.5% below list) — sets the bar for market timing.
- Cap rate 13.9% vs local median 3.6% in North Fort Myers — top-decile yield for the area; either an underpriced asset or a hidden risk that comps aren't pricing in. Stress-test before assuming the spread holds.
Location & tenants
- Location reads 74/100 on livability (#269 in FL, #4,409 nationally) — a middle-class / working-renter tenant base. Strengths: cost of living A+, housing A+, health & safety A+; Watch: employment C-, amenities F, commute F.
- Charlotte (suburban): math 54% / reading 54% proficiency, ranked #22 of 73 in FL (top 30%) — acceptable for families but not a draw, mixed tenant base, ~2y average lease.
- Market conditions: 1481 active listings in the ZIP; 4 comparable units currently listed for rent nearby; rentals at typical pace (median 21d on market — plan ~3-4 weeks tenant-placement turnaround); solid renter incomes; 4,585 units permitted in Charlotte County in 2024 (703 in 5+ unit buildings).
- At $4,084/mo this rent would consume 64% of the median local household income ($77k/yr) (locally 226% of renters already pay >50% of income on rent) — very limited rent-growth headroom before tenants either downsize or default.
Forward outlook
- Local home prices are declining (-3.0%/yr); year-one equity from $2k of loan paydown is wiped out by about $7k of value loss. Plan a longer hold.
- Charlotte County population projected at +24% by 2050 — long-run rental-demand tailwind backs the buy-and-hold thesis.
- At projected returns (-3.0% appreciation + 3.0% rent growth), your $63k cash investment doubles in ~5 years — after that, you're playing with house money.
Negotiation context
- It's been on market 18 days — a 2% lower offer ($221k) is reasonable based on typical stale-listing flexibility.
Risks & watch-outs
- Climate carrying-cost: severe wind risk, 99% chance of damaging wind over 30y; severe wildfire risk; extreme-heat days projected 7→27/yr by 2055 (HVAC capex compounding) — expect insurance premiums to compound above CPI over the hold.
Questions for the listing agent
- What does the HOA fee cover, when was the last increase, and are there any pending special assessments or reserve-fund shortfalls?
- Is there a deadline driving the sale (1031 exchange, divorce, estate, relocation)? That informs how much negotiation room exists.
- What's the average days-on-market for RENTAL listings here right now (not sales)? A rising rental-DOM trend means longer vacancies and softer asking-rent achievability than the comps imply.
- What's the recent tenant-quality profile in this submarket — average credit score on applications, eviction rate, late-payment / NSF rate, and stable-employment percentage? A property-management company in the area should have these aggregated.
- How much new for-sale + rental construction is in the pipeline within 1–3 miles? Heavy new supply typically softens prices + rents 12–24 months out; constrained supply supports both.
Investment metrics
- 1% rule
- 1.82% ✓
- Cap rate
- 13.88%
- Cash-on-cash
- 27.08%
- DSCR
- 2.20
- GRM
- 4.6
CMA / ARV
- ARV (on-the-fly)
- $282,030
- Comps found
- 1
Show comp detail 1 sale within ~0.75 mi
| Address | Dist | Beds/Ba | Sqft | Sold | Price | $/sf | Match |
|---|---|---|---|---|---|---|---|
| 15185 Bluffton Ln #826 | 0.00mi | 2/2.0 (-1) | 1,366 (+2%) | 7mo | $287,000 | $210 | 85 |
Match score weights: distance 35% · size 25% · config 20% · recency 20%. Top-matched comps best support the ARV.
Projected returns pro-forma
-3.0% appreciation · 3.0% rent growth · sell at horizon
- IRR
- 21.1%
- Equity multiple
- 1.86×
- Total profit
- $54,189
- Equity at exit
- $33,474
- IRR
- 29.3%
- Equity multiple
- 3.62×
- Total profit
- $164,414
- Equity at exit
- $19,411
Cash invested: $62,860 (down + closing). Projections, not guarantees.
Landlord ↔ Tenant lean methodology
- Overall (STATE)
- 87 Strongly Landlord-Friendly
- State Florida
- 87 Strongly Landlord-Friendly · R+3
- County
- — inherits STATE
- City
- — inherits STATE
ZIP-level market 33955
- Home prices YoY
- -24.5%
- Active inventory
- 1481
- Price-to-rent
- 4.6×
Monthly cashflow live
- Estimated rent
- $4,084 medium interval (Pro) →
- Mortgage (P&I)
- −$1,177
- Tax est. 1.5%
- −$281 /mo · $3,367/yr
- Insurance
- −$94
- HOA
- −$256
- Vacancy / Maint / Mgmt
- −$858
- Net cashflow
- $1,419
Break-even live
UW: 25.0% down · 7.5% · 30yr · 1.5% tax · 5.0% vac · 8.0% maint · 8.0% mgmt
Financing live
Cash to close
- Down payment
- $56,125
- Closing costs
- $6,735
- Reserves months
- —
- Total cash needed
- —
Loan-product check · same deal, 3 products live
Conventional
25% down · 7.5% · 30yr
- Down + closing
- —
- Monthly P&I
- —
- Monthly cashflow
- —
- DSCR
- —
- Eligible?
- —
Personal DTI + credit; lowest rate.
DSCR
20% down · 8.5% · 30yr
- Down + closing
- —
- Monthly P&I
- —
- Monthly cashflow
- —
- DSCR
- —
- Eligible?
- —
No personal income docs; deal must DSCR.
Hard money
10% down · 12.0% · 12mo
- Down + closing
- —
- Monthly P&I
- —
- Monthly cashflow
- —
- DSCR
- —
- Eligible?
- —
Short-term bridge; refi at stabilization.
Rent comps 4 comps
| Address | Beds | Baths | Sqft | Rent | $/sqft | DOM | Units | Dist |
|---|---|---|---|---|---|---|---|---|
| 15285 Green Acres AVE #418 Punta Gorda, FL | 3.0 | 2.0 | 1301 | $4,795 | $3.69 | 21d | 1 | 0.03mi |
| 15195 Bluffton LN #917 Punta Gorda, FL | 2.0 | 2.0 | 1355 | $5,500 | $4.06 | 21d | 1 | 0.03mi |
| 14778 Martingale PL Punta Gorda, FL | 3.0 | 2.0 | 1417 | $2,300 | $1.62 | 13d | 1 | 0.03mi |
| 15375 Green Acres AVE #2217 Babcock Ranch, FL | 2.0 | 2.0 | 1120 | $1,600 | $1.43 | 13d | 1 | 0.43mi |
HOA detail
- Monthly dues
- $256 · $3,072/yr
Listing history 2 events
-
2026-04-21status Pending
-
2026-04-03$224,499 Active
ⓘ Source: listings_history table (triggers on properties + properties_extension) + one-shot
backfill from property_details.listing_events for pre-trigger history.
Climate risk First Street
- Flood 1/10 Low FEMA zone X (unshaded) · 0% chance over 30 yrs
- Wildfire 8/10 Severe
- Heat 9/10 Extreme 7 d/yr ≥107°F today · 27 d/yr by 30 yrs out
- Wind 10/10 Extreme 99% chance of damaging wind over 30 yrs
- Air quality 2/10 Low 0 unhealthy d/yr today · 3 by 30 yrs out
Nearby sold comps map
Loading sold comps map…
Walkable amenities ~0.75 mi
Loading nearby amenities…
Taxation est. · year 1
- Rental income
- $49,003
- − Mortgage interest
- −$12,575
- − Property taxes
- −$3,367
- − Insurance
- −$1,122
- − Repairs & maintenance
- −$3,920
- − Management
- −$3,920
- − HOA
- −$3,072
- − Depreciation
- −$6,531
- Taxable income
- $14,494
- Est. tax owed @ 24.0%
- −$3,479
- After-tax cash flow
- $13,544/yr
For passive investors: Depreciation is non-cash, so a rental often shows a tax loss while cash-flowing — sheltering income. Rental losses are passive: they offset passive income freely, and up to $25,000/yr can offset ordinary (W-2) income if you actively participate and your MAGI is under $100k (phasing out to $0 by $150k); unused losses carry forward. On sale, claimed depreciation is recaptured at up to 25%, and gains may owe capital-gains tax (a 1031 exchange can defer both). Figures are a year-1 estimate at your 24.0% rate — not tax advice; consult a CPA.
Condition & rehab AI · 12 photos
This well-maintained townhouse in a new community offers a good condition with potential for minor updates to enhance its value.
Value-add opportunities
- Both Painting the exterior and interior walls — Fresh paint can enhance curb appeal and interior aesthetics.
- Both Updating the flooring in the bathrooms — Replacing old tiles with modern materials can improve both resale and rental value.
- Both Upgrading the kitchen appliances — Modernizing the kitchen can attract more buyers and renters.
- Both Adding smart home features — Smart home technology can increase both resale and rental value by making the home more convenient and energy-efficient.
Renovation cost estimate screening
Value-add ROI direction
- Both Painting the exterior and interior walls — Fresh paint can enhance curb appeal and interior aesthetics. ↑
- Both Updating the flooring in the bathrooms — Replacing old tiles with modern materials can improve both resale and rental value. ↑
- Both Upgrading the kitchen appliances — Modernizing the kitchen can attract more buyers and renters. ↑
- Both Adding smart home features — Smart home technology can increase both resale and rental value by making the home more convenient and energy-efficient. ↑
ⓘ Cost ranges are severity-bucket heuristics (US national rule-of-thumb). Get contractor quotes + a written scope before underwriting a rehab budget.
Schools (NCES district)
- District
- Charlotte
- NCES district ID
- 1200240
- Math proficiency
- 54% ▼ -6.00%
- Reading proficiency
- 54% ▼ -1.00%
- Median HH income
- $44,864
- Composite
- 45.62/100
- National rank
- #2586
- State rank
- #22 of 73 in FL
Livability — North Fort Myers
- Score
- 74/100
- State rank
- #269
- US rank
- #4409
Category grades
Schools grade is shown separately in the Schools card above.
Census & demographics
- County
- Charlotte County · 196,994 people
- Metro
- Punta Gorda, FL
- Population (ZIP)
- 12,399
- Household income
- $76,943
- Rent vs Own
- Severe rent burden
- 226.0
Population outlook (Charlotte County) Hauer SSP2
- Today (2025)
- 198,646 people
- By 2030
- 210,507 · +6.0%
- By 2040
- 230,857 · +16.2%
- By 2050
- 247,148 · +24.4%
- By 2075
- 281,777 · +41.8%
- By 2100
- 293,609 · +47.8%
Race, ethnicity, and origin ACS 2023
- Neighborhood character
- Predominantly White (84%)
- Race & ethnicity
- White 84% Hispanic / Latino 10% Two or more races 9% Black 2%
- Hispanic origin (detail)
- Mexican 4% Puerto Rican 2% Cuban 4%
- Common ancestry
- Romanian 5% Italian 3% Serbian 3%
- Foreign-born
- 8% · Canada
- Languages at home
- 91% English-only · Spanish 5% Other Indo-European 1%
Political lean MEDSL · Charlotte
- 2024 margin
- Solid R (+34.0) · D 32.7% · R 66.7%
- 2008→2024 swing
- -26.7pp toward R · 2008: -7.2pp · 2024: -34.0pp
- All cycles
- 2024: R+34.0 2020: R+26.6 2016: R+27.8 2012: R+14.3 2008: R+7.2
Not yet ingested
- Civics
- —
Market trends
- HPI YoY
- ▼ -78.71%
- Current HPI
- 242.9043
- Rent YoY
- —
- Metro
- Punta Gorda, FL
- State GDP YoY
- ▲ 3.28%
- F500 in state
- 36
Industry mix (Fortune 500 HQ in FL)
| Industry | F500 HQs | Revenue |
|---|---|---|
| Industrial Technology | 2 | $29B |
|
||
| Insurance | 2 | $17B |
|
||
| Retail | 1 | $60B |
|
||
| Technology Distribution | 1 | $58B |
|
||
| Homebuilding | 1 | $35B |
|
||
| Technology Manufacturing | 1 | $35B |
|
||
Price history
2 events — show timeline
- 2026-04-21 Pending — NAPLESMLS
- 2026-04-03 Listed $224,499 NAPLESMLS
Cash-flow waterfall
monthlySold comps — $/sqft
last 12 mo · ≤1 miLoading sold comps…