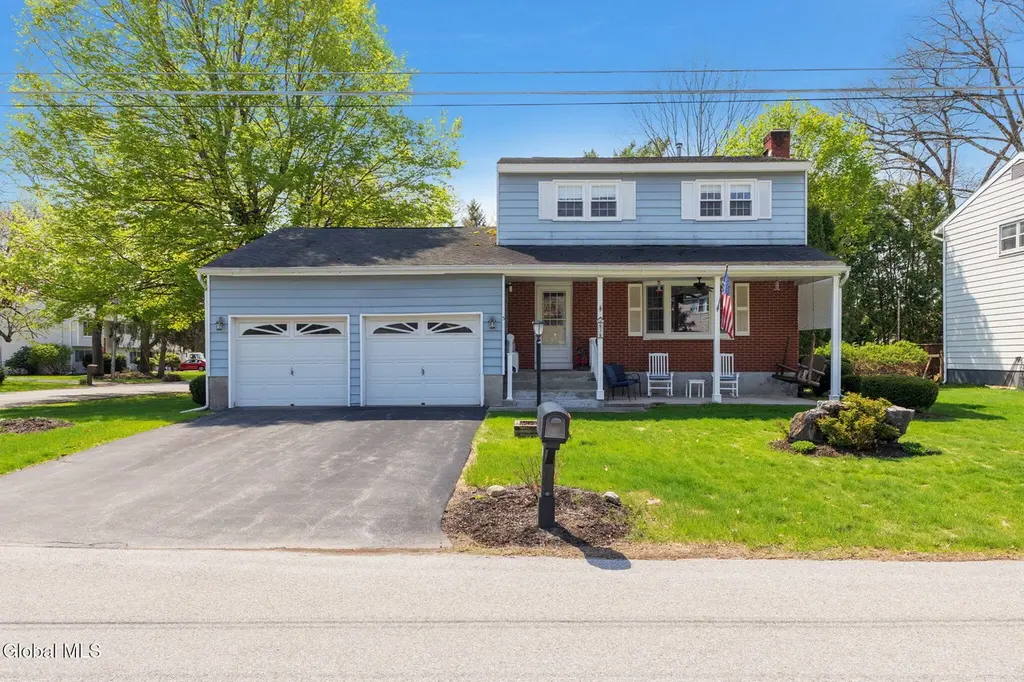
3 Frederick Dr · Saratoga Springs, NY
Flood risk 1/10 · Minimal
- FEMA flood zone
- X
- Chance of flooding over 30 yrs
- 0.0%
- Est. flood insurance / yr
- $473 – $860
Fire risk 3/10 · Minor
- Est. fire insurance / yr
- $691 – $1,283
Heat risk 3/10 · Minor
- Hot days now (above 97°F)
- 7 days/yr
- Hot days in 30 yrs
- 16 days/yr
Wind risk 2/10 · Minimal
- Chance of severe wind over 30 yrs
- 4.0%
Air-quality risk 1/10 · Minimal
- Unhealthy air days now
- 0 days/yr
- Unhealthy air days in 30 yrs
- 0 days/yr
Risk factors via First Street. Map © Google.
Why this score? — see what drove the D grade
The composite is a weighted blend of 9 inputs, each scored 0–100. Each bar is that input's sub-score; the figure is the points it added to the 100-point composite (weight × sub-score).
- ARV discount +15.0/15.0
- Cash flow +7.2/30.0
- Schools +6.1/10.0
- Rent growth +4.8/5.0
- Livability +4.1/5.0
- Condition / age +2.5/5.0
- 1% rule +1.4/10.0
- DSCR +1.4/10.0
- Appreciation +0.0/10.0
$459,900
🖨 Deal sheet (PDF) 📄 Offer letter ✓ Due diligence
Listing remarks
This charming and spacious 3 bedroom colonial is located in a sought-after, quiet neighborhood on a desirable corner lot just one mile from vibrant downtown Saratoga Springs. Enjoy the perfect blend of a neighborhood setting and being just 1 mile away from renowned dining, shopping, entertainment and State Park. The corner lot offers added space, natural light, and curb appeal. Whether you're relaxing at home or heading into town, this location delivers the best of both worlds--serenity and accessibility. 3 Frederick Dr is your perfect opportunity to own in one of Saratoga Springs' desirable areas--don't miss it. Come add your own personal touches and make this very well cared for home you
Key facts
- Accessibility
- Natural light
- Curb appeal
Tags
Property features AI
Exterior
- Parking: Two-car garage; Four total parking spaces
- Security: Smoke detectors; Carbon monoxide detectors
- Utilities: Public water; Public sewer; Electric with circuit breakers
- Home design: Single-family residence; Facing direction not specified
- Construction: Aluminum siding; Asphalt roof; Full unfinished basement
- Exterior features: Deck; Front porch; Paved driveway; Outdoor lighting; Wood fencing; Corner lot
Interior
- Kitchen: Range; Microwave; Dishwasher; Refrigerator
- Bedrooms: Three bedrooms on the second floor
- Flooring: Hardwood floors
- Bathrooms: One full bathroom on the second floor; One half bathroom on the first floor
- Heating & cooling: Natural gas heating; Central air conditioning
- Interior features: High speed internet; Ceiling paddle fans; Sliding glass doors; Living room fireplace
- Laundry & utility: Washer and dryer (included); Laundry located in the basement; Basement has a sump pump and is unfinished
Neighborhood map
What this means for you Summary
Snapshot
- This is a 3-bed/1.5-bath single-family listed at $460k.
Deal economics
- At list price, monthly cash flow is $-625 ($-8k/yr) — negative.
- To cash-flow at today's rent, offer at most $349k (24.0% below list).
- To meet the 1% rule (rent ≥ 1% of price), the offer needs to be $294k (36.0% below list).
- Recommended offer: $294k (36.0% below list) — sets the bar for 1% rule.
- Cap rate 4.7% vs local median 2.0% in Saratoga Springs — top-decile yield for the area; either an underpriced asset or a hidden risk that comps aren't pricing in. Stress-test before assuming the spread holds.
Location & tenants
- Location reads 82/100 on livability (#83 in NY, #1,284 nationally) — a professional / high-income tenant draw. Strengths: employment A+, housing A+, health & safety A; Watch: amenities D+, cost of living F.
- Saratoga Springs City SD (suburban): math 67% / reading 72% proficiency, ranked #138 of 590 in NY (top 23%) — acceptable for families but not a draw, mixed tenant base, ~2y average lease; only 15% free/reduced lunch — higher-income household profile.
- Zoned schools: Lake Avenue Elementary School (math 82% / reading 82%, grade A+, #138 of 2,108 statewide, top 8%, 393 students, 21% FRL); Maple Avenue Middle School (math 46% / reading 69%, grade B, #187 of 729 statewide, top 26%, 1,392 students, 27% FRL); Saratoga Springs High School (math 98% / reading 92%, grade A+, #83 of 1,100 statewide, top 8%, 1,947 students, 26% FRL).
- Market conditions: Rents rising fast (+9.2%/yr); 474 active listings in the ZIP; 24 comparable units currently listed for rent nearby; rentals lingering (median 46d on market — plan ~5-8 weeks vacancy on turnover, expect pricing pressure); 50% of comp listings sitting > 30 days — soft ceiling on asking rent; solid renter incomes; 1,132 units permitted in Saratoga County in 2024 (378 in 5+ unit buildings).
- This rent runs 35% of the median local income ($102k/yr) — at the standard rent-burdened threshold; future hikes will face affordability resistance.
Forward outlook
- Local home prices are declining (-3.0%/yr); year-one equity from $3k of loan paydown is wiped out by about $14k of value loss. Plan a longer hold.
- Saratoga County population projected at +4% by 2050 — modest demand growth; plan on rents tracking national, not racing it.
Negotiation context
- It's been on market 19 days — a 2% lower offer ($453k) is reasonable based on typical stale-listing flexibility.
Questions for the listing agent
- What do current leases actually rent for vs. the listed asking? Can we see a recent rent roll and the last 12 months of T-12 income?
- Built in 1973 — when were the roof, HVAC, electrical panel, plumbing, and water heater last replaced?
- Is there a deadline driving the sale (1031 exchange, divorce, estate, relocation)? That informs how much negotiation room exists.
- Schools are A-rated — typically a magnet for longer-tenancy family renters. What's the average tenant stay here, and is there a school-zone premium baked into asking?
- The area grade is low — what's the realistic commute time and amenity access for the typical tenant pool here? Any planned neighborhood developments (good or bad) we should know about?
- What's the average days-on-market for RENTAL listings here right now (not sales)? A rising rental-DOM trend means longer vacancies and softer asking-rent achievability than the comps imply.
- What's the recent tenant-quality profile in this submarket — average credit score on applications, eviction rate, late-payment / NSF rate, and stable-employment percentage? A property-management company in the area should have these aggregated.
- How much new for-sale + rental construction is in the pipeline within 1–3 miles? Heavy new supply typically softens prices + rents 12–24 months out; constrained supply supports both.
Investment metrics
- 1% rule
- 0.64% ✗
- Cap rate
- 4.66%
- Cash-on-cash
- -5.83%
- DSCR
- 0.74
- GRM
- 13.0
CMA / ARV
- ARV (median comp)
- $557,105
- List price
- $459,900
- Delta
- -17.45%
- Verdict
- UNDERPRICED
- Comps
- 20 within 1.0 mi
Show comp detail 11 sales within ~0.75 mi
| Address | Dist | Beds/Ba | Sqft | Sold | Price | $/sf | Match |
|---|---|---|---|---|---|---|---|
| 261 W Circular St | 0.21mi | 3/2.0 | 1,653 (+10%) | 4mo | $620,000 | $375 | 69 |
| 177 Elm St | 0.62mi | 3/2.0 | 1,541 (+2%) | 0mo | $475,000 | $308 | 65 |
| 13 Frederick Dr | 0.11mi | 4/2.5 (+1) | 1,662 (+10%) | 7mo | $518,000 | $312 | 63 |
| 8 Michael Dr | 0.22mi | 3/2.5 | 1,378 (-9%) | 12mo | $470,000 | $341 | 62 |
| 12 Hyde St | 0.44mi | 4/2.0 (+1) | 1,404 (-7%) | 2mo | $368,000 | $262 | 60 |
| 17 Birch St | 0.45mi | 3/1.0 | 1,408 (-7%) | 8mo | $537,500 | $382 | 59 |
| 257 W Circular St | 0.22mi | 3/1.0 | 1,640 (+9%) | 21mo | $380,000 | $232 | 56 |
| 36 Ash St | 0.73mi | 3/2.5 | 1,554 (+3%) | 2mo | $711,000 | $458 | 55 |
| 23 Myrtle St | 0.67mi | 3/2.0 | 1,514 (+0%) | 15mo | $530,000 | $350 | 54 |
| 159 W Circular St | 0.53mi | 3/2.0 | 1,704 (+13%) | 11mo | $685,000 | $402 | 42 |
| 30 Andrews St | 0.71mi | 3/2.0 | 1,577 (+4%) | 23mo | $582,000 | $369 | 38 |
Match score weights: distance 35% · size 25% · config 20% · recency 20%. Top-matched comps best support the ARV.
Projected returns pro-forma
-3.0% appreciation · 8.0% rent growth · sell at horizon
- IRR
- -21.4%
- Equity multiple
- 0.23×
- Total profit
- $-98,901
- Equity at exit
- $68,573
- IRR
- -6.8%
- Equity multiple
- 0.48×
- Total profit
- $-67,021
- Equity at exit
- $39,764
Cash invested: $128,772 (down + closing). Projections, not guarantees.
Landlord ↔ Tenant lean methodology
- Overall (STATE)
- 15 Strongly Tenant-Friendly
- State New York
- 15 Strongly Tenant-Friendly · D+10
- County
- — inherits STATE
- City
- — inherits STATE
ZIP-level market 12866
- Home prices YoY
- -31.8%
- Rents YoY
- 9.2%
- Active inventory
- 474
- Price-to-rent
- 13.0×
Monthly cashflow live
- Estimated rent
- $2,943 high interval (Pro) →
- Mortgage (P&I)
- −$2,412
- Tax from tax record
- −$347 /mo · $4,161/yr
- Insurance
- −$192
- HOA
- −$0
- Vacancy / Maint / Mgmt
- −$618
- Net cashflow
- $-625
Break-even live
Sensitivity live
| Price | -10% $-365 | -5% $-495 | +0% $-625 | +5% $-756 | +10% $-886 |
|---|---|---|---|---|---|
| Rent | -10% $-858 | -5% $-742 | +0% $-625 | +5% $-509 | +10% $-393 |
| Rate | -1.0pp $-394 | -0.5pp $-508 | base $-625 | +0.5pp $-745 | +1.0pp $-866 |
UW: 25.0% down · 7.5% · 30yr · 1.5% tax · 5.0% vac · 8.0% maint · 8.0% mgmt
Financing live
Cash to close
- Down payment
- $114,975
- Closing costs
- $13,797
- Reserves months
- —
- Total cash needed
- —
Loan-product check · same deal, 3 products live
Conventional
25% down · 7.5% · 30yr
- Down + closing
- —
- Monthly P&I
- —
- Monthly cashflow
- —
- DSCR
- —
- Eligible?
- —
Personal DTI + credit; lowest rate.
DSCR
20% down · 8.5% · 30yr
- Down + closing
- —
- Monthly P&I
- —
- Monthly cashflow
- —
- DSCR
- —
- Eligible?
- —
No personal income docs; deal must DSCR.
Hard money
10% down · 12.0% · 12mo
- Down + closing
- —
- Monthly P&I
- —
- Monthly cashflow
- —
- DSCR
- —
- Eligible?
- —
Short-term bridge; refi at stabilization.
Rent comps 24 comps
| Address | Beds | Baths | Sqft | Rent | $/sqft | DOM | Units | Dist |
|---|---|---|---|---|---|---|---|---|
| 116 West Ave Saratoga Springs, NY | 2.0 | 2.0 | 1135 | $20,000 | $17.62 | 25d | 1 | 0.17mi |
| 11 Outlook Ave Saratoga Springs, NY | 3.0 | 2.5 | 1706 | $28,000 | $16.41 | 25d | 1 | 0.38mi |
| 194 Grand Ave Saratoga Springs, NY | 4.0 | 2.5 | 2200 | $28,000 | $12.73 | 45d | 1 | 0.57mi |
| 68 Marvin St Saratoga Springs, NY | 2.0 | 1.0 | 1100 | $2,500 | $2.27 | 25d | 1 | 0.70mi |
| 292 Washington St Saratoga Springs, NY | 3.0 | 1.0 | 1100 | $2,500 | $2.27 | 45d | 1 | 0.82mi |
| 99 1/2 Walworth St Saratoga Springs, NY | 3.0 | 2.0 | 1152 | $3,200 | $2.78 | 45d | 1 | 0.88mi |
| 17 Van Dorn St Saratoga Springs, NY | 2.0 | 1.5 | 1342 | $18,000 | $13.41 | 45d | 1 | 0.95mi |
| 55 Railroad Pl Saratoga Springs, NY | 1.0–3.0 | 1.0–2.0 | 1097 | $3,570 | $3.25 | 21d | 2 | 0.99mi |
| 110 Van Dam St Saratoga Springs, NY | 2.0 | 1.0 | 1120 | $2,600 | $2.32 | 45d | 1 | 1.02mi |
| 106 Van Dam St Saratoga Springs, NY | 2.0 | 2.5 | 1612 | $18,000 | $11.17 | 21d | 1 | 1.03mi |
| 26 Quiet Harbor Dr Saratoga Springs, NY | 2.0–3.0 | 1.0–2.5 | 1179 | $2,500 | $2.12 | 15d | 1 | 1.06mi |
| 1 Spring St Saratoga Springs, NY | 3.0 | 2.0 | 1340 | $30,000 | $22.39 | 45d | 1 | 1.07mi |
| 425 Broadway Saratoga Springs, NY | 2.0 | 1.0 | 1100 | $2,800 | $2.55 | 45d | 1 | 1.11mi |
| 59 Van Dam St Saratoga Springs, NY | 3.0 | 1.0 | 1148 | $2,500 | $2.18 | 45d | 1 | 1.18mi |
| 37 Henry St Saratoga Springs, NY | 2.0 | 2.0 | 1890 | $22,000 | $11.64 | 45d | 1 | 1.19mi |
| 8 Furlong St Saratoga Springs, NY | 3.0 | 2.5 | 2242 | $1,000 | $0.45 | 45d | 1 | 1.19mi |
| 30 Lake Ave Saratoga Springs, NY | 2.0 | 1.0–2.0 | 976 | $3,190 | $3.27 | 16d | 7 | 1.26mi |
| 5 Alger St Saratoga Springs, NY | 3.0 | 1.5 | 1540 | $2,750 | $1.79 | 45d | 1 | 1.28mi |
| 74 Caroline St Saratoga Springs, NY | 2.0 | 2.0 | 1200 | $2,795 | $2.33 | 25d | 1 | 1.29mi |
| 55 State St Saratoga Springs, NY | 4.0 | 3.0 | 2216 | $20,000 | $9.03 | 16d | 1 | 1.30mi |
| 38 High Rock Ave Saratoga Springs, NY | 2.0 | 2.5 | 1589 | $25,000 | $15.73 | 45d | 1 | 1.34mi |
| 77 White St Saratoga Springs, NY | 4.0 | 2.5 | 2088 | $4,950 | $2.37 | 25d | 1 | 1.36mi |
| 156 Circular St Unit 3 Saratoga Springs, NY | 2.0 | 2.0 | 1600 | $3,250 | $2.03 | 25d | 1 | 1.44mi |
| 10 Marion Pl Saratoga Springs, NY | 4.0 | 2.0 | 1800 | $4,500 | $2.50 | 25d | 1 | 1.48mi |
Listing history 2 events
-
2026-05-13historical Contingent 759-char remark
-
2026-05-07$459,900 Active 759-char remark
ⓘ Source: listings_history table (triggers on properties + properties_extension) + one-shot
backfill from property_details.listing_events for pre-trigger history.
Tax reassessment forecast NY · Partial reset (capped growth)
- Current annual tax
- $4,161 · $347/mo
- Projected year-2 tax
- $5,967 · $497/mo
- Expected delta
- +$1,806/yr (+$150/mo · 43.4%)
ⓘ Screening estimate from a state-policy table — verify with the county assessor before closing.
Climate risk First Street
- Flood 1/10 Low FEMA zone X · 0% chance over 30 yrs
- Wildfire 3/10 Moderate
- Heat 3/10 Moderate 7 d/yr ≥97°F today · 16 d/yr by 30 yrs out
- Wind 2/10 Low 4% chance of damaging wind over 30 yrs
- Air quality 1/10 Low 0 unhealthy d/yr today · 0 by 30 yrs out
Nearby sold comps map
Loading sold comps map…
Walkable amenities ~0.75 mi
Loading nearby amenities…
Taxation est. · year 1
- Rental income
- $35,313
- − Mortgage interest
- −$25,762
- − Property taxes
- −$4,161
- − Insurance
- −$2,300
- − Repairs & maintenance
- −$2,825
- − Management
- −$2,825
- − Depreciation
- −$13,379
- Taxable loss
- −$15,939
- Est. tax savings @ 24.0%
- +$3,825
- After-tax cash flow
- $-3,680/yr
For passive investors: Depreciation is non-cash, so a rental often shows a tax loss while cash-flowing — sheltering income. Rental losses are passive: they offset passive income freely, and up to $25,000/yr can offset ordinary (W-2) income if you actively participate and your MAGI is under $100k (phasing out to $0 by $150k); unused losses carry forward. On sale, claimed depreciation is recaptured at up to 25%, and gains may owe capital-gains tax (a 1031 exchange can defer both). Figures are a year-1 estimate at your 24.0% rate — not tax advice; consult a CPA.
Schools (NCES district)
- District
- Saratoga Springs City SD
- NCES district ID
- 3625770
- Math proficiency
- 67% ▼ -10.00%
- Reading proficiency
- 72% ▲ 6.00%
- Median HH income
- $69,864
- Composite
- 60.83/100
- National rank
- #818
- State rank
- #138 of 590 in NY
Livability — Saratoga Springs
- Score
- 82/100
- State rank
- #83
- US rank
- #1284
Category grades
Schools grade is shown separately in the Schools card above.
Census & demographics
- Census place
- Saratoga Springs, NY
- County
- Saratoga County · 166,192 people
- City population
- 40,057
- Metro
- Albany-Schenectady-Troy, NY
- Population (ZIP)
- 40,057
- Household income
- $101,901
- Rent vs Own
- Severe rent burden
- 1424.0
Population outlook (Saratoga County) Hauer SSP2
- Today (2025)
- 238,889 people
- By 2030
- 243,681 · +2.0%
- By 2040
- 249,118 · +4.3%
- By 2050
- 248,638 · +4.1%
- By 2075
- 241,675 · +1.2%
- By 2100
- 213,150 · -10.8%
Race, ethnicity, and origin ACS 2023
- Neighborhood character
- Predominantly White (87%)
- Race & ethnicity
- White 87% Two or more races 5% Hispanic / Latino 4% Asian 2% Black 2%
- Common ancestry
- Romanian 6% Lithuanian 5% Slovak 2%
- Foreign-born
- 6% · Canada, South Korea, China
- Languages at home
- 92% English-only · Spanish 2% German/W. Germanic 1% Korean 1%
Political lean MEDSL · Saratoga
- 2024 margin
- Toss-up / Even · D 50.9% · R 49.1%
- 2008→2024 swing
- -1.6pp toward R · 2008: 3.4pp · 2024: 1.8pp
- All cycles
- 2024: D+1.8 2020: D+5.4 2016: R+4.4 2012: D+2.1 2008: D+3.4
Not yet ingested
- Civics
- —
Market trends
- HPI YoY
- ▼ -178.78%
- Current HPI
- 382.7429
- Rent YoY
- ▲ 9.15%
- Metro
- Albany-Schenectady-Troy, NY
- State GDP YoY
- ▲ 2.60%
- F500 in state
- 92
Industry mix (Fortune 500 HQ in NY)
| Industry | F500 HQs | Revenue |
|---|---|---|
| Financial Services | 10 | $950B |
|
||
| Consumer Goods | 9 | $162B |
|
||
| Insurance | 4 | $225B |
|
||
| Telecommunications | 2 | $144B |
|
||
| Pharmaceuticals | 2 | $112B |
|
||
| Media / Entertainment | 2 | $69B |
|
||
Price history
3 events — show timeline
- 2026-05-26 Pending — Global MLS
- 2026-05-13 Contingent — Global MLS
- 2026-05-07 Listed $459,900 Global MLS
Property tax history
+3.4%/yrLatest (2025): $4,161 · +8.2% YoY. Source: county tax records.
Cash-flow waterfall
monthlySold comps — $/sqft
last 12 mo · ≤1 miLoading sold comps…