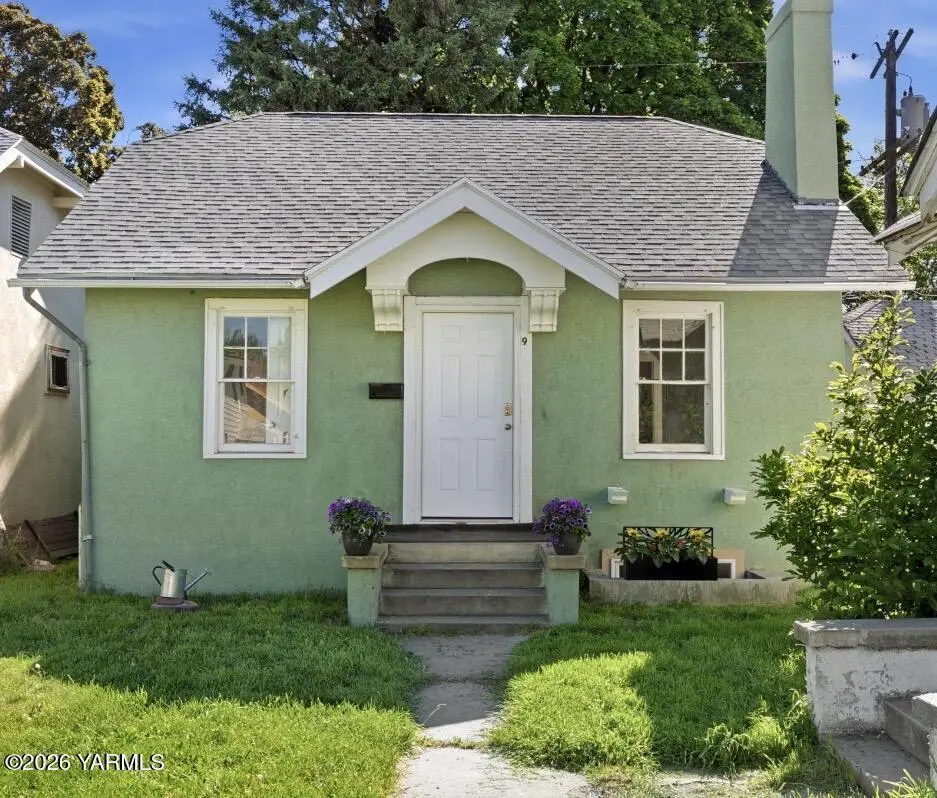
9 N 15th Ave · Yakima, WA
Flood risk 1/10 · Minimal
- FEMA flood zone
- X (unshaded)
- Chance of flooding over 30 yrs
- 0.0%
- Est. flood insurance / yr
- $473 – $860
Fire risk 1/10 · Minimal
- Est. fire insurance / yr
- $604 – $1,122
Heat risk 4/10 · Minor
- Hot days now (above 97°F)
- 7 days/yr
- Hot days in 30 yrs
- 14 days/yr
Wind risk 1/10 · Minimal
- Chance of severe wind over 30 yrs
- —
Air-quality risk 9/10 · Severe
- Unhealthy air days now
- 16 days/yr
- Unhealthy air days in 30 yrs
- 19 days/yr
Risk factors via First Street. Map © Google.
Why this score? — see what drove the F grade
The composite is a weighted blend of 9 inputs, each scored 0–100. Each bar is that input's sub-score; the figure is the points it added to the 100-point composite (weight × sub-score).
- ARV discount +15.0/15.0
- Cash flow +5.5/30.0
- Livability +4.0/5.0
- Rent growth +3.8/5.0
- Schools +3.4/10.0
- Condition / age +2.5/5.0
- 1% rule +0.1/10.0
- DSCR +0.0/10.0
- Appreciation +0.0/10.0
$235,000
🖨 Deal sheet 📄 Offer letter ✓ Due diligence
Listing remarks MLS
Large 2 bedroom 1 bath home with additional nonconforming room in the basement that has been used as a sleeping area. New Carpets and a large basement. formal dining area, fireplace. The air conditioning unit does not work so window air conditioners have been used to cool the home. according to the past owner one of the spaces in the joint garage belongs to the house. the one closest to the house. buyer is to verify this. street parking on 15th ave and more space on the cross street Belmont AveThe owner is a licensed real estate broker in Washington State and the data for the listing was obtained from the county data online, The buyer shall verify all the data to their liking before purchasing
Key facts
- Inviting fireplace
- Remodeled shower
- 2,178 sq ft lot
Tags
Property features AI
Finance
- Other: Zoning: R3 - Multi Fam Res
Exterior
- Parking: Off-street parking
- Utilities: Public water; Sewer connected
- Home design: Single-family residence; 1 story; Residential property
- Construction: Frame and stucco construction; Composition roof
- Exterior features: Garden; Shed(s)
Interior
- Kitchen: Dishwasher; Range; Refrigerator; Oven
- Flooring: Carpet; Concrete; Tile
- Bathrooms: 1 full bathroom
- Heating & cooling: Natural gas heating; Space heater
- Interior features: Fireplace (1); Partially finished basement
Neighborhood map
What this means for you Summary
Snapshot
- This is a 2-bed/1.0-bath single-family listed at $235k.
Deal economics
- At list price, monthly cash flow is $-504 ($-6k/yr) — negative.
- To cash-flow at today's rent, offer at most $146k (37.9% below list).
- To meet the 1% rule (rent ≥ 1% of price), the offer needs to be $119k (49.3% below list).
- Recommended offer: $119k (49.3% below list) — sets the bar for 1% rule.
Location & tenants
- Location reads 80/100 on livability (#98 in WA, #1,912 nationally) — a professional / high-income tenant draw. Strengths: amenities A+, commute A+, housing A+; Watch: employment D, crime F.
- Yakima School District (urban): math 34% / reading 42% proficiency, ranked #238 of 291 in WA (top 82%) — families likely to look elsewhere, expect single-tenant / working-renter base with shorter leases; 76% free/reduced lunch — lower-income household profile, screen leases tightly.
- Market conditions: Rents rising fast (+5.1%/yr); 185 active listings in the ZIP; 22 comparable units currently listed for rent nearby; rentals lingering (median 44d on market — plan ~5-8 weeks vacancy on turnover, expect pricing pressure); 55% of comp listings sitting > 30 days — soft ceiling on asking rent; 468 units permitted in Yakima County in 2024 (23 in 5+ unit buildings).
Forward outlook
- Local home prices are declining (-3.0%/yr); year-one equity from $2k of loan paydown is wiped out by about $7k of value loss. Plan a longer hold.
- Yakima County population projected at +6% by 2050 — modest demand growth; plan on rents tracking national, not racing it.
Negotiation context
- It's been on market 42 days — a 3% lower offer ($228k) is reasonable based on typical stale-listing flexibility.
- 3 sale attempts since 5y ago; this cycle's ask has dropped $14k (6%) from the opening price — seller is motivated, your offer sets the floor, not the list.
- Current owner paid $145k; list at $235k implies a 62% gain — meaningful room to come down on a strong offer.
Risks & watch-outs
- Watch-outs: built in 1920 — expect roof / HVAC / electrical / plumbing capex.
Questions for the listing agent
- What do current leases actually rent for vs. the listed asking? Can we see a recent rent roll and the last 12 months of T-12 income?
- It's been on market 42 days. Have you received any prior offers? Is the seller open to a 49% concession, seller financing, or rate buy-down credit?
- Built in 1920 — when were the roof, HVAC, electrical panel, plumbing, and water heater last replaced?
- Is there a deadline driving the sale (1031 exchange, divorce, estate, relocation)? That informs how much negotiation room exists.
- Crime grade is F in this area — have there been break-ins, vandalism, or insurance claims at this property in the last 3 years? What carrier currently insures it and at what premium?
- The area grade is low — what's the realistic commute time and amenity access for the typical tenant pool here? Any planned neighborhood developments (good or bad) we should know about?
- What's the average days-on-market for RENTAL listings here right now (not sales)? A rising rental-DOM trend means longer vacancies and softer asking-rent achievability than the comps imply.
- What's the recent tenant-quality profile in this submarket — average credit score on applications, eviction rate, late-payment / NSF rate, and stable-employment percentage? A property-management company in the area should have these aggregated.
- How much new for-sale + rental construction is in the pipeline within 1–3 miles? Heavy new supply typically softens prices + rents 12–24 months out; constrained supply supports both.
Investment metrics
- 1% rule
- 0.51% ✗
- Cap rate
- 3.72%
- Cash-on-cash
- -9.20%
- DSCR
- 0.59
- GRM
- 16.4
CMA / ARV
- ARV (median comp)
- $311,350
- List price
- $235,000
- Delta
- -24.52%
- Verdict
- UNDERPRICED
- Comps
- 20 within 1.0 mi
Show comp detail 12 sales within ~0.75 mi
| Address | Dist | Beds/Ba | Sqft | Sold | Price | $/sf | Match |
|---|---|---|---|---|---|---|---|
| 603 S 15th Ave | 0.40mi | 2/1.0 | 1,024 (-10%) | 1mo | $275,000 | $269 | 63 |
| 611 1/2 S 15th Ave | 0.44mi | 2/1.0 | 1,024 (-10%) | 1mo | $242,350 | $237 | 62 |
| 1302 Mckinley Ave | 0.53mi | 2/1.0 | 1,217 (+7%) | 3mo | $240,000 | $197 | 61 |
| 213 N 23rd Ave | 0.56mi | 2/2.0 | 1,168 (+2%) | 9mo | $320,000 | $274 | 58 |
| 705 S 8th Ave | 0.75mi | 2/1.0 | 1,137 (-0%) | 9mo | $306,000 | $269 | 57 |
| 701 Queen Ave | 0.56mi | 2/1.0 | 1,028 (-10%) | 0mo | $315,000 | $306 | 57 |
| 605 S 16th Ave | 0.43mi | 2/1.0 | 1,292 (+13%) | 2mo | $235,000 | $182 | 56 |
| 1417 Jefferson Ave | 0.34mi | 3/1.0 (+1) | 1,272 (+12%) | 5mo | $257,000 | $202 | 56 |
| 614 S 13th Ave | 0.45mi | 3/1.0 (+1) | 1,275 (+12%) | 0mo | $291,000 | $228 | 54 |
| 807 S 11th Ave | 0.69mi | 3/1.0 (+1) | 1,192 (+5%) | 8mo | $235,000 | $197 | 48 |
| 520 Clark Ave | 0.61mi | 3/1.0 (+1) | 1,010 (-11%) | 3mo | $275,000 | $272 | 45 |
| 1204 Cherry Ave | 0.68mi | 1/2.0 (-1) | 1,248 (+10%) | 6mo | $90,000 | $72 | 38 |
Match score weights: distance 35% · size 25% · config 20% · recency 20%. Top-matched comps best support the ARV.
Projected returns pro-forma
-3.0% appreciation · 5.07% rent growth · sell at horizon
- IRR
- -30.8%
- Equity multiple
- -0.03×
- Total profit
- $-67,750
- Equity at exit
- $35,039
- IRR
- -26.7%
- Equity multiple
- -0.37×
- Total profit
- $-89,868
- Equity at exit
- $20,319
Cash invested: $65,800 (down + closing). Projections, not guarantees.
Landlord ↔ Tenant lean methodology
- Overall (STATE)
- 28 Tenant-Leaning
- State Washington
- 28 Tenant-Leaning · D+8
- County
- — inherits STATE
- City
- — inherits STATE
ZIP-level market 98902
- Rents YoY
- 5.1%
- Active inventory
- 185
- Price-to-rent
- 16.4×
Monthly cashflow live
- Estimated rent
- $1,192 high interval (Pro) →
- Mortgage (P&I)
- −$1,232
- Tax from tax record
- −$116 /mo · $1,388/yr
- Insurance
- −$98
- HOA
- −$0
- Vacancy / Maint / Mgmt
- −$250
- Net cashflow
- $-504
Break-even live
UW: 25.0% down · 7.5% · 30yr · 1.5% tax · 5.0% vac · 8.0% maint · 8.0% mgmt
Financing live
Cash to close
- Down payment
- $58,750
- Closing costs
- $7,050
- Reserves months
- —
- Total cash needed
- —
Loan-product check · same deal, 3 products live
Conventional
25% down · 7.5% · 30yr
- Down + closing
- —
- Monthly P&I
- —
- Monthly cashflow
- —
- DSCR
- —
- Eligible?
- —
Personal DTI + credit; lowest rate.
DSCR
20% down · 8.5% · 30yr
- Down + closing
- —
- Monthly P&I
- —
- Monthly cashflow
- —
- DSCR
- —
- Eligible?
- —
No personal income docs; deal must DSCR.
Hard money
10% down · 12.0% · 12mo
- Down + closing
- —
- Monthly P&I
- —
- Monthly cashflow
- —
- DSCR
- —
- Eligible?
- —
Short-term bridge; refi at stabilization.
Rent comps 22 comps
| Address | Beds | Baths | Sqft | Rent | $/sqft | DOM | Units | Dist |
|---|---|---|---|---|---|---|---|---|
| 1415 W Yakima Ave Unit O Yakima, WA | 2.0 | 1.5 | 1080 | $1,250 | $1.16 | 43d | 1 | 0.04mi |
| 1409 Folsom Ave Unit 5 Yakima, WA | 2.0 | 1.0 | 750 | $900 | $1.20 | 21d | 1 | 0.28mi |
| 13 S 9th Ave Unit 5 Yakima, WA | 2.0 | 1.0 | 750 | $1,175 | $1.57 | 21d | 1 | 0.35mi |
| 1103 Browne Ave Unit 2 Yakima, WA | 2.0 | 1.5 | 972 | $1,150 | $1.18 | 21d | 1 | 0.42mi |
| 1103 Browne Ave Apt 1 Yakima, WA | 2.0 | 1.5 | 972 | $1,250 | $1.29 | 21d | 1 | 0.42mi |
| 1112 Jefferson Ave Yakima, WA | 2.0 | 1.0 | 814 | $1,095 | $1.35 | 21d | 1 | 0.45mi |
| 1303 Garfield Ave Unit 04 Yakima, WA | 2.0 | 1.0 | 784 | $925 | $1.18 | 43d | 1 | 0.49mi |
| 211 N Pierce Ave Yakima, WA | 2.0 | 1.0 | 750 | $1,150 | $1.53 | 43d | 1 | 0.52mi |
| 1403 Roosevelt Ave Unit D Yakima, WA | 2.0 | 1.0 | 768 | $875 | $1.14 | 21d | 1 | 0.59mi |
| 708 S 20th Ave Yakima, WA | 2.0 | 1.0 | 885 | $1,100 | $1.24 | 43d | 1 | 0.65mi |
| 1318 Fairbanks Ave Unit 2 Yakima, WA | 2.0 | 1.0 | 750 | $895 | $1.19 | 43d | 1 | 0.69mi |
| 1318 Fairbanks Ave Unit 03 Yakima, WA | 2.0 | 1.0 | 750 | $975 | $1.30 | 43d | 1 | 0.69mi |
| 401 N 5th Ave Unit 2 Yakima, WA | 3.0 | 1.0 | 866 | $1,125 | $1.30 | 43d | 1 | 0.70mi |
| 1509 Swan Ave Yakima, WA | 3.0 | 2.0 | 1108 | $1,400 | $1.26 | 43d | 1 | 0.80mi |
| 2605 W Lincoln Ave Yakima, WA | 3.0 | 1.0 | 990 | $1,600 | $1.62 | 43d | 1 | 0.88mi |
| 1117 Willow St Unit A Yakima, WA | 2.0 | 1.0 | 719 | $975 | $1.36 | 43d | 1 | 0.95mi |
| 1117 S 22nd Ave Yakima, WA | 2.0 | 1.0 | 775 | $1,300 | $1.68 | 13d | 1 | 1.07mi |
| 5200 Jazz ST Yakima, WA | 2.0–3.0 | 2.5 | 1484 | $1,850 | $1.25 | 13d | 2 | 1.08mi |
| 808 S 2nd Ave Unit A Yakima, WA | 3.0 | 2.0 | 1133 | $1,495 | $1.32 | 43d | 1 | 1.11mi |
| 1900 W Mead Ave #1 Yakima, WA | 3.0 | 2.0 | 1350 | $2,050 | $1.52 | 21d | 1 | 1.43mi |
| 1912 W Mead Ave #1 Yakima, WA | 3.0 | 2.0 | 1204 | $1,795 | $1.49 | 21d | 1 | 1.44mi |
| 1418 Cornell Ave Yakima, WA | 3.0 | 1.0 | 1000 | $1,800 | $1.80 | 43d | 1 | 1.49mi |
Listing history 24 events
-
2026-06-19days on market $235,000 Active 42 DOM
-
2026-06-18days on market $235,000 Active 41 DOM
-
2026-06-17days on market $235,000 Active 40 DOM
-
2026-06-16days on market $235,000 Active 39 DOM
-
2026-06-15days on market $235,000 Active 38 DOM
-
2026-06-14days on market $235,000 Active 36 DOM
-
2026-06-13pricedays on market $235,000 Active 35 DOM
-
2026-06-10days on market $249,000 Active 33 DOM
-
2026-06-09days on market $249,000 Active 32 DOM
-
2026-06-08days on market $249,000 Active 31 DOM
-
2026-06-07days on market $249,000 Active 30 DOM
-
2026-06-05days on market $249,000 Active 27 DOM
-
2026-06-03days on market $249,000 Active 26 DOM
-
2026-06-02days on market $249,000 Active 25 DOM
-
2026-06-01days on market $249,000 Active 24 DOM
-
2026-05-31days on market $249,000 Active 23 DOM
-
2026-05-30days on market $249,000 Active 22 DOM
-
2026-05-08$249,000 Active 659-char remark
-
2022-04-12soldstatus $145,000 703-char remark
Show marketing remark (703 chars)
Large 2 bedroom 1 bath home with additional nonconforming room in the basement that has been used as a sleeping area. New Carpets and a large basement. formal dining area, fireplace. The air conditioning unit does not work so window air conditioners have been used to cool the home. according to the past owner one of the spaces in the joint garage belongs to the house. the one closest to the house. buyer is to verify this. street parking on 15th ave and more space on the cross street Belmont AveThe owner is a licensed real estate broker in Washington State and the data for the listing was obtained from the county data online, The buyer shall verify all the data to their liking before purchasing
-
2022-01-04$140,000 703-char remark
Show marketing remark (703 chars)
Large 2 bedroom 1 bath home with additional nonconforming room in the basement that has been used as a sleeping area. New Carpets and a large basement. formal dining area, fireplace. The air conditioning unit does not work so window air conditioners have been used to cool the home. according to the past owner one of the spaces in the joint garage belongs to the house. the one closest to the house. buyer is to verify this. street parking on 15th ave and more space on the cross street Belmont AveThe owner is a licensed real estate broker in Washington State and the data for the listing was obtained from the county data online, The buyer shall verify all the data to their liking before purchasing
-
2021-07-15$129,000
-
2013-10-21soldstatus $53,000
-
2010-03-19soldstatus $74,000
-
2008-12-31soldstatus $55,000
ⓘ Source: listings_history table (triggers on properties + properties_extension) + one-shot
backfill from property_details.listing_events for pre-trigger history.
Tax reassessment forecast WA · Resets to sale price
- Current annual tax
- $1,388 · $116/mo
- Projected year-2 tax
- $2,303 · $192/mo
- Expected delta
- +$915/yr (+$76/mo · 65.9%)
ⓘ Screening estimate from a state-policy table — verify with the county assessor before closing.
Climate risk First Street
- Flood 1/10 Low FEMA zone X (unshaded) · 0% chance over 30 yrs
- Wildfire 1/10 Low
- Heat 4/10 Moderate 7 d/yr ≥97°F today · 14 d/yr by 30 yrs out
- Wind 1/10 Low
- Air quality 9/10 Extreme 16 unhealthy d/yr today · 19 by 30 yrs out
Nearby sold comps map
Loading sold comps map…
Walkable amenities ~0.75 mi
Loading nearby amenities…
Taxation est. · year 1
- Rental income
- $14,306
- − Mortgage interest
- −$13,164
- − Property taxes
- −$1,388
- − Insurance
- −$1,175
- − Repairs & maintenance
- −$1,144
- − Management
- −$1,144
- − Depreciation
- −$6,836
- Taxable loss
- −$10,547
- Est. tax savings @ 24.0%
- +$2,531
- After-tax cash flow
- $-3,519/yr
For passive investors: Depreciation is non-cash, so a rental often shows a tax loss while cash-flowing — sheltering income. Rental losses are passive: they offset passive income freely, and up to $25,000/yr can offset ordinary (W-2) income if you actively participate and your MAGI is under $100k (phasing out to $0 by $150k); unused losses carry forward. On sale, claimed depreciation is recaptured at up to 25%, and gains may owe capital-gains tax (a 1031 exchange can defer both). Figures are a year-1 estimate at your 24.0% rate — not tax advice; consult a CPA.
Schools (NCES district)
- District
- Yakima School District
- NCES district ID
- 5310110
- Math proficiency
- 34% ▼ -1.00%
- Reading proficiency
- 42% ▬ 0.00%
- Median HH income
- $36,538
- Composite
- 34.04/100
- National rank
- #10305
- State rank
- #238 of 291 in WA
Livability — Yakima
- Score
- 80/100
- State rank
- #98
- US rank
- #1912
Category grades
Schools grade is shown separately in the Schools card above.
Census & demographics
- Census place
- Yakima, WA
- County
- Yakima County · 134,789 people
- City population
- 115,918
- Metro
- Yakima, WA
- Population (ZIP)
- 46,492
- Household income
- $63,092
- Rent vs Own
- Severe rent burden
- 1607.0
Population outlook (Yakima County) Hauer SSP2
- Today (2025)
- 256,514 people
- By 2030
- 259,403 · +1.1%
- By 2040
- 265,677 · +3.6%
- By 2050
- 273,061 · +6.5%
- By 2075
- 296,991 · +15.8%
- By 2100
- 315,291 · +22.9%
Race, ethnicity, and origin ACS 2023
- Neighborhood character
- Diverse neighborhood (Simpson 0.59)
- Race & ethnicity
- Hispanic / Latino 50% White 40% Two or more races 24% Black 2% Pacific Islander 2% Native American 1% Asian 1%
- Hispanic origin (detail)
- Mexican 44%
- Common ancestry
- Lithuanian 2% Slovak 1% Italian 1%
- Foreign-born
- 20% · Canada
- Languages at home
- 60% English-only · Spanish 37% Other Asian/Pacific 1%
Political lean MEDSL · Yakima
- 2024 margin
- R (+14.3) · D 41.6% · R 55.9% · Other 2.5%
- 2008→2024 swing
- -3.8pp toward R · 2008: -10.6pp · 2024: -14.3pp
- All cycles
- 2024: R+14.3 2020: R+7.7 2016: R+15.4 2012: R+15.1 2008: R+10.6
Not yet ingested
- Civics
- —
Market trends
- HPI YoY
- ▼ -363.66%
- Current HPI
- 294.559
- Rent YoY
- ▲ 5.07%
- Metro
- Yakima, WA
- State GDP YoY
- ▲ 4.65%
- F500 in state
- 22
Industry mix (Fortune 500 HQ in WA)
| Industry | F500 HQs | Revenue |
|---|---|---|
| Retail | 2 | $269B |
|
||
| Technology / Retail | 1 | $638B |
|
||
| Technology | 1 | $245B |
|
||
| Telecommunications | 1 | $38B |
|
||
| Food / Beverage | 1 | $36B |
|
||
| Automotive / Trucks | 1 | $34B |
|
||
Price history
+327.3% since first listed8 events — show timeline
- 2026-06-11 Price Changed $235,000 YAMLS
- 2026-05-08 Listed $249,000 YAMLS
- 2022-04-12 Sold (MLS) $145,000 YAMLS
- 2022-01-04 Listed $140,000 YAMLS
- 2021-07-15 Listed $129,000 YAMLS
- 2013-10-21 Sold (Public Records) $53,000 Public Records
- 2010-03-19 Sold (Public Records) $74,000 Public Records
- 2008-12-31 Sold (Public Records) $55,000 Public Records
Property tax history
+4.1%/yrLatest (2026): $1,388 · -17.7% YoY. Source: county tax records.
Cash-flow waterfall
monthlySold comps — $/sqft
last 12 mo · ≤1 miLoading sold comps…