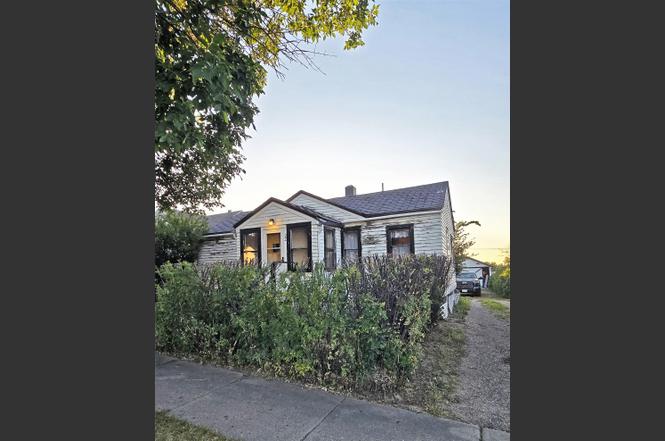
22 7th Ave SE · Cut Bank, MT
Flood risk 1/10 · Minimal
- FEMA flood zone
- —
- Chance of flooding over 30 yrs
- 0.0%
- Est. flood insurance / yr
- —
Fire risk 6/10 · Moderate
- Est. fire insurance / yr
- $918 – $1,706
Heat risk 1/10 · Minimal
- Hot days now (above 88°F)
- 5 days/yr
- Hot days in 30 yrs
- 9 days/yr
Wind risk 1/10 · Minimal
- Chance of severe wind over 30 yrs
- —
Air-quality risk 6/10 · Moderate
- Unhealthy air days now
- 12 days/yr
- Unhealthy air days in 30 yrs
- 12 days/yr
Risk factors via First Street. Map © Google.
Why this score? — see what drove the B- grade
The composite is a weighted blend of 9 inputs, each scored 0–100. Each bar is that input's sub-score; the figure is the points it added to the 100-point composite (weight × sub-score).
- Cash flow +30.0/30.0
- 1% rule +10.0/10.0
- DSCR +10.0/10.0
- ARV discount +7.5/15.0
- Livability +3.5/5.0
- Rent growth +2.5/5.0
- Condition / age +2.5/5.0
- Schools +1.7/10.0
- Appreciation +0.0/10.0
$64,000
🖨 Deal sheet 📄 Offer letter ✓ Due diligence
Key facts
- Close to local shops
- Detached garage
- 7,013 sq ft lot
Tags
Property features AI
Finance
- Other:
- Financial info:
- HOA & community:
Exterior
- Parking: 2-car garage
- Security:
- Utilities: Public water; Public sewer; Electricity connected; Natural gas available and connected
- Home design: Single-family residence; One level
- Construction: Wood siding; Asphalt roof; Built on concrete foundation
- Exterior features: Rain gutters; Front porch; Rear porch; Back yard fencing; Level lot; Curbs, street lights, sidewalks
Interior
- Kitchen: Range; Refrigerator
- Bedrooms:
- Flooring:
- Bathrooms: 1 full bathroom
- Heating & cooling: Natural gas forced-air heating
- Interior features: High speed internet; Partially finished concrete basement with walk-up access
- Laundry & utility: Washer; Dryer; Washer hookup
Neighborhood map
What this means for you Summary
Snapshot
- This is a 4-bed/1.0-bath single-family listed at $64k.
Deal economics
- At list price, monthly cash flow is $630 ($8k/yr) — positive.
- The deal already cash-flows at list — no discount required.
- Meets the 1% rule at list price ($1k rent vs $64k).
- Recommended offer: $56k (12.0% below list) — sets the bar for market timing.
- Cap rate 18.1% vs local median 5.0% in Cut Bank — top-decile yield for the area; either an underpriced asset or a hidden risk that comps aren't pricing in. Stress-test before assuming the spread holds.
Location & tenants
- Location reads 70/100 on livability (#81 in MT) — a middle-class / working-renter tenant base. Strengths: cost of living A+, health & safety A+, housing B; Watch: schools C-, commute C-, employment D+.
- Cut Bank H S (town): math 11% / reading 20% proficiency, ranked #268 of 339 in MT (top 79%) — low school quality limits family demand, transient renter base, plan for 1-2y turnover.
- Market conditions: 35 active listings in the ZIP.
Forward outlook
- Local home prices are declining (-3.0%/yr); year-one equity from $442 of loan paydown is wiped out by about $2k of value loss. Plan a longer hold.
- At projected returns (-3.0% appreciation + 3.0% rent growth), your $18k cash investment doubles in ~3 years — after that, you're playing with house money.
Negotiation context
- It's been on market 273 days — a 12% lower offer ($56k) is reasonable based on typical stale-listing flexibility.
Risks & watch-outs
- Watch-outs: built in 1930 — expect roof / HVAC / electrical / plumbing capex.
- Climate carrying-cost: major wildfire risk — expect insurance premiums to compound above CPI over the hold.
Questions for the listing agent
- It's been on market 273 days. Have you received any prior offers? Is the seller open to a 12% concession, seller financing, or rate buy-down credit?
- Built in 1930 — when were the roof, HVAC, electrical panel, plumbing, and water heater last replaced?
- Why hasn't it sold? Are there any deal-killer items the seller is aware of (foundation, flood, title, zoning, code violations)?
- Is there a deadline driving the sale (1031 exchange, divorce, estate, relocation)? That informs how much negotiation room exists.
- Crime grade is F in this area — have there been break-ins, vandalism, or insurance claims at this property in the last 3 years? What carrier currently insures it and at what premium?
- What's the average days-on-market for RENTAL listings here right now (not sales)? A rising rental-DOM trend means longer vacancies and softer asking-rent achievability than the comps imply.
- What's the recent tenant-quality profile in this submarket — average credit score on applications, eviction rate, late-payment / NSF rate, and stable-employment percentage? A property-management company in the area should have these aggregated.
- How much new for-sale + rental construction is in the pipeline within 1–3 miles? Heavy new supply typically softens prices + rents 12–24 months out; constrained supply supports both.
Investment metrics
- 1% rule
- 2.21% ✓
- Cap rate
- 18.11%
- Cash-on-cash
- 42.21%
- DSCR
- 2.88
- GRM
- 3.8
CMA / ARV
- ARV (on-the-fly)
- $167,272
- Comps found
- 12
Show comp detail 12 sales within ~0.75 mi
| Address | Dist | Beds/Ba | Sqft | Sold | Price | $/sf | Match |
|---|---|---|---|---|---|---|---|
| 113 8th Ave SE | 0.12mi | 4/2.0 | 1,650 (+2%) | 19mo | $235,000 | $142 | 72 |
| 306 E Main St | 0.24mi | 3/2.0 (-1) | 1,600 (-2%) | 9mo | $164,999 | $103 | 70 |
| 234 3rd Ave SE | 0.37mi | 3/2.0 (-1) | 1,610 (-1%) | 11mo | $150,000 | $93 | 63 |
| 220 1st St SW | 0.65mi | 3/1.0 (-1) | 1,576 (-3%) | 3mo | $125,000 | $79 | 57 |
| 310 3rd Ave SE | 0.40mi | 3/1.0 (-1) | 1,490 (-8%) | 8mo | $128,000 | $86 | 56 |
| 338 5th Ave SE | 0.38mi | 3/3.0 (-1) | 1,736 (+7%) | 5mo | $250,000 | $144 | 54 |
| 122 3rd Ave NW | 0.73mi | 4/2.0 | 1,607 (-1%) | 11mo | $126,000 | $78 | 50 |
| 305 1st St NW | 0.73mi | 4/1.0 | 1,584 (-2%) | 14mo | $120,000 | $76 | 50 |
| 214 2nd Ave SW | 0.65mi | 3/2.0 (-1) | 1,596 (-2%) | 10mo | $115,000 | $72 | 49 |
| 313 1st Ave SW | 0.60mi | 3/1.0 (-1) | 1,436 (-12%) | 0mo | $165,000 | $115 | 48 |
| 305 14th Ave S | 0.31mi | 3/2.0 (-1) | 1,764 (+9%) | 19mo | $265,000 | $150 | 46 |
| 122 2nd Ave SW | 0.63mi | 3/2.0 (-1) | 1,768 (+9%) | 19mo | $205,000 | $116 | 31 |
Match score weights: distance 35% · size 25% · config 20% · recency 20%. Top-matched comps best support the ARV.
Projected returns pro-forma
-3.0% appreciation · 3.0% rent growth · sell at horizon
- IRR
- 38.9%
- Equity multiple
- 2.66×
- Total profit
- $29,826
- Equity at exit
- $9,543
- IRR
- 45.4%
- Equity multiple
- 5.35×
- Total profit
- $77,863
- Equity at exit
- $5,534
Cash invested: $17,920 (down + closing). Projections, not guarantees.
Landlord ↔ Tenant lean methodology
- Overall (STATE)
- 82 Strongly Landlord-Friendly
- State Montana
- 82 Strongly Landlord-Friendly · R+11
- County
- — inherits STATE
- City
- — inherits STATE
ZIP-level market 59427
- Home prices YoY
- -35.0%
- Active inventory
- 35
- Price-to-rent
- 3.8×
Monthly cashflow live
- Estimated rent
- $1,412 medium interval (Pro) →
- Mortgage (P&I)
- −$336
- Tax from tax record
- −$123 /mo · $1,472/yr
- Insurance
- −$27
- HOA
- −$0
- Vacancy / Maint / Mgmt
- −$296
- Net cashflow
- $630
Break-even live
UW: 25.0% down · 7.5% · 30yr · 1.5% tax · 5.0% vac · 8.0% maint · 8.0% mgmt
Financing live
Cash to close
- Down payment
- $16,000
- Closing costs
- $1,920
- Reserves months
- —
- Total cash needed
- —
Loan-product check · same deal, 3 products live
Conventional
25% down · 7.5% · 30yr
- Down + closing
- —
- Monthly P&I
- —
- Monthly cashflow
- —
- DSCR
- —
- Eligible?
- —
Personal DTI + credit; lowest rate.
DSCR
20% down · 8.5% · 30yr
- Down + closing
- —
- Monthly P&I
- —
- Monthly cashflow
- —
- DSCR
- —
- Eligible?
- —
No personal income docs; deal must DSCR.
Hard money
10% down · 12.0% · 12mo
- Down + closing
- —
- Monthly P&I
- —
- Monthly cashflow
- —
- DSCR
- —
- Eligible?
- —
Short-term bridge; refi at stabilization.
Listing history 21 events
-
2026-06-18days on market $64,000 Active 273 DOM
-
2026-06-17days on market $64,000 Active 272 DOM
-
2026-06-16days on market $64,000 Active 271 DOM
-
2026-06-15days on market $64,000 Active 270 DOM
-
2026-06-13days on market $64,000 Active 268 DOM
-
2026-06-12days on market $64,000 Active 267 DOM
-
2026-06-09days on market $64,000 Active 264 DOM
-
2026-06-08days on market $64,000 Active 263 DOM
-
2026-06-07days on market $64,000 Active 262 DOM
-
2026-06-05days on market $64,000 Active 260 DOM
-
2026-06-04days on market $64,000 Active 258 DOM
-
2026-06-02days on market $64,000 Active 257 DOM
-
2026-06-01days on market $64,000 Active 256 DOM
-
2026-05-31days on market $64,000 Active 255 DOM
-
2026-05-13price $64,000
-
2025-11-11price $69,000
-
2025-10-13price $79,000
-
2025-09-16$90,000 Active
-
2010-08-04soldstatus
-
2006-11-15soldstatus
-
1997-02-19soldstatus
ⓘ Source: listings_history table (triggers on properties + properties_extension) + one-shot
backfill from property_details.listing_events for pre-trigger history.
Tax reassessment forecast MT · Resets to sale price
- Current annual tax
- $1,472 · $123/mo
- Projected year-2 tax
- $1,472 · $123/mo
- Expected delta
- $0/yr ($0/mo · 0.0%)
ⓘ Screening estimate from a state-policy table — verify with the county assessor before closing.
Climate risk First Street
- Flood 1/10 Low 0% chance over 30 yrs
- Wildfire 6/10 Major
- Heat 1/10 Low 5 d/yr ≥88°F today · 9 d/yr by 30 yrs out
- Wind 1/10 Low
- Air quality 6/10 Major 12 unhealthy d/yr today · 12 by 30 yrs out
Nearby sold comps map
Loading sold comps map…
Walkable amenities ~0.75 mi
Loading nearby amenities…
Taxation est. · year 1
- Rental income
- $16,942
- − Mortgage interest
- −$3,585
- − Property taxes
- −$1,472
- − Insurance
- −$320
- − Repairs & maintenance
- −$1,355
- − Management
- −$1,355
- − Depreciation
- −$1,862
- Taxable income
- $6,992
- Est. tax owed @ 24.0%
- −$1,678
- After-tax cash flow
- $5,886/yr
For passive investors: Depreciation is non-cash, so a rental often shows a tax loss while cash-flowing — sheltering income. Rental losses are passive: they offset passive income freely, and up to $25,000/yr can offset ordinary (W-2) income if you actively participate and your MAGI is under $100k (phasing out to $0 by $150k); unused losses carry forward. On sale, claimed depreciation is recaptured at up to 25%, and gains may owe capital-gains tax (a 1031 exchange can defer both). Figures are a year-1 estimate at your 24.0% rate — not tax advice; consult a CPA.
Schools (NCES district)
- District
- Cut Bank H S
- NCES district ID
- 3008190
- Math proficiency
- 11% ▼ -19.00%
- Reading proficiency
- 20% ▼ -10.00%
- Median HH income
- $41,470
- Composite
- 16.78/100
- National rank
- #14223
- State rank
- #268 of 339 in MT
Livability — Cut Bank
- Score
- 70/100
- State rank
- #81
- US rank
- #8053
Category grades
Schools grade is shown separately in the Schools card above.
Census & demographics
- Census place
- Cut Bank, MT
- Population (ZIP)
- 4,955
Population outlook (Glacier County) Hauer SSP2
- Today (2025)
- 13,805 people
- By 2030
- 13,789 · -0.1%
- By 2040
- 13,635 · -1.2%
- By 2050
- 13,417 · -2.8%
- By 2075
- 13,107 · -5.1%
- By 2100
- 12,567 · -9.0%
Race, ethnicity, and origin ACS 2023
- Neighborhood character
- Diverse neighborhood (Simpson 0.57)
- Race & ethnicity
- White 65% Native American 23% Two or more races 7% Hispanic / Latino 4%
- Common ancestry
- Portuguese 10% Serbian 2% Scotch-Irish 2%
- Foreign-born
- 1% · Canada
- Languages at home
- 88% English-only · German/W. Germanic 7% Spanish 1% French/Haitian/Cajun 1%
Political lean MEDSL · Glacier
- 2024 margin
- D (+19.6) · D 57.8% · R 38.2% · Other 4.1%
- 2008→2024 swing
- -20.1pp toward R · 2008: 39.7pp · 2024: 19.6pp
- All cycles
- 2024: D+19.6 2020: D+30.6 2016: D+29.7 2012: D+32.5 2008: D+39.7
Not yet ingested
- Civics
- —
Market trends
- HPI YoY
- ▼ -87.39%
- Current HPI
- 162.3013
- Rent YoY
- —
- Metro
- —
- State GDP YoY
- ▲ 3.41%
- F500 in state
- 2
Industry mix (Fortune 500 HQ in MT)
| Industry | F500 HQs | Revenue |
|---|---|---|
| Technology / Analytics | 1 | $2B |
|
||
Price history
-28.9% since first listed7 events — show timeline
- 2026-05-13 Price Changed $64,000 MRMLS
- 2025-11-11 Price Changed $69,000 MRMLS
- 2025-10-13 Price Changed $79,000 MRMLS
- 2025-09-16 Listed $90,000 MRMLS
- 2010-08-04 Sold (Public Records) — Public Records
- 2006-11-15 Sold (Public Records) — Public Records
- 1997-02-19 Sold (Public Records) — Public Records
Property tax history
+6.4%/yrLatest (2024): $1,472 · +0.6% YoY. Source: county tax records.
Cash-flow waterfall
monthlySold comps — $/sqft
last 12 mo · ≤1 miLoading sold comps…