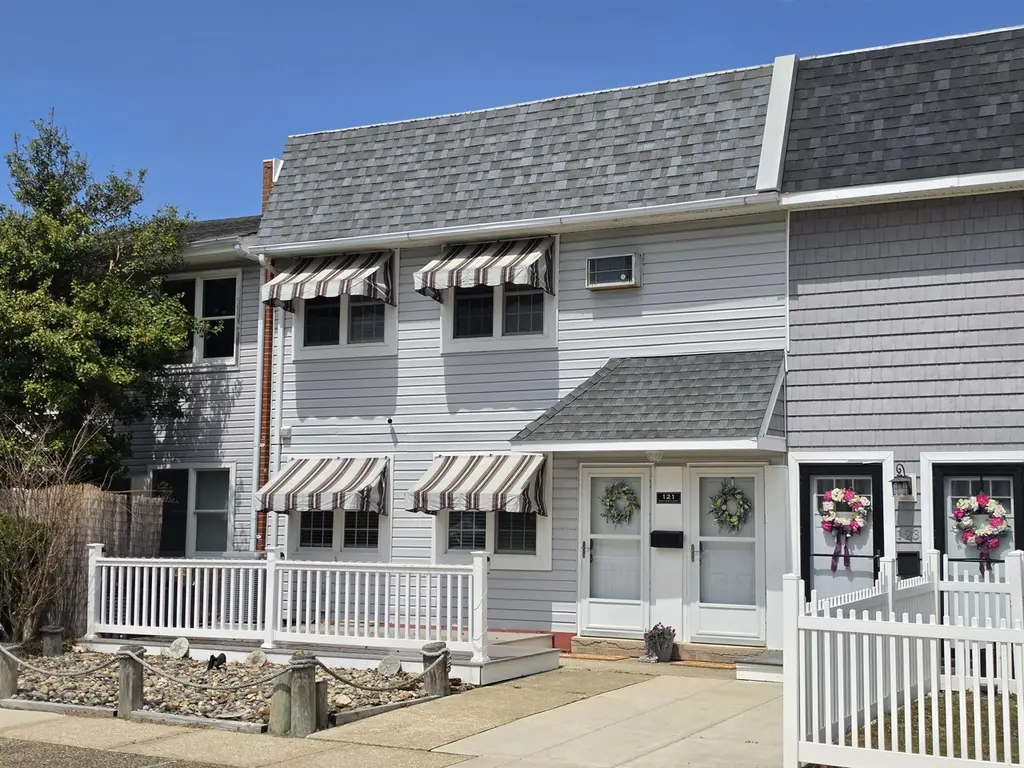
121 Seaview Ct · North Wildwood, NJ
Flood risk 8/10 · Major
- FEMA flood zone
- AE
- Chance of flooding over 30 yrs
- 0.97%
- Est. flood insurance / yr
- $1,737 – $8,500
Fire risk 1/10 · Minimal
- Est. fire insurance / yr
- $526 – $976
Heat risk 7/10 · Major
- Hot days now (above 95°F)
- 7 days/yr
- Hot days in 30 yrs
- 17 days/yr
Wind risk 8/10 · Major
- Chance of severe wind over 30 yrs
- 80.0%
Air-quality risk 2/10 · Minimal
- Unhealthy air days now
- 1 days/yr
- Unhealthy air days in 30 yrs
- 1 days/yr
Risk factors via First Street. Map © Google.
Why this score? — see what drove the C+ grade
The composite is a weighted blend of 9 inputs, each scored 0–100. Each bar is that input's sub-score; the figure is the points it added to the 100-point composite (weight × sub-score).
- Cash flow +25.1/30.0
- ARV discount +9.9/15.0
- DSCR +8.2/10.0
- 1% rule +5.5/10.0
- Schools +4.4/10.0
- Livability +3.4/5.0
- Rent growth +2.5/5.0
- Condition / age +2.5/5.0
- Appreciation +0.0/10.0
$945,000
🖨 Deal sheet 📄 Offer letter ✓ Due diligence
Listing remarks
* * * OPEN HOUSE Saturday, May 2nd, 12 pm - 2pm * * * Welcome to 121 Seaview Court in the highly sought-after Anglesea section of North Wildwood—a rare and exciting opportunity to own a versatile duplex just steps from the scenic inlet and surrounded by the peaceful charm of this coastal neighborhood. Own two homes for the price of one and unlock endless possibilities! Whether you're looking to live in one unit while generating rental income from the other, maximize returns by renting both, or create the perfect shore retreat for family and friends—this property delivers flexibility, value, and strong income potential. Investors will also appreciate the option to convert
Key facts
- Wi-fi thermostat
- Versatile duplex
- Private front deck
Tags
Property features AI
Exterior
- Utilities: City water; City sewer; Electric separate meters
- Home design: Offered for sale; Suitable for condo conversion
- Exterior features: Patio; Deck; Enclosed/covered patio; Fenced yard; Storage building; Sidewalks; Waterview; Cable TV available
Interior
- Kitchen: Eat-in kitchen; Pantry
- Bedrooms: Unit 1: 2 bedrooms; Unit 2: 3 bedrooms
- Bathrooms: Unit 1: 2 bathrooms; Unit 2: 2 bathrooms
- Heating & cooling: Electric heating; Baseboard heating; Heat pump; Central AC; Ceiling fans; Multi-zone cooling; Wall AC units
- Interior features: Shades and blinds; Furnished; Living room; Dining area; Eat-in kitchen; Kitchen pantry; Storage space; Crawl space basement with inside entrance
- Laundry & utility: Electric hot water
Neighborhood map
What this means for you Summary
Snapshot
- This is a 4-bed/4.0-bath single-family listed at $945k.
Deal economics
- At list price, monthly cash flow is $2k ($20k/yr) — positive.
- The deal already cash-flows at list — no discount required.
- Meets the 1% rule at list price ($10k rent vs $945k).
- Recommended offer: $917k (3.0% below list) — sets the bar for market timing.
- Cap rate 8.9% vs local median 3.6% in North Wildwood — top-decile yield for the area; either an underpriced asset or a hidden risk that comps aren't pricing in. Stress-test before assuming the spread holds.
Location & tenants
- Location reads 68/100 on livability (#318 in NJ) — a middle-class / working-renter tenant base. Strengths: health & safety A+; Watch: amenities C-, crime D-, commute F.
- North Wildwood School District (suburban): math 55% / reading 45% proficiency, ranked #396 of 612 in NJ (top 65%) — acceptable for families but not a draw, mixed tenant base, ~2y average lease.
- Market conditions: 431 active listings in the ZIP; 1 comparable units currently listed for rent nearby; 877 units permitted in Cape May County in 2024 (35 in 5+ unit buildings).
Forward outlook
- Local home prices are declining (-3.0%/yr); year-one equity from $7k of loan paydown is wiped out by about $28k of value loss. Plan a longer hold.
- Cape May County population projected at -24% by 2050 — secular population decline; favor cash flow + early exit over multi-decade hold.
Negotiation context
- It's been on market 57 days — a 3% lower offer ($917k) is reasonable based on typical stale-listing flexibility.
- Current owner paid $235k; list at $945k implies a 302% gain — meaningful room to come down on a strong offer.
Risks & watch-outs
- Watch-outs: flood insurance adds $427/mo.
- Climate carrying-cost: in FEMA flood zone AE (mandatory federal flood insurance); severe wind risk, 80% chance of damaging wind over 30y; extreme-heat days projected 7→17/yr by 2055 (HVAC capex compounding) — expect insurance premiums to compound above CPI over the hold.
Questions for the listing agent
- It's been on market 57 days. Have you received any prior offers? Is the seller open to a 3% concession, seller financing, or rate buy-down credit?
- Built in 1975 — when were the roof, HVAC, electrical panel, plumbing, and water heater last replaced?
- What's the actual annual flood-insurance premium (NFIP or private), and is the property in a SFHA with mandatory coverage?
- Is there a deadline driving the sale (1031 exchange, divorce, estate, relocation)? That informs how much negotiation room exists.
- Crime grade is D in this area — have there been break-ins, vandalism, or insurance claims at this property in the last 3 years? What carrier currently insures it and at what premium?
- What's the average days-on-market for RENTAL listings here right now (not sales)? A rising rental-DOM trend means longer vacancies and softer asking-rent achievability than the comps imply.
- What's the recent tenant-quality profile in this submarket — average credit score on applications, eviction rate, late-payment / NSF rate, and stable-employment percentage? A property-management company in the area should have these aggregated.
- How much new for-sale + rental construction is in the pipeline within 1–3 miles? Heavy new supply typically softens prices + rents 12–24 months out; constrained supply supports both.
Investment metrics
- 1% rule
- 1.05% ✓
- Cap rate
- 8.93%
- Cash-on-cash
- 9.42%
- DSCR
- 1.42
- GRM
- 8.0
CMA / ARV
- ARV (on-the-fly)
- $999,400
- Comps found
- 2
Show comp detail 2 sales within ~0.75 mi
| Address | Dist | Beds/Ba | Sqft | Sold | Price | $/sf | Match |
|---|---|---|---|---|---|---|---|
| 208 New York Ave | 0.67mi | 4/2.5 | 1,900 (0%) | 3mo | $999,000 | $526 | 60 |
| 129 W 3rd Ave | 0.70mi | 4/1.5 | 2,030 (+7%) | 14mo | $864,000 | $426 | 34 |
Match score weights: distance 35% · size 25% · config 20% · recency 20%. Top-matched comps best support the ARV.
Projected returns pro-forma
-3.0% appreciation · 3.0% rent growth · sell at horizon
- IRR
- -4.9%
- Equity multiple
- 0.82×
- Total profit
- $-48,032
- Equity at exit
- $140,903
- IRR
- 4.8%
- Equity multiple
- 1.35×
- Total profit
- $93,305
- Equity at exit
- $81,706
Cash invested: $264,600 (down + closing). Projections, not guarantees.
Landlord ↔ Tenant lean methodology
- Overall (STATE)
- 21 Tenant-Leaning
- State New Jersey
- 21 Tenant-Leaning · D+6
- County
- — inherits STATE
- City
- — inherits STATE
ZIP-level market 08260
- Home prices YoY
- -30.7%
- Active inventory
- 431
- Price-to-rent
- 8.0×
Monthly cashflow live
- Estimated rent
- $9,900 medium interval (Pro) →
- Mortgage (P&I)
- −$4,956
- Tax from tax record
- −$394 /mo · $4,725/yr
- Insurance
- −$394
- Flood insurance flood zone
- −$427 /mo · $5,118/yr
- HOA
- −$0
- Vacancy / Maint / Mgmt
- −$2,079
- Net cashflow
- $1,651
Break-even live
UW: 25.0% down · 7.5% · 30yr · 1.5% tax · 5.0% vac · 8.0% maint · 8.0% mgmt
Financing live
Cash to close
- Down payment
- $236,250
- Closing costs
- $28,350
- Reserves months
- —
- Total cash needed
- —
Loan-product check · same deal, 3 products live
Conventional
25% down · 7.5% · 30yr
- Down + closing
- —
- Monthly P&I
- —
- Monthly cashflow
- —
- DSCR
- —
- Eligible?
- —
Personal DTI + credit; lowest rate.
DSCR
20% down · 8.5% · 30yr
- Down + closing
- —
- Monthly P&I
- —
- Monthly cashflow
- —
- DSCR
- —
- Eligible?
- —
No personal income docs; deal must DSCR.
Hard money
10% down · 12.0% · 12mo
- Down + closing
- —
- Monthly P&I
- —
- Monthly cashflow
- —
- DSCR
- —
- Eligible?
- —
Short-term bridge; refi at stabilization.
Rent comps 1 comps
| Address | Beds | Baths | Sqft | Rent | $/sqft | DOM | Units | Dist |
|---|---|---|---|---|---|---|---|---|
| 96 Seaspray Ct Wildwood, NJ | 3.0 | 2.5 | 1650 | $9,900 | $6.00 | 43d | 1 | 0.08mi |
Listing history 17 events
-
2026-06-18days on market $945,000 Active 57 DOM
-
2026-06-17days on market $945,000 Active 56 DOM
-
2026-06-16days on market $945,000 Active 55 DOM
-
2026-06-15days on market $945,000 Active 54 DOM
-
2026-06-13days on market $945,000 Active 52 DOM
-
2026-06-12days on market $945,000 Active 51 DOM
-
2026-06-09days on market $945,000 Active 48 DOM
-
2026-06-08days on market $945,000 Active 47 DOM
-
2026-06-07days on market $945,000 Active 46 DOM
-
2026-06-07days on market $945,000 Active 45 DOM
-
2026-06-04days on market $945,000 Active 42 DOM
-
2026-06-02statusdays on market $945,000 Active 41 DOM
-
2026-06-01pricestatus $945,000 Price Change 40 DOM
-
2026-06-01days on market $995,000 Active 40 DOM
-
2026-05-31days on market $995,000 Active 39 DOM
-
2026-04-22$995,000 Active
-
2003-01-09soldstatus $235,000
ⓘ Source: listings_history table (triggers on properties + properties_extension) + one-shot
backfill from property_details.listing_events for pre-trigger history.
Tax reassessment forecast NJ · Partial reset (capped growth)
- Current annual tax
- $4,725 · $394/mo
- Projected year-2 tax
- $14,128 · $1,177/mo
- Expected delta
- +$9,403/yr (+$784/mo · 199.0%)
ⓘ Screening estimate from a state-policy table — verify with the county assessor before closing.
Climate risk First Street
- Flood 8/10 Severe FEMA zone AE · 97% chance over 30 yrs
- Wildfire 1/10 Low
- Heat 7/10 Severe 7 d/yr ≥95°F today · 17 d/yr by 30 yrs out
- Wind 8/10 Severe 80% chance of damaging wind over 30 yrs
- Air quality 2/10 Low 1 unhealthy d/yr today · 1 by 30 yrs out
Nearby sold comps map
Loading sold comps map…
Walkable amenities ~0.75 mi
Loading nearby amenities…
Taxation est. · year 1
- Rental income
- $118,800
- − Mortgage interest
- −$52,935
- − Property taxes
- −$4,725
- − Insurance
- −$9,844
- − Repairs & maintenance
- −$9,504
- − Management
- −$9,504
- − Depreciation
- −$27,491
- Taxable income
- $4,798
- Est. tax owed @ 24.0%
- −$1,152
- After-tax cash flow
- $18,664/yr
For passive investors: Depreciation is non-cash, so a rental often shows a tax loss while cash-flowing — sheltering income. Rental losses are passive: they offset passive income freely, and up to $25,000/yr can offset ordinary (W-2) income if you actively participate and your MAGI is under $100k (phasing out to $0 by $150k); unused losses carry forward. On sale, claimed depreciation is recaptured at up to 25%, and gains may owe capital-gains tax (a 1031 exchange can defer both). Figures are a year-1 estimate at your 24.0% rate — not tax advice; consult a CPA.
Schools (NCES district)
- District
- North Wildwood School District
- NCES district ID
- 3411670
- Math proficiency
- 55% ▲ 5.00%
- Reading proficiency
- 45% ▬ 0.00%
- Median HH income
- $45,310
- Composite
- 44.38/100
- National rank
- #6123
- State rank
- #396 of 612 in NJ
Livability — North Wildwood
- Score
- 68/100
- State rank
- #318
- US rank
- #9827
Category grades
Schools grade is shown separately in the Schools card above.
Census & demographics
- Census place
- North Wildwood, NJ
- Population (ZIP)
- 12,913
Population outlook (Cape May County) Hauer SSP2
- Today (2025)
- 88,234 people
- By 2030
- 84,144 · -4.6%
- By 2040
- 75,146 · -14.8%
- By 2050
- 67,389 · -23.6%
- By 2075
- 55,732 · -36.8%
- By 2100
- 44,972 · -49.0%
Race, ethnicity, and origin ACS 2023
- Neighborhood character
- Predominantly White (78%)
- Race & ethnicity
- White 78% Hispanic / Latino 14% Two or more races 7% Black 3% Native American 1%
- Hispanic origin (detail)
- Mexican 10% Puerto Rican 3%
- Common ancestry
- Romanian 7% Slovak 2% Lithuanian 1%
- Foreign-born
- 9% · Canada
- Languages at home
- 84% English-only · Spanish 12% Other Indo-European 3% French/Haitian/Cajun 1%
Political lean MEDSL · Cape May
- 2024 margin
- R (+19.2) · D 39.7% · R 58.9% · Other 1.4%
- 2008→2024 swing
- -10.6pp toward R · 2008: -8.7pp · 2024: -19.2pp
- All cycles
- 2024: R+19.2 2020: R+15.9 2016: R+19.9 2012: R+8.9 2008: R+8.7
Not yet ingested
- Civics
- —
Market trends
- HPI YoY
- ▼ -243.83%
- Current HPI
- 551.3393
- Rent YoY
- —
- Metro
- —
- State GDP YoY
- ▲ 2.05%
- F500 in state
- 34
Industry mix (Fortune 500 HQ in NJ)
| Industry | F500 HQs | Revenue |
|---|---|---|
| Consumer Goods | 3 | $31B |
|
||
| Pharmaceuticals | 2 | $153B |
|
||
| Technology | 2 | $21B |
|
||
| Insurance | 2 | $20B |
|
||
| Healthcare | 2 | $19B |
|
||
| Financial Services | 1 | $70B |
|
||
Price history
+323.4% since first listed2 events — show timeline
- 2026-04-22 Listed $995,000 CMCMLS
- 2003-01-09 Sold (Public Records) $235,000 Public Records
Property tax history
+1.5%/yrLatest (2025): $4,725 · +2.1% YoY. Source: county tax records.
Cash-flow waterfall
monthlySold comps — $/sqft
last 12 mo · ≤1 miLoading sold comps…