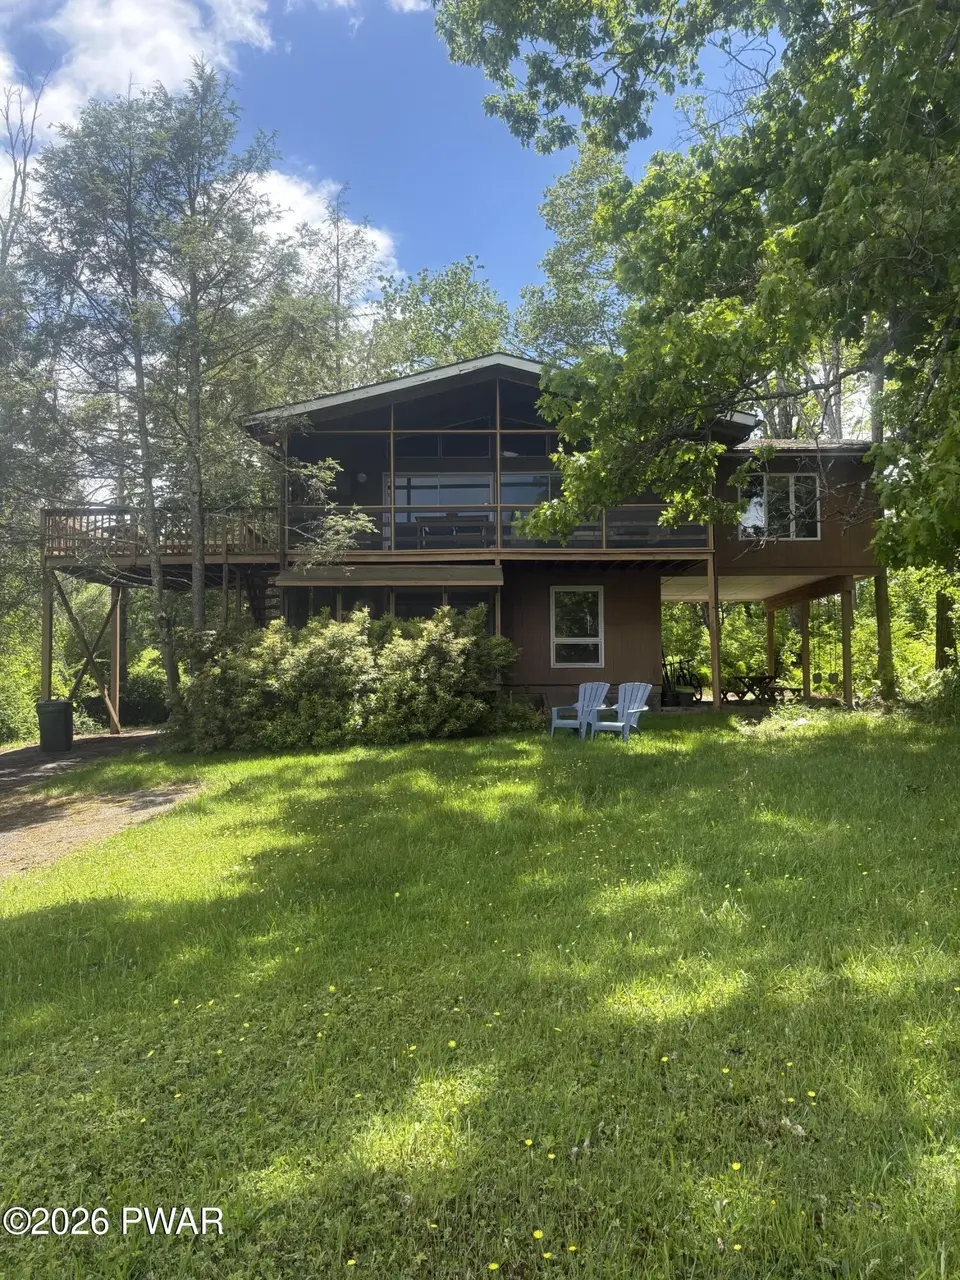
805 Fairway Ct · Hemlock Farms, PA
Flood risk 1/10 · Minimal
- FEMA flood zone
- X (unshaded)
- Chance of flooding over 30 yrs
- 0.0%
- Est. flood insurance / yr
- $473 – $860
Fire risk 4/10 · Minor
- Est. fire insurance / yr
- $511 – $949
Heat risk 2/10 · Minimal
- Hot days now (above 91°F)
- 7 days/yr
- Hot days in 30 yrs
- 15 days/yr
Wind risk 4/10 · Minor
- Chance of severe wind over 30 yrs
- 8.0%
Air-quality risk 2/10 · Minimal
- Unhealthy air days now
- 1 days/yr
- Unhealthy air days in 30 yrs
- 2 days/yr
Risk factors via First Street. Map © Google.
Why this score? — see what drove the A- grade
The composite is a weighted blend of 9 inputs, each scored 0–100. Each bar is that input's sub-score; the figure is the points it added to the 100-point composite (weight × sub-score).
- Cash flow +30.0/30.0
- ARV discount +12.6/15.0
- DSCR +10.0/10.0
- Appreciation +10.0/10.0
- 1% rule +9.7/10.0
- Schools +4.2/10.0
- Livability +3.4/5.0
- Rent growth +2.5/5.0
- Condition / age +2.5/5.0
$269,000
🖨 Deal sheet 📄 Offer letter ✓ Due diligence
Listing remarks
Welcome to your private retreat in the heart of Hemlock Farms! Nestled on a picturesque 3/4-acre lakeview lot at the end of a quiet cul-de-sac, this spacious four-bedroom, three full-bath home offers the perfect blend of comfort, privacy, and year-round enjoyment. Step inside and discover a warm and inviting interior featuring two stunning fireplaces, creating cozy gathering spaces for family and friends. The home's generous layout provides plenty of room for entertaining, relaxing, and making lasting memories. Enjoy the beauty of nature from the screened-in porch or unwind on the outdoor deck overlooking the serene surroundings. The backyard is designed for making the most of every season,
Key facts
- Lakeview lot
- Screened-in porch
- Quiet cul-de-sac
Tags
Property features AI
Finance
- Other: Directions: From Hemlock Farms main entrance - follow Hemlock Farms Rd to left on Orchard, left on Fairway, left on Fairway Court
- Financial info: Property taxes reported (amount excluded per instructions)
- HOA & community: Homeowners association with an annual fee of $2,995 (about $249.58/month); Community amenities include clubhouse, racquetball, pool, lake, gated access, fitness center, and fishing; Subdivision: Hemlock Farms
Exterior
- Parking: Parking details not provided
- Security: 24-hour security
- Utilities: 200+ amp electric service; Septic tank
- Home design: Single family residence; Residential zoning; Three or more levels; Approximately 1,900 above-grade finished area
- Construction: Asphalt/fiberglass roof
- Exterior features: Covered patio/porch; Side porch; Screened porch; Front porch; Deck; Has a view; Private maintained road access; Private road frontage
Interior
- Kitchen: Electric range; Electric oven; Electric cooktop; Microwave; Dishwasher; Electric water heater
- Bedrooms: Total of 7 rooms (bedroom count not specified)
- Flooring: Combination flooring
- Bathrooms: 3 full bathrooms
- Heating & cooling: Baseboard heating; Electric heating; Wood heating; Fireplace(s); Ceiling fans; Window air conditioning units
- Interior features: Open floorplan; Full, unfinished basement
- Laundry & utility: Washer and dryer included; Laundry room on upper level
Neighborhood map
What this means for you Summary
Snapshot
- This is a 3-bed/2.0-bath single-family listed at $269k.
Deal economics
- At list price, monthly cash flow is $1k ($13k/yr) — positive.
- The deal already cash-flows at list — no discount required.
- Meets the 1% rule at list price ($4k rent vs $269k).
- Cap rate 11.2% vs local median 7.1% in Hemlock Farms — top-decile yield for the area; either an underpriced asset or a hidden risk that comps aren't pricing in. Stress-test before assuming the spread holds.
Location & tenants
- Location reads 68/100 on livability (#884 in PA) — a middle-class / working-renter tenant base. Strengths: crime A+, housing A+, health & safety A+; Watch: schools C-, amenities F, commute F.
- Wallenpaupack Area SD (rural): math 39% / reading 59% proficiency, ranked #192 of 539 in PA (top 36%) — families likely to look elsewhere, expect single-tenant / working-renter base with shorter leases.
- Market conditions: 371 active listings in the ZIP; 3 comparable units currently listed for rent nearby; rentals leasing fast (median 2d on market — plan ~1-2 weeks tenant-placement turnaround); 213 units permitted in Pike County in 2024 (0 in 5+ unit buildings).
Forward outlook
- In year one you build about $29k of equity ($2k loan paydown + $27k appreciation (10.0% local appreciation)).
- Pike County population projected at -25% by 2050 — secular population decline; favor cash flow + early exit over multi-decade hold.
- At projected returns (10.0% appreciation + 3.0% rent growth), your $75k cash investment doubles in ~2 years — after that, you're playing with house money.
- By year 2, paydown + projected appreciation supports a ~$46k cash-out refi (75% LTV) — recoverable capital for the next deal without selling this one.
Negotiation context
- Only 9 days on market — expect competitive offers; lowballing is unlikely to land.
- Current owner paid $225k; 20% above their basis — modest negotiation headroom, anchor on the comps not their cost.
Questions for the listing agent
- Built in 1970 — when were the roof, HVAC, electrical panel, plumbing, and water heater last replaced?
- What does the HOA fee cover, when was the last increase, and are there any pending special assessments or reserve-fund shortfalls?
- Is there a deadline driving the sale (1031 exchange, divorce, estate, relocation)? That informs how much negotiation room exists.
- What's the average days-on-market for RENTAL listings here right now (not sales)? A rising rental-DOM trend means longer vacancies and softer asking-rent achievability than the comps imply.
- What's the recent tenant-quality profile in this submarket — average credit score on applications, eviction rate, late-payment / NSF rate, and stable-employment percentage? A property-management company in the area should have these aggregated.
- How much new for-sale + rental construction is in the pipeline within 1–3 miles? Heavy new supply typically softens prices + rents 12–24 months out; constrained supply supports both.
Investment metrics
- 1% rule
- 1.47% ✓
- Cap rate
- 11.20%
- Cash-on-cash
- 17.52%
- DSCR
- 1.78
- GRM
- 5.7
CMA / ARV
- ARV (on-the-fly)
- $303,584
- Comps found
- 12
Show comp detail 12 sales within ~0.75 mi
| Address | Dist | Beds/Ba | Sqft | Sold | Price | $/sf | Match |
|---|---|---|---|---|---|---|---|
| 128 Portage Ln | 0.68mi | 3/2.0 | 1,651 (-3%) | 3mo | $340,000 | $206 | 61 |
| 128 Horseshoe Ln | 0.52mi | 3/2.0 | 1,485 (-12%) | 1mo | $190,000 | $128 | 54 |
| 130 Canterbrook Dr | 0.70mi | 3/2.5 | 1,550 (-9%) | 1mo | $260,000 | $168 | 50 |
| 130 Canterbrook Dr #130 | 0.70mi | 3/2.5 | 1,550 (-9%) | 1mo | $260,000 | $168 | 50 |
| 111 Horseshoe Ln | 0.54mi | 2/2.0 (-1) | 1,500 (-12%) | 1mo | $178,500 | $119 | 50 |
| 109 Canterbrook Dr | 0.54mi | 3/2.0 | 1,536 (-9%) | 11mo | $275,000 | $179 | 50 |
| 803 Lariat Ct | 0.62mi | 4/2.0 (+1) | 1,588 (-6%) | 8mo | $190,000 | $120 | 48 |
| 121 Canterbrook Dr | 0.63mi | 3/1.5 | 1,892 (+12%) | 1mo | $285,000 | $151 | 48 |
| 115 Jackson Dr | 0.60mi | 4/2.0 (+1) | 1,496 (-12%) | 6mo | $355,000 | $237 | 42 |
| 110 Washington Dr | 0.57mi | 3/2.5 | 1,944 (+15%) | 9mo | $350,000 | $180 | 40 |
| 805 Jefferson Ct | 0.68mi | 4/2.0 (+1) | 1,540 (-9%) | 12mo | $295,000 | $192 | 38 |
| 405 Canoebrook Dr | 0.73mi | 3/2.0 | 1,456 (-14%) | 8mo | $267,500 | $184 | 36 |
Match score weights: distance 35% · size 25% · config 20% · recency 20%. Top-matched comps best support the ARV.
Projected returns pro-forma
10.0% appreciation · 3.0% rent growth · sell at horizon
- IRR
- 37.3%
- Equity multiple
- 3.88×
- Total profit
- $216,685
- Equity at exit
- $242,337
- IRR
- 32.1%
- Equity multiple
- 8.75×
- Total profit
- $583,358
- Equity at exit
- $522,608
Cash invested: $75,320 (down + closing). Projections, not guarantees.
Landlord ↔ Tenant lean methodology
- Overall (STATE)
- 62 Landlord-Friendly
- State Pennsylvania
- 62 Landlord-Friendly · EVEN
- County
- — inherits STATE
- City
- — inherits STATE
ZIP-level market 18428
- Home prices YoY
- 9.2%
- Active inventory
- 371
- Price-to-rent
- 5.7×
Monthly cashflow live
- Estimated rent
- $3,953 medium interval (Pro) →
- Mortgage (P&I)
- −$1,411
- Tax from tax record
- −$251 /mo · $3,006/yr
- Insurance
- −$112
- HOA
- −$250
- Vacancy / Maint / Mgmt
- −$830
- Net cashflow
- $1,099
Break-even live
UW: 25.0% down · 7.5% · 30yr · 1.5% tax · 5.0% vac · 8.0% maint · 8.0% mgmt
Financing live
Cash to close
- Down payment
- $67,250
- Closing costs
- $8,070
- Reserves months
- —
- Total cash needed
- —
Loan-product check · same deal, 3 products live
Conventional
25% down · 7.5% · 30yr
- Down + closing
- —
- Monthly P&I
- —
- Monthly cashflow
- —
- DSCR
- —
- Eligible?
- —
Personal DTI + credit; lowest rate.
DSCR
20% down · 8.5% · 30yr
- Down + closing
- —
- Monthly P&I
- —
- Monthly cashflow
- —
- DSCR
- —
- Eligible?
- —
No personal income docs; deal must DSCR.
Hard money
10% down · 12.0% · 12mo
- Down + closing
- —
- Monthly P&I
- —
- Monthly cashflow
- —
- DSCR
- —
- Eligible?
- —
Short-term bridge; refi at stabilization.
Rent comps 3 comps
| Address | Beds | Baths | Sqft | Rent | $/sqft | DOM | Units | Dist |
|---|---|---|---|---|---|---|---|---|
| 113 Portage Ln Milford, PA | 3.0 | 2.0 | 1400 | $4,000 | $2.86 | 1d | 1 | 0.65mi |
| 402 Canoe Brook Dr Hawley, PA | 3.0 | 2.0 | 2055 | $3,500 | $1.70 | 1d | 1 | 0.67mi |
| 101 Pommel Dr Hawley, PA | 3.0 | 2.0 | 1691 | $4,400 | $2.60 | 1d | 1 | 0.90mi |
HOA detail
- Monthly dues
- $250 · $3,000/yr
Listing history 8 events
-
2026-06-08statusdays on market $269,000 Pending 9 DOM
-
2026-06-07days on market $269,000 Active 8 DOM
-
2026-06-04days on market $269,000 Active 5 DOM
-
2026-06-03days on market $269,000 Active 4 DOM
-
2026-06-02days on market $269,000 Active 3 DOM
-
2026-06-01days on market $269,000 Active 2 DOM
-
2026-05-31remarks 699-char remark
-
2026-05-31$269,000 Active 1 DOM
ⓘ Source: listings_history table (triggers on properties + properties_extension) + one-shot
backfill from property_details.listing_events for pre-trigger history.
Tax reassessment forecast PA · Partial reset (capped growth)
- Current annual tax
- $3,006 · $251/mo
- Projected year-2 tax
- $3,628 · $302/mo
- Expected delta
- +$622/yr (+$52/mo · 20.7%)
ⓘ Screening estimate from a state-policy table — verify with the county assessor before closing.
Climate risk First Street
- Flood 1/10 Low FEMA zone X (unshaded) · 0% chance over 30 yrs
- Wildfire 4/10 Moderate
- Heat 2/10 Low 7 d/yr ≥91°F today · 15 d/yr by 30 yrs out
- Wind 4/10 Moderate 8% chance of damaging wind over 30 yrs
- Air quality 2/10 Low 1 unhealthy d/yr today · 2 by 30 yrs out
Nearby sold comps map
Loading sold comps map…
Walkable amenities ~0.75 mi
Loading nearby amenities…
Taxation est. · year 1
- Rental income
- $47,433
- − Mortgage interest
- −$15,068
- − Property taxes
- −$3,006
- − Insurance
- −$1,345
- − Repairs & maintenance
- −$3,795
- − Management
- −$3,795
- − HOA
- −$3,000
- − Depreciation
- −$7,825
- Taxable income
- $9,598
- Est. tax owed @ 24.0%
- −$2,304
- After-tax cash flow
- $10,889/yr
For passive investors: Depreciation is non-cash, so a rental often shows a tax loss while cash-flowing — sheltering income. Rental losses are passive: they offset passive income freely, and up to $25,000/yr can offset ordinary (W-2) income if you actively participate and your MAGI is under $100k (phasing out to $0 by $150k); unused losses carry forward. On sale, claimed depreciation is recaptured at up to 25%, and gains may owe capital-gains tax (a 1031 exchange can defer both). Figures are a year-1 estimate at your 24.0% rate — not tax advice; consult a CPA.
Schools (NCES district)
- District
- Wallenpaupack Area SD
- NCES district ID
- 4224750
- Math proficiency
- 39% ▼ -10.00%
- Reading proficiency
- 59% ▼ -5.00%
- Median HH income
- $51,027
- Composite
- 41.97/100
- National rank
- #3345
- State rank
- #192 of 539 in PA
Livability — Hemlock Farms
- Score
- 68/100
- State rank
- #884
- US rank
- #9421
Category grades
Schools grade is shown separately in the Schools card above.
Census & demographics
- Census place
- Hemlock Farms, PA
- Population (ZIP)
- 12,446
Population outlook (Pike County) Hauer SSP2
- Today (2025)
- 53,548 people
- By 2030
- 51,622 · -3.6%
- By 2040
- 46,490 · -13.2%
- By 2050
- 40,372 · -24.6%
- By 2075
- 31,951 · -40.3%
- By 2100
- 26,821 · -49.9%
Race, ethnicity, and origin ACS 2023
- Neighborhood character
- Predominantly White (85%)
- Race & ethnicity
- White 85% Hispanic / Latino 8% Two or more races 6% Black 1% Asian 1%
- Hispanic origin (detail)
- Puerto Rican 5%
- Common ancestry
- Romanian 5% Portuguese 3% Italian 2%
- Foreign-born
- 5% · Canada
- Languages at home
- 91% English-only · Spanish 5% Russian/Polish/Slavic 1% Other Asian/Pacific 1%
Political lean MEDSL · Pike
- 2024 margin
- Strong R (+24.1) · D 37.6% · R 61.6%
- 2008→2024 swing
- -19.8pp toward R · 2008: -4.2pp · 2024: -24.1pp
- All cycles
- 2024: R+24.1 2020: R+19.0 2016: R+26.0 2012: R+11.0 2008: R+4.2
Not yet ingested
- Civics
- —
Market trends
- HPI YoY
- ▲ 28.60%
- Current HPI
- 340.8254
- Rent YoY
- —
- Metro
- —
- State GDP YoY
- ▲ 1.68%
- F500 in state
- 34
Industry mix (Fortune 500 HQ in PA)
| Industry | F500 HQs | Revenue |
|---|---|---|
| Healthcare | 2 | $309B |
|
||
| Insurance | 2 | $27B |
|
||
| Telecommunications / Media | 1 | $124B |
|
||
| Industrial Distribution | 1 | $22B |
|
||
| Financial Services | 1 | $20B |
|
||
| Chemicals / Materials | 1 | $18B |
|
||
Price history
+19.6% since first listed2 events — show timeline
- 2026-05-30 Listed $269,000 PWMLS
- 2007-03-06 Sold (Public Records) $225,000 Public Records
Property tax history
+2.8%/yrLatest (2026): $3,006 · +3.0% YoY. Source: county tax records.
Cash-flow waterfall
monthlySold comps — $/sqft
last 12 mo · ≤1 miLoading sold comps…