 Multi-family
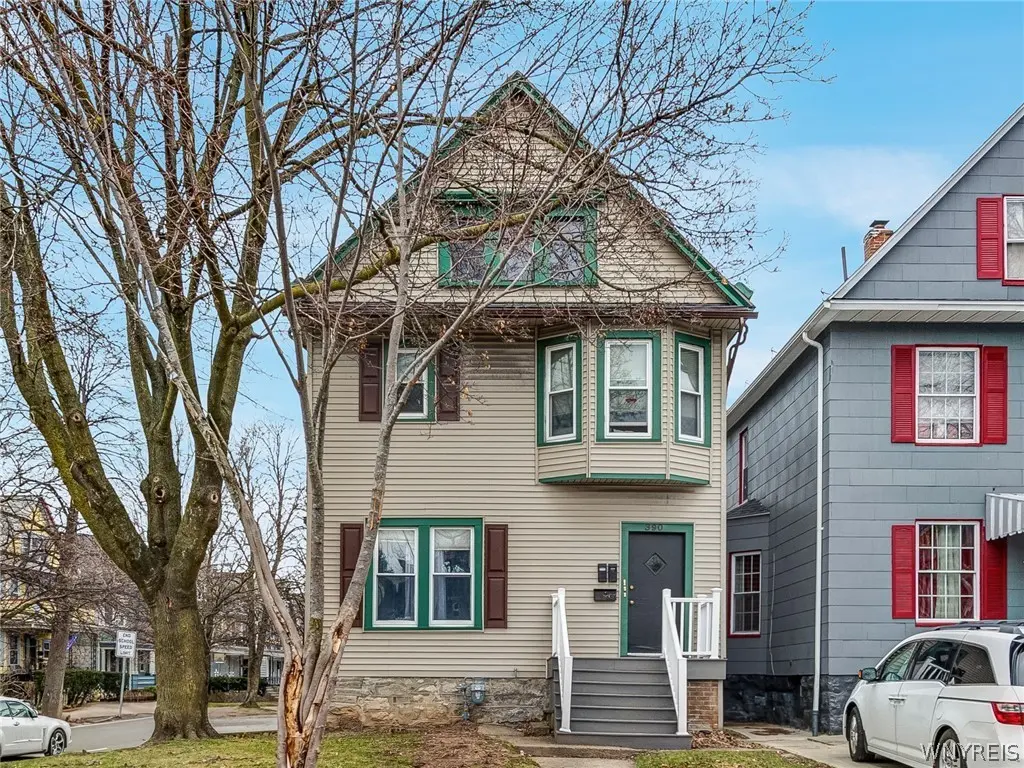
390 W Delavan Ave · Buffalo, NY
Flood risk 1/10 · Minimal
- FEMA flood zone
- X (unshaded)
- Chance of flooding over 30 yrs
- 0.0%
- Est. flood insurance / yr
- $473 – $860
Fire risk 1/10 · Minimal
- Est. fire insurance / yr
- $691 – $1,283
Heat risk 3/10 · Minor
- Hot days now (above 91°F)
- 7 days/yr
- Hot days in 30 yrs
- 15 days/yr
Wind risk 1/10 · Minimal
- Chance of severe wind over 30 yrs
- —
Air-quality risk 4/10 · Minor
- Unhealthy air days now
- 4 days/yr
- Unhealthy air days in 30 yrs
- 9 days/yr
Risk factors via First Street. Map © Google.
Why this score? — see what drove the A- grade
The composite is a weighted blend of 9 inputs, each scored 0–100. Each bar is that input's sub-score; the figure is the points it added to the 100-point composite (weight × sub-score).
- Cash flow +30.0/30.0
- ARV discount +12.5/15.0
- 1% rule +10.0/10.0
- DSCR +10.0/10.0
- Appreciation +8.8/10.0
- Livability +3.9/5.0
- Schools +3.3/10.0
- Rent growth +2.4/5.0
- Condition / age +2.2/5.0
$319,777
🖨 Deal sheet 📄 Offer letter ✓ Due diligence
Multi-family units
County records classify this as Multi-Family (2-4 Unit). Listing-text estimate: 1 unit. estimate disagrees with records
Listing remarks MLS
Positioned in one of Buffalo’s most sought-after West Side locations, this well-maintained three-unit property offers a compelling blend of stability and upside. Set along a convenient bus line with effortless access to downtown, Elmwood Village, and the city’s vibrant dining and cultural scene, the location speaks for itself. The building features durable vinyl siding and a practical unit mix, including one spacious two-bedroom and two one-bedroom apartments—appealing to a wide range of tenants. All three units are currently tenant occupied, one is currently M2M, with the other two becoming M2M 6/1, providing immediate income with the flexibility for an investor or owner-occupant to optimize rents or tailor future use. A rare opportunity to secure a solid multifamily asset in a high-demand corridor where walkability, connectivity, and long-term growth continue to drive value.
Key facts
- 2,417 sq ft lot
- Built 1900
- Listed 73 days
Neighborhood map
What this means for you Summary
Snapshot
- This is a 4-bed/3.0-bath multifamily listed at $320k. Condition is rated fair.
Deal economics
- At list price, monthly cash flow is $2k ($21k/yr) — positive.
- The deal already cash-flows at list — no discount required.
- Meets the 1% rule at list price ($5k rent vs $320k).
- Recommended offer: $301k (6.0% below list) — sets the bar for market timing.
- Cap rate 12.9% vs local median 8.0% in Buffalo — top-decile yield for the area; either an underpriced asset or a hidden risk that comps aren't pricing in. Stress-test before assuming the spread holds.
Location & tenants
- Location reads 77/100 on livability (#195 in NY, #3,011 nationally) — a middle-class / working-renter tenant base. Strengths: commute A+, housing A+, health & safety A+; Watch: crime F, employment D-.
- Buffalo City School District (urban): math 41% / reading 40% proficiency, ranked #535 of 590 in NY (top 91%) — families likely to look elsewhere, expect single-tenant / working-renter base with shorter leases; 75% free/reduced lunch — lower-income household profile, screen leases tightly.
- Market conditions: Rents soft (-0.5%/yr); 137 active listings in the ZIP; 27 comparable units currently listed for rent nearby; rentals at typical pace (median 24d on market — plan ~3-4 weeks tenant-placement turnaround); 1,244 units permitted in Erie County in 2024 (563 in 5+ unit buildings).
- At $5,022/mo this rent would consume 112% of the median local household income ($54k/yr) (locally 1501% of renters already pay >50% of income on rent) — very limited rent-growth headroom before tenants either downsize or default.
Forward outlook
- In year one you build about $26k of equity ($2k loan paydown + $24k appreciation (7.5% local appreciation)).
- At projected returns (7.5% appreciation + 0.0% rent growth), your $90k cash investment doubles in ~2 years — after that, you're playing with house money.
- By year 2, paydown + projected appreciation supports a ~$42k cash-out refi (75% LTV) — recoverable capital for the next deal without selling this one.
Negotiation context
- It's been on market 73 days — a 6% lower offer ($301k) is reasonable based on typical stale-listing flexibility.
- 3 sale attempts with the ask held roughly flat each time — persistent listings suggest the price (not the market) is what's stuck; bring a comps-based counter.
Risks & watch-outs
- Watch-outs: built in 1900 — expect roof / HVAC / electrical / plumbing capex.
Questions for the listing agent
- It's been on market 73 days. Have you received any prior offers? Is the seller open to a 6% concession, seller financing, or rate buy-down credit?
- Have any recent inspections been done? Can we get a copy of the seller's disclosures and any deferred-maintenance estimates?
- Built in 1900 — when were the roof, HVAC, electrical panel, plumbing, and water heater last replaced?
- Why hasn't it sold? Are there any deal-killer items the seller is aware of (foundation, flood, title, zoning, code violations)?
- Is there a deadline driving the sale (1031 exchange, divorce, estate, relocation)? That informs how much negotiation room exists.
- Crime grade is F in this area — have there been break-ins, vandalism, or insurance claims at this property in the last 3 years? What carrier currently insures it and at what premium?
- What's the average days-on-market for RENTAL listings here right now (not sales)? A rising rental-DOM trend means longer vacancies and softer asking-rent achievability than the comps imply.
- What's the recent tenant-quality profile in this submarket — average credit score on applications, eviction rate, late-payment / NSF rate, and stable-employment percentage? A property-management company in the area should have these aggregated.
- How much new apartment / multifamily construction is in the pipeline within 1–3 miles? Heavy new supply (>2% of stock underway) typically softens rents 12–24 months out; light construction supports rent growth.
Investment metrics
- 1% rule
- 1.57% ✓
- Cap rate
- 12.89%
- Cash-on-cash
- 23.55%
- DSCR
- 2.05
- GRM
- 5.3
CMA / ARV
- ARV (median comp)
- $359,506
- List price
- $319,777
- Delta
- -11.05%
- Verdict
- UNDERPRICED
- Comps
- 20 within 1.0 mi
Show comp detail 11 sales within ~0.75 mi
| Address | Dist | Beds/Ba | Sqft | Sold | Price | $/sf | Match |
|---|---|---|---|---|---|---|---|
| 276 Potomac Ave | 0.24mi | 4/2.0 | 1,674 (-1%) | 4mo | $167,000 | $100 | 79 |
| 73 Baynes St | 0.33mi | 4/2.0 | 1,698 (+0%) | 6mo | $199,900 | $118 | 75 |
| 228 Potomac Ave | 0.33mi | 3/2.0 (-1) | 1,782 (+6%) | 10mo | $325,000 | $182 | 58 |
| 475 W Ferry St | 0.49mi | 3/2.0 (-1) | 1,740 (+3%) | 6mo | $236,900 | $136 | 58 |
| 118 Auburn Ave | 0.63mi | 4/2.0 | 1,760 (+4%) | 9mo | $260,000 | $148 | 52 |
| 221 Lexington Ave | 0.70mi | 4/2.0 | 1,620 (-4%) | 8mo | $425,000 | $262 | 49 |
| 35 Livingston St | 0.41mi | 4/2.0 | 1,816 (+8%) | 20mo | $250,000 | $138 | 47 |
| 319 Breckenridge St | 0.46mi | 3/2.0 (-1) | 1,632 (-3%) | 22mo | $159,900 | $98 | 45 |
| 92 Dewitt St | 0.58mi | 4/2.0 | 1,856 (+10%) | 13mo | $60,000 | $32 | 42 |
| 23 Sherwood St | 0.71mi | 3/2.0 (-1) | 1,830 (+8%) | 4mo | $150,000 | $82 | 41 |
| 20 Auchinvole Ave | 0.47mi | 4/2.0 | 1,846 (+9%) | 23mo | $160,000 | $87 | 39 |
Match score weights: distance 35% · size 25% · config 20% · recency 20%. Top-matched comps best support the ARV.
Projected returns pro-forma
7.51% appreciation · 0.0% rent growth · sell at horizon
- IRR
- 36.0%
- Equity multiple
- 3.45×
- Total profit
- $219,117
- Equity at exit
- $232,405
- IRR
- 31.1%
- Equity multiple
- 6.87×
- Total profit
- $525,695
- Equity at exit
- $451,619
Cash invested: $89,538 (down + closing). Projections, not guarantees.
Landlord ↔ Tenant lean methodology
- Overall (STATE)
- 15 Strongly Tenant-Friendly
- State New York
- 15 Strongly Tenant-Friendly · D+10
- County
- — inherits STATE
- City
- — inherits STATE
ZIP-level market 14213
- Home prices YoY
- 1.7%
- Rents YoY
- -0.5%
- Active inventory
- 137
- Price-to-rent
- 15.9×
Monthly cashflow live
- Estimated rent
- $5,022 medium interval (Pro) →
- Mortgage (P&I)
- −$1,677
- Tax est. 1.5%
- −$400 /mo · $4,797/yr
- Insurance
- −$133
- HOA
- −$0
- Vacancy / Maint / Mgmt
- −$1,055
- Net cashflow
- $1,757
Break-even live
3-unit breakdown (identical units grouped — click to expand)
| Units | Beds | Baths | Est. rent |
|---|---|---|---|
| 3× units | 4 | 3 | $5,022 |
| #1 | 4 | 3 | $1,674 |
| #2 | 4 | 3 | $1,674 |
| #3 | 4 | 3 | $1,674 |
| Total (3 units) | $5,022 | ||
UW: 25.0% down · 7.5% · 30yr · 1.5% tax · 5.0% vac · 8.0% maint · 8.0% mgmt
Financing live
Cash to close
- Down payment
- $79,944
- Closing costs
- $9,593
- Reserves months
- —
- Total cash needed
- —
Loan-product check · same deal, 3 products live
Conventional
25% down · 7.5% · 30yr
- Down + closing
- —
- Monthly P&I
- —
- Monthly cashflow
- —
- DSCR
- —
- Eligible?
- —
Personal DTI + credit; lowest rate.
DSCR
20% down · 8.5% · 30yr
- Down + closing
- —
- Monthly P&I
- —
- Monthly cashflow
- —
- DSCR
- —
- Eligible?
- —
No personal income docs; deal must DSCR.
Hard money
10% down · 12.0% · 12mo
- Down + closing
- —
- Monthly P&I
- —
- Monthly cashflow
- —
- DSCR
- —
- Eligible?
- —
Short-term bridge; refi at stabilization.
Rent comps 27 comps
| Address | Beds | Baths | Sqft | Rent | $/sqft | DOM | Units | Dist |
|---|---|---|---|---|---|---|---|---|
| 374 Baynes St Buffalo, NY | 3.0 | 1.0 | 1126 | $1,550 | $1.38 | 43d | 1 | 0.26mi |
| 40 Putnam St Buffalo, NY | 4.0 | 1.0 | 1600 | $2,100 | $1.31 | 23d | 1 | 0.27mi |
| 309 Bird Ave Unit 1 Buffalo, NY | 3.0 | 1.0 | 1100 | $2,200 | $2.00 | 43d | 1 | 0.29mi |
| 305 Bird Ave Unit 3 Buffalo, NY | 3.0 | 1.5 | 1128 | $2,300 | $2.04 | 43d | 1 | 0.29mi |
| 478 Breckenridge St Buffalo, NY | 3.0 | 1.0 | 1100 | $1,575 | $1.43 | 43d | 1 | 0.34mi |
| 836 Richmond Ave Buffalo, NY | 4.0 | 3.5 | 1982 | $4,500 | $2.27 | 43d | 1 | 0.34mi |
| 37 Abbottsford Pl Buffalo, NY | 3.0 | 1.0 | 1130 | $1,650 | $1.46 | 43d | 1 | 0.36mi |
| 311 Herkimer St #1 Buffalo, NY | 3.0 | 1.0 | 1272 | $1,400 | $1.10 | 14d | 1 | 0.38mi |
| 891 Richmond Ave Buffalo, NY | 3.0 | 1.0 | 1176 | $1,800 | $1.53 | 43d | 1 | 0.45mi |
| 740 Elmwood Ave Buffalo, NY | 3.0 | 1.0 | 2000 | $1,995 | $1.00 | 14d | 1 | 0.51mi |
| 232 Dewitt St Buffalo, NY | 3.0 | 1.0 | 1200 | $1,300 | $1.08 | 23d | 1 | 0.52mi |
| 375 Hampshire St Buffalo, NY | 3.0 | 1.0 | 1200 | $1,100 | $0.92 | 43d | 1 | 0.54mi |
| 685 Auburn Ave Unit 2 Buffalo, NY | 3.0 | 1.0 | 1200 | $1,750 | $1.46 | 14d | 1 | 0.55mi |
| 310 Hampshire St Apt 3 Buffalo, NY | 3.0 | 1.0 | 1200 | $1,500 | $1.25 | 43d | 1 | 0.63mi |
| 100 Forest Ave Buffalo, NY | 2.0–4.0 | 2.0–4.0 | 1304 | $2,560 | $1.96 | 1d | 14 | 0.66mi |
| 161 16th St Buffalo, NY | 3.0 | 1.5 | 1500 | $2,000 | $1.33 | 23d | 1 | 0.93mi |
| 825 Forest Ave Unit 1 Buffalo, NY | 3.0 | 1.0 | 1200 | $1,700 | $1.42 | 3d | 1 | 0.94mi |
| 825 Forest Ave Buffalo, NY | 3.0 | 1.0 | 1200 | $2,000 | $1.67 | 23d | 1 | 0.94mi |
| 330 Bryant St Buffalo, NY | 3.0 | 2.0 | 2224 | $2,200 | $0.99 | 19d | 1 | 0.96mi |
| 118 Ashland Ave Buffalo, NY | 3.0 | 1.0 | 1326 | $1,850 | $1.40 | 14d | 1 | 1.01mi |
| 238 Oxford Ave Unit Upper Buffalo, NY | 3.0 | 1.0 | 1100 | $1,600 | $1.45 | 23d | 1 | 1.06mi |
| 184 14th St Buffalo, NY | 4.0 | 2.0 | 1950 | $4,400 | $2.26 | 23d | 1 | 1.12mi |
| 62 Germain St Buffalo, NY | 3.0 | 1.0 | 1320 | $1,250 | $0.95 | 23d | 1 | 1.20mi |
| 78 Germain St Buffalo, NY | 3.0 | 1.0 | 2030 | $1,300 | $0.64 | 14d | 1 | 1.22mi |
| 139 Fordham Dr Buffalo, NY | 3.0 | 1.0 | 1453 | $1,700 | $1.17 | 23d | 1 | 1.23mi |
| 124 Normal Ave Unit 2 Buffalo, NY | 3.0 | 1.0 | 1727 | $2,000 | $1.16 | 23d | 1 | 1.25mi |
| 76 Chester St Unit 1 Buffalo, NY | 3.0 | 1.0 | 1100 | $1,000 | $0.91 | 14d | 1 | 1.43mi |
Listing history 20 events
-
2026-06-18days on market $319,777 Active 73 DOM
-
2026-06-17days on market $319,777 Active 72 DOM
-
2026-06-16days on market $319,777 Active 71 DOM
-
2026-06-15days on market $319,777 Active 70 DOM
-
2026-06-13days on market $319,777 Active 68 DOM
-
2026-06-13days on market $319,777 Active 67 DOM
-
2026-06-10days on market $319,777 Active 65 DOM
-
2026-06-09days on market $319,777 Active 64 DOM
-
2026-06-08days on market $319,777 Active 63 DOM
-
2026-06-07days on market $319,777 Active 62 DOM
-
2026-06-03remarks 699-char remark
-
2026-06-03pricedays on market $319,777 Active 58 DOM
-
2026-06-02days on market $329,777 Active 57 DOM
-
2026-06-01days on market $329,777 Active 56 DOM
-
2026-05-31days on market $329,777 Active 55 DOM
-
2026-04-06$329,777 Active 907-char remark
Show marketing remark (907 chars)
Positioned in one of Buffalo’s most sought-after West Side locations, this well-maintained three-unit property offers a compelling blend of stability and upside. Set along a convenient bus line with effortless access to downtown, Elmwood Village, and the city’s vibrant dining and cultural scene, the location speaks for itself. The building features durable vinyl siding and a practical unit mix, including one spacious two-bedroom and two one-bedroom apartments—appealing to a wide range of tenants. All three units are currently tenant occupied, one is currently M2M, with the other two becoming M2M 6/1, providing immediate income with the flexibility for an investor or owner-occupant to optimize rents or tailor future use. A rare opportunity to secure a solid multifamily asset in a high-demand corridor where walkability, connectivity, and long-term growth continue to drive value.
-
2025-08-21historical
-
2025-06-02price $349,777
-
2025-05-16status Active
-
2025-04-07$359,777 Active
ⓘ Source: listings_history table (triggers on properties + properties_extension) + one-shot
backfill from property_details.listing_events for pre-trigger history.
Climate risk First Street
- Flood 1/10 Low FEMA zone X (unshaded) · 0% chance over 30 yrs
- Wildfire 1/10 Low
- Heat 3/10 Moderate 7 d/yr ≥91°F today · 15 d/yr by 30 yrs out
- Wind 1/10 Low
- Air quality 4/10 Moderate 4 unhealthy d/yr today · 9 by 30 yrs out
Nearby sold comps map
Loading sold comps map…
Walkable amenities ~0.75 mi
Loading nearby amenities…
Taxation est. · year 1
- Rental income
- $60,264
- − Mortgage interest
- −$17,912
- − Property taxes
- −$4,797
- − Insurance
- −$1,599
- − Repairs & maintenance
- −$4,821
- − Management
- −$4,821
- − Depreciation
- −$9,303
- Taxable income
- $17,011
- Est. tax owed @ 24.0%
- −$4,083
- After-tax cash flow
- $17,007/yr
For passive investors: Depreciation is non-cash, so a rental often shows a tax loss while cash-flowing — sheltering income. Rental losses are passive: they offset passive income freely, and up to $25,000/yr can offset ordinary (W-2) income if you actively participate and your MAGI is under $100k (phasing out to $0 by $150k); unused losses carry forward. On sale, claimed depreciation is recaptured at up to 25%, and gains may owe capital-gains tax (a 1031 exchange can defer both). Figures are a year-1 estimate at your 24.0% rate — not tax advice; consult a CPA.
Condition & rehab AI · 2 photos
This three-unit property requires moderate repairs and maintenance, including painting and landscaping, to improve its curb appeal and value.
Repairs flagged
- Moderate Vinyl siding — Weathered appearance
- Moderate Exterior paint — Faded appearance
Value-add opportunities
- Both Painting and repainting the exterior — Enhances curb appeal and value
- Both Landscaping improvements — Enhances curb appeal and value
- Both Window treatments — Improves aesthetics and energy efficiency
Renovation cost estimate screening
| Repair item | Severity | Est. cost |
|---|---|---|
| Vinyl siding · Weathered appearance | Moderate | $3,000–15,000 |
| Exterior paint · Faded appearance | Moderate | $3,000–15,000 |
| Total estimated repair cost · 2 items | $6,000–30,000 |
Value-add ROI direction
- Both Painting and repainting the exterior — Enhances curb appeal and value ↑
- Both Landscaping improvements — Enhances curb appeal and value ↑
- Both Window treatments — Improves aesthetics and energy efficiency ↑
ⓘ Cost ranges are severity-bucket heuristics (US national rule-of-thumb). Get contractor quotes + a written scope before underwriting a rehab budget.
Schools (NCES district)
- District
- Buffalo City School District
- NCES district ID
- 3605850
- Math proficiency
- 41% ▲ 11.00%
- Reading proficiency
- 40% ▲ 7.00%
- Median HH income
- $31,665
- Composite
- 33.17/100
- National rank
- #5544
- State rank
- #535 of 590 in NY
Livability — Buffalo
- Score
- 77/100
- State rank
- #195
- US rank
- #3011
Category grades
Schools grade is shown separately in the Schools card above.
Census & demographics
- Census place
- Buffalo, NY
- County
- Erie County · 714,559 people
- City population
- 440,021
- Metro
- Buffalo-Cheektowaga, NY
- Population (ZIP)
- 24,107
- Household income
- $53,870
- Rent vs Own
- Severe rent burden
- 1501.0
Population outlook (Erie County) Hauer SSP2
- Today (2025)
- 933,037 people
- By 2030
- 935,181 · +0.2%
- By 2040
- 928,531 · -0.5%
- By 2050
- 905,725 · -2.9%
- By 2075
- 834,037 · -10.6%
- By 2100
- 708,033 · -24.1%
Race, ethnicity, and origin ACS 2023
- Neighborhood character
- Highly diverse neighborhood (Simpson 0.70)
- Race & ethnicity
- White 46% Hispanic / Latino 20% Black 18% Asian 12% Two or more races 10%
- Hispanic origin (detail)
- Mexican 1% Puerto Rican 16% Dominican 1%
- Common ancestry
- Romanian 6% Slovak 3% Lithuanian 3%
- Foreign-born
- 16% · Philippines, Canada, India
- Languages at home
- 68% English-only · Spanish 12% Other Asian/Pacific 7% Arabic 3%
Political lean MEDSL · Erie
- 2024 margin
- Lean D (+9.7) · D 54.8% · R 45.2%
- 2008→2024 swing
- -7.9pp toward R · 2008: 17.5pp · 2024: 9.7pp
- All cycles
- 2024: D+9.7 2020: D+14.7 2016: D+4.8 2012: D+15.6 2008: D+17.5
Not yet ingested
- Civics
- —
Market trends
- HPI YoY
- ▲ 7.51%
- Current HPI
- 448.4879
- Rent YoY
- ▼ -0.49%
- Metro
- Buffalo-Cheektowaga, NY
- State GDP YoY
- ▲ 2.60%
- F500 in state
- 92
Industry mix (Fortune 500 HQ in NY)
| Industry | F500 HQs | Revenue |
|---|---|---|
| Financial Services | 10 | $950B |
|
||
| Consumer Goods | 9 | $162B |
|
||
| Insurance | 4 | $225B |
|
||
| Telecommunications | 2 | $144B |
|
||
| Pharmaceuticals | 2 | $112B |
|
||
| Media / Entertainment | 2 | $69B |
|
||
Price history
-8.3% since first listed5 events — show timeline
- 2026-04-06 Listed $329,777 WNYREIS
- 2025-08-21 Listing Removed — WNYREIS
- 2025-06-02 Price Changed $349,777 WNYREIS
- 2025-05-16 Relisted — WNYREIS
- 2025-04-07 Listed $359,777 WNYREIS
Cash-flow waterfall
monthlySold comps — $/sqft
last 12 mo · ≤1 miLoading sold comps…