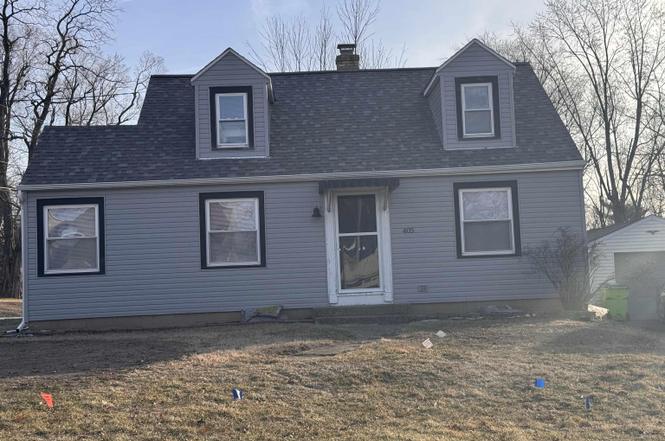
405 N Wood St · Washington, IL
Flood risk 1/10 · Minimal
- FEMA flood zone
- X (unshaded)
- Chance of flooding over 30 yrs
- 0.0%
- Est. flood insurance / yr
- $473 – $860
Fire risk 1/10 · Minimal
- Est. fire insurance / yr
- $804 – $1,492
Heat risk 3/10 · Minor
- Hot days now (above 104°F)
- 7 days/yr
- Hot days in 30 yrs
- 18 days/yr
Wind risk 2/10 · Minimal
- Chance of severe wind over 30 yrs
- 1.0%
Air-quality risk 2/10 · Minimal
- Unhealthy air days now
- 1 days/yr
- Unhealthy air days in 30 yrs
- 1 days/yr
Risk factors via First Street. Map © Google.
Why this score? — see what drove the C grade
The composite is a weighted blend of 9 inputs, each scored 0–100. Each bar is that input's sub-score; the figure is the points it added to the 100-point composite (weight × sub-score).
- Cash flow +26.9/30.0
- DSCR +9.3/10.0
- 1% rule +7.0/10.0
- Schools +3.8/10.0
- Livability +3.7/5.0
- Rent growth +2.5/5.0
- Condition / age +2.5/5.0
- ARV discount +0.0/15.0
- Appreciation +0.0/10.0
$190,000
🖨 Deal sheet 📄 Offer letter ✓ Due diligence
Listing remarks
Beautiful, move in ready 1/12 story home! Close to Lincoln Grade School in Washington. Completely renovate with fresh paint, cabinets, sink countertops, flooring, new kitchen appliances, new bathroom - bath tub, toilet, sink & flooring. New carpet and light fixtures throughout. New Vinyl Siding to make it a home to be proud of. Must see! All measurements are approximate.
Key facts
- 2 garage spots
- Built 1950
- Listed 139 days
Property features AI
Exterior
- Parking: Detached 2-car garage
- Utilities: Public water; Public sewer
- Home design: Single-family residence; Residential zoning; 1950 year built; 1528 total living area
- Construction: Has basement: crawl space, daylight access, unfinished
- Exterior features: Corner lot; Level lot; Paved road frontage; Shingle roof
Interior
- Kitchen: Dishwasher; Microwave; Refrigerator
- Bedrooms: 3 bedrooms (one on the main level, one on the upper level, one on the lower level); Bedrooms with egress windows; Bedroom flooring: carpet
- Flooring: Carpet in many rooms; Luxury vinyl plank in the kitchen
- Bathrooms: 1 full bathroom
- Heating & cooling: Forced air heating; Central air conditioning
- Interior features: Cable available; Ceiling fan(s)
- Laundry & utility: Gas water heater
Neighborhood map
What this means for you Summary
Snapshot
- This is a 2-bed/1.0-bath single-family listed at $190k.
Deal economics
- At list price, monthly cash flow is $524 ($6k/yr) — positive.
- The deal already cash-flows at list — no discount required.
- Meets the 1% rule at list price ($2k rent vs $190k).
- Recommended offer: $167k (12.0% below list) — sets the bar for market timing.
- Cap rate 9.6% vs local median 3.2% in Washington — top-decile yield for the area; either an underpriced asset or a hidden risk that comps aren't pricing in. Stress-test before assuming the spread holds.
Location & tenants
- Location reads 73/100 on livability (#272 in IL) — a middle-class / working-renter tenant base. Strengths: crime A+, employment A+, cost of living A+; Watch: amenities F, commute F, health & safety F.
- Washington Chsd 308 (suburban): math 42% / reading 42% proficiency, ranked #112 of 620 in IL (top 18%) — families likely to look elsewhere, expect single-tenant / working-renter base with shorter leases.
- Zoned schools: Washington Comm High School (math 42% / reading 42%, grade F, #76 of 693 statewide, top 12%, 1,484 students, 0% FRL).
- Market conditions: 129 active listings in the ZIP; 4 comparable units currently listed for rent nearby; rentals at typical pace (median 21d on market — plan ~3-4 weeks tenant-placement turnaround); 77 units permitted in Tazewell County in 2024 (0 in 5+ unit buildings).
Forward outlook
- Local home prices are declining (-3.0%/yr); year-one equity from $1k of loan paydown is wiped out by about $6k of value loss. Plan a longer hold.
- Tazewell County population projected at -15% by 2050 — secular population decline; favor cash flow + early exit over multi-decade hold.
- At projected returns (-3.0% appreciation + 3.0% rent growth), your $53k cash investment doubles in ~10 years — after that, you're playing with house money.
Negotiation context
- It's been on market 139 days — a 12% lower offer ($167k) is reasonable based on typical stale-listing flexibility.
- Current owner paid $130k; 46% above their basis — modest negotiation headroom, anchor on the comps not their cost.
Risks & watch-outs
- Watch-outs: built in 1950 — expect roof / HVAC / electrical / plumbing capex.
Questions for the listing agent
- It's been on market 139 days. Have you received any prior offers? Is the seller open to a 12% concession, seller financing, or rate buy-down credit?
- Built in 1950 — when were the roof, HVAC, electrical panel, plumbing, and water heater last replaced?
- Why hasn't it sold? Are there any deal-killer items the seller is aware of (foundation, flood, title, zoning, code violations)?
- Is there a deadline driving the sale (1031 exchange, divorce, estate, relocation)? That informs how much negotiation room exists.
- What's the average days-on-market for RENTAL listings here right now (not sales)? A rising rental-DOM trend means longer vacancies and softer asking-rent achievability than the comps imply.
- What's the recent tenant-quality profile in this submarket — average credit score on applications, eviction rate, late-payment / NSF rate, and stable-employment percentage? A property-management company in the area should have these aggregated.
- How much new for-sale + rental construction is in the pipeline within 1–3 miles? Heavy new supply typically softens prices + rents 12–24 months out; constrained supply supports both.
Investment metrics
- 1% rule
- 1.20% ✓
- Cap rate
- 9.61%
- Cash-on-cash
- 11.83%
- DSCR
- 1.53
- GRM
- 6.9
CMA / ARV
- ARV (on-the-fly)
- $153,925
- Comps found
- 11
Show comp detail 11 sales within ~0.75 mi
| Address | Dist | Beds/Ba | Sqft | Sold | Price | $/sf | Match |
|---|---|---|---|---|---|---|---|
| 206 Lincoln St | 0.16mi | 2/2.0 | 1,205 (+3%) | 15mo | $157,500 | $131 | 72 |
| 405 Hamilton St | 0.24mi | 3/1.0 (+1) | 1,099 (-6%) | 12mo | $89,500 | $81 | 63 |
| 619 Spring St | 0.49mi | 3/1.0 (+1) | 1,136 (-3%) | 8mo | $170,000 | $150 | 60 |
| 404 W Jefferson | 0.21mi | 2/1.0 | 1,040 (-12%) | 15mo | $147,000 | $141 | 58 |
| 400 Hamilton St | 0.27mi | 2/1.5 | 1,008 (-14%) | 14mo | $148,000 | $147 | 50 |
| 311 S Market St | 0.56mi | 3/1.0 (+1) | 1,128 (-4%) | 16mo | $145,000 | $129 | 49 |
| 205 N Church St | 0.51mi | 3/1.0 (+1) | 1,014 (-14%) | 5mo | $67,500 | $67 | 44 |
| 805 E Adams St | 0.70mi | 3/2.0 (+1) | 1,120 (-5%) | 9mo | $199,000 | $178 | 43 |
| 317 Court Dr | 0.74mi | 2/1.0 | 1,248 (+6%) | 17mo | $135,000 | $108 | 41 |
| 215 Court Dr | 0.67mi | 3/1.0 (+1) | 1,327 (+13%) | 4mo | $170,000 | $128 | 39 |
| 106 Bondurant St | 0.57mi | 3/1.5 (+1) | 1,334 (+14%) | 10mo | $200,000 | $150 | 36 |
Match score weights: distance 35% · size 25% · config 20% · recency 20%. Top-matched comps best support the ARV.
Projected returns pro-forma
-3.0% appreciation · 3.0% rent growth · sell at horizon
- IRR
- 1.3%
- Equity multiple
- 1.05×
- Total profit
- $2,627
- Equity at exit
- $28,330
- IRR
- 10.9%
- Equity multiple
- 1.85×
- Total profit
- $45,350
- Equity at exit
- $16,428
Cash invested: $53,200 (down + closing). Projections, not guarantees.
Landlord ↔ Tenant lean methodology
- Overall (STATE)
- 43 Moderately Tenant-Leaning
- State Illinois
- 43 Moderately Tenant-Leaning · D+7
- County
- — inherits STATE
- City
- — inherits STATE
ZIP-level market 61571
- Active inventory
- 129
- Price-to-rent
- 6.9×
Monthly cashflow live
- Estimated rent
- $2,282 medium interval (Pro) →
- Mortgage (P&I)
- −$996
- Tax from tax record
- −$203 /mo · $2,433/yr
- Insurance
- −$79
- HOA
- −$0
- Vacancy / Maint / Mgmt
- −$479
- Net cashflow
- $524
Break-even live
UW: 25.0% down · 7.5% · 30yr · 1.5% tax · 5.0% vac · 8.0% maint · 8.0% mgmt
Financing live
Cash to close
- Down payment
- $47,500
- Closing costs
- $5,700
- Reserves months
- —
- Total cash needed
- —
Loan-product check · same deal, 3 products live
Conventional
25% down · 7.5% · 30yr
- Down + closing
- —
- Monthly P&I
- —
- Monthly cashflow
- —
- DSCR
- —
- Eligible?
- —
Personal DTI + credit; lowest rate.
DSCR
20% down · 8.5% · 30yr
- Down + closing
- —
- Monthly P&I
- —
- Monthly cashflow
- —
- DSCR
- —
- Eligible?
- —
No personal income docs; deal must DSCR.
Hard money
10% down · 12.0% · 12mo
- Down + closing
- —
- Monthly P&I
- —
- Monthly cashflow
- —
- DSCR
- —
- Eligible?
- —
Short-term bridge; refi at stabilization.
Rent comps 4 comps
| Address | Beds | Baths | Sqft | Rent | $/sqft | DOM | Units | Dist |
|---|---|---|---|---|---|---|---|---|
| 114 S Cedar St Washington, IL | 2.0 | 1.0 | 876 | $1,350 | $1.54 | 43d | 1 | 0.72mi |
| 700 Debates St Washington, IL | 3.0 | 2.0 | 1319 | $2,750 | $2.08 | 13d | 1 | 1.23mi |
| 713 Stephanie Ct Washington, IL | 3.0 | 2.0 | 1319 | $2,750 | $2.08 | 20d | 1 | 1.31mi |
| 704 Debates St Washington, IL | 3.0 | 2.0 | 1319 | $2,750 | $2.08 | 13d | 1 | 1.34mi |
Listing history 20 events
-
2026-06-18days on market $190,000 Active 139 DOM
-
2026-06-17days on market $190,000 Active 138 DOM
-
2026-06-16days on market $190,000 Active 137 DOM
-
2026-06-15days on market $190,000 Active 136 DOM
-
2026-06-13days on market $190,000 Active 134 DOM
-
2026-06-12days on market $190,000 Active 133 DOM
-
2026-06-09days on market $190,000 Active 130 DOM
-
2026-06-08days on market $190,000 Active 129 DOM
-
2026-06-07days on market $190,000 Active 128 DOM
-
2026-06-05days on market $190,000 Active 126 DOM
-
2026-06-04days on market $190,000 Active 124 DOM
-
2026-06-02days on market $190,000 Active 123 DOM
-
2026-06-01days on market $190,000 Active 122 DOM
-
2026-05-31days on market $190,000 Active 121 DOM
-
2026-05-31days on market $190,000 Active 120 DOM
-
2026-04-23price $190,000
-
2026-03-10price $199,900
-
2026-01-30$209,900 Active
-
2026-01-22historical $209,900
-
2025-10-09soldstatus $130,000
ⓘ Source: listings_history table (triggers on properties + properties_extension) + one-shot
backfill from property_details.listing_events for pre-trigger history.
Tax reassessment forecast IL · Partial reset (capped growth)
- Current annual tax
- $2,433 · $203/mo
- Projected year-2 tax
- $3,373 · $281/mo
- Expected delta
- +$940/yr (+$78/mo · 38.6%)
ⓘ Screening estimate from a state-policy table — verify with the county assessor before closing.
Climate risk First Street
- Flood 1/10 Low FEMA zone X (unshaded) · 0% chance over 30 yrs
- Wildfire 1/10 Low
- Heat 3/10 Moderate 7 d/yr ≥104°F today · 18 d/yr by 30 yrs out
- Wind 2/10 Low 100% chance of damaging wind over 30 yrs
- Air quality 2/10 Low 1 unhealthy d/yr today · 1 by 30 yrs out
Nearby sold comps map
Loading sold comps map…
Walkable amenities ~0.75 mi
Loading nearby amenities…
Taxation est. · year 1
- Rental income
- $27,384
- − Mortgage interest
- −$10,643
- − Property taxes
- −$2,433
- − Insurance
- −$950
- − Repairs & maintenance
- −$2,191
- − Management
- −$2,191
- − Depreciation
- −$5,527
- Taxable income
- $3,449
- Est. tax owed @ 24.0%
- −$828
- After-tax cash flow
- $5,466/yr
For passive investors: Depreciation is non-cash, so a rental often shows a tax loss while cash-flowing — sheltering income. Rental losses are passive: they offset passive income freely, and up to $25,000/yr can offset ordinary (W-2) income if you actively participate and your MAGI is under $100k (phasing out to $0 by $150k); unused losses carry forward. On sale, claimed depreciation is recaptured at up to 25%, and gains may owe capital-gains tax (a 1031 exchange can defer both). Figures are a year-1 estimate at your 24.0% rate — not tax advice; consult a CPA.
Schools (NCES district)
- District
- Washington Chsd 308
- NCES district ID
- 1740980
- Math proficiency
- 42% ▬ 0.00%
- Reading proficiency
- 42% ▼ -2.00%
- Median HH income
- $66,029
- Composite
- 37.69/100
- National rank
- #4361
- State rank
- #112 of 620 in IL
Livability — Washington
- Score
- 73/100
- State rank
- #272
- US rank
- #5136
Category grades
Schools grade is shown separately in the Schools card above.
Census & demographics
- Census place
- Washington, IL
- City population
- 24,544
- Population (ZIP)
- 24,544
Population outlook (Tazewell County) Hauer SSP2
- Today (2025)
- 131,252 people
- By 2030
- 128,028 · -2.5%
- By 2040
- 120,443 · -8.2%
- By 2050
- 111,872 · -14.8%
- By 2075
- 89,843 · -31.5%
- By 2100
- 66,468 · -49.4%
Race, ethnicity, and origin ACS 2023
- Neighborhood character
- Predominantly White (93%)
- Race & ethnicity
- White 93% Hispanic / Latino 3% Two or more races 3% Asian 1%
- Common ancestry
- Lithuanian 4% Italian 3% Iranian 2%
- Foreign-born
- 2% · Canada, China
- Languages at home
- 97% English-only · Spanish 2%
Political lean MEDSL · Tazewell
- 2024 margin
- Strong R (+26.7) · D 35.8% · R 62.5% · Other 1.8%
- 2008→2024 swing
- -20.6pp toward R · 2008: -6.0pp · 2024: -26.7pp
- All cycles
- 2024: R+26.7 2020: R+25.6 2016: R+28.5 2012: R+17.9 2008: R+6.0
Not yet ingested
- Civics
- —
Market trends
- HPI YoY
- ▼ -135.85%
- Current HPI
- 149.5627
- Rent YoY
- —
- Metro
- —
- State GDP YoY
- ▲ 1.59%
- F500 in state
- 60
Industry mix (Fortune 500 HQ in IL)
| Industry | F500 HQs | Revenue |
|---|---|---|
| Insurance | 4 | $201B |
|
||
| Consumer Goods | 4 | $87B |
|
||
| Industrial Machinery | 3 | $64B |
|
||
| Healthcare | 2 | $55B |
|
||
| Retail / Pharmacy | 1 | $148B |
|
||
| Agriculture / Food | 1 | $86B |
|
||
Price history
+46.2% since first listed5 events — show timeline
- 2026-04-23 Price Changed $190,000 RMLSA as Distributed by MLS Grid
- 2026-03-10 Price Changed $199,900 RMLSA as Distributed by MLS Grid
- 2026-01-30 Listed $209,900 RMLSA as Distributed by MLS Grid
- 2026-01-22 Coming Soon $209,900 RMLSA as Distributed by MLS Grid
- 2025-10-09 Sold (Public Records) $130,000 Public Records
Property tax history
+3.2%/yrLatest (2024): $2,433 · +6.3% YoY. Source: county tax records.
Cash-flow waterfall
monthlySold comps — $/sqft
last 12 mo · ≤1 miLoading sold comps…