514 E13 Sawyer St Unit E13 · Cascade, ID
Flood risk No data
- FEMA flood zone
- —
- Chance of flooding over 30 yrs
- —
- Est. flood insurance / yr
- —
Fire risk No data
- Est. fire insurance / yr
- —
Heat risk No data
- Hot days now (above threshold)
- —
- Hot days in 30 yrs
- —
Wind risk No data
- Chance of severe wind over 30 yrs
- —
Air-quality risk No data
- Unhealthy air days now
- —
- Unhealthy air days in 30 yrs
- —
Risk factors via First Street. Map © Google.
Why this score? — see what drove the C grade
The composite is a weighted blend of 9 inputs, each scored 0–100. Each bar is that input's sub-score; the figure is the points it added to the 100-point composite (weight × sub-score).
- Cash flow +18.5/30.0
- ARV discount +15.0/15.0
- DSCR +5.8/10.0
- 1% rule +5.3/10.0
- Schools +3.7/10.0
- Livability +3.3/5.0
- Rent growth +2.5/5.0
- Condition / age +1.0/5.0
- Appreciation +0.0/10.0
$199,500
🖨 Deal sheet 📄 Offer letter ✓ Due diligence
Listing remarks
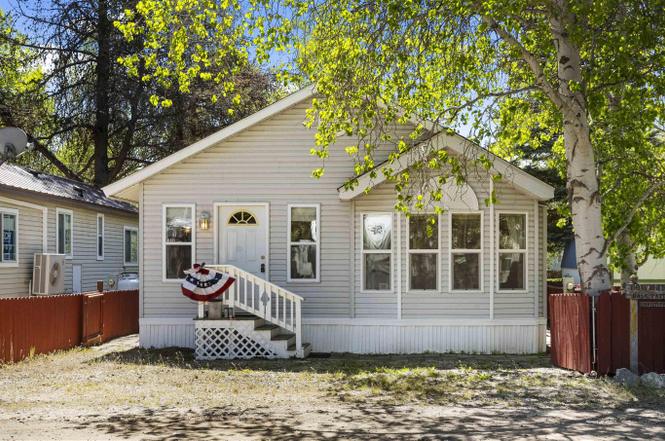
Best Deal in the Park!—without the work! This well-maintained park model home in Leisure Time offers the perfect low-maintenance getaway. With 799 sq ft (including the covered deck), you’ll enjoy both comfort and convenience in this thoughtfully designed space that sleeps six. The 2x6 quality construction addition provides extra room and durability, while central air and forced gas heat (FGH) keep you comfortable year-round. Leisure Time community amenities include a seasonal indoor pool, picnic pavilion, laundry facilities, walking paths, and close proximity to downtown, Cascade Reservoir and the Payette River. E14 lot 35x60ft is also available to purchase with E13. HOA dues c
Key facts
- Picnic pavilion
- Seasonal indoor pool
- Park model home
Tags
Property features AI
Finance
- Other: Located in Leisuretime R.V. Park subdivision; Small lot with irrigation available and manual sprinkler system; Winter access
- Financial info: Annual taxes listed (financial detail excluded per instructions)
- HOA & community: Annual association fee of $660
Exterior
- Parking: Parking details not provided
- Security: No security features listed
- Utilities: Community water service; Sewer connected
- Home design: Single family residence; Built in 1997
- Construction: Frame construction with vinyl siding; Architectural-style roof
- Exterior features: Partial wood fencing; Covered patio/deck; Community pool
Interior
- Kitchen: Microwave; Freestanding oven/range; Gas oven; Refrigerator
- Bedrooms: 1 bedroom (main level)
- Flooring: Carpet; Vinyl sheet
- Bathrooms: 1 bathroom
- Heating & cooling: Forced air heating (natural gas); Central air conditioning
- Interior features: Family room; Great room; Breakfast bar; Pantry; Laminate countertops; Fireplace
- Laundry & utility: Electric water heater
Neighborhood map
What this means for you Summary
Snapshot
- This is a 1-bed/1.0-bath single-family listed at $200k. Condition is rated poor.
Deal economics
- At list price, monthly cash flow is $191 ($2k/yr) — positive.
- The deal already cash-flows at list — no discount required.
- Meets the 1% rule at list price ($2k rent vs $200k).
- Recommended offer: $176k (12.0% below list) — sets the bar for market timing.
- Cap rate 7.4% vs local median 3.6% in Cascade — top-decile yield for the area; either an underpriced asset or a hidden risk that comps aren't pricing in. Stress-test before assuming the spread holds.
Location & tenants
- Location reads 66/100 on livability (#116 in ID) — a middle-class / working-renter tenant base. Strengths: housing A+, cost of living A, crime A-; Watch: employment C-, amenities F, commute F.
- Cascade District (rural): math 35% / reading 45% proficiency, ranked #94 of 133 in ID (top 71%) — families likely to look elsewhere, expect single-tenant / working-renter base with shorter leases.
- Zoned schools: Cascade Elementary School (math 54% / reading 44%, grade D, #148 of 357 statewide, top 47%, 119 students, 33% FRL); Cascade Jr/Sr High School (math 54% / reading 74%, grade B-, #10 of 169 statewide, top 7%, 87 students, 15% FRL).
- Zoned-school proficiency averages 57% at this address vs 40% district-wide (+17 pts) — the actual schools serving this property are materially stronger than the Cascade District average implies; a family-tenant draw the district grade alone would hide.
- Market conditions: 406 active listings in the ZIP; 250 units permitted in Valley County in 2024 (0 in 5+ unit buildings).
Forward outlook
- Local home prices are declining (-3.0%/yr); year-one equity from $1k of loan paydown is wiped out by about $6k of value loss. Plan a longer hold.
- Valley County population projected at +7% by 2050 — modest demand growth; plan on rents tracking national, not racing it.
Negotiation context
- It's been on market 128 days — a 12% lower offer ($176k) is reasonable based on typical stale-listing flexibility.
Questions for the listing agent
- It's been on market 128 days. Have you received any prior offers? Is the seller open to a 12% concession, seller financing, or rate buy-down credit?
- Have any recent inspections been done? Can we get a copy of the seller's disclosures and any deferred-maintenance estimates?
- What does the HOA fee cover, when was the last increase, and are there any pending special assessments or reserve-fund shortfalls?
- Why hasn't it sold? Are there any deal-killer items the seller is aware of (foundation, flood, title, zoning, code violations)?
- Is there a deadline driving the sale (1031 exchange, divorce, estate, relocation)? That informs how much negotiation room exists.
- Schools are D-rated, which usually means shorter tenancies and higher turnover. Who's the typical renter profile here, and what's been the actual vacancy rate?
- What's the average days-on-market for RENTAL listings here right now (not sales)? A rising rental-DOM trend means longer vacancies and softer asking-rent achievability than the comps imply.
- What's the recent tenant-quality profile in this submarket — average credit score on applications, eviction rate, late-payment / NSF rate, and stable-employment percentage? A property-management company in the area should have these aggregated.
- How much new for-sale + rental construction is in the pipeline within 1–3 miles? Heavy new supply typically softens prices + rents 12–24 months out; constrained supply supports both.
Investment metrics
- 1% rule
- 1.03% ✓
- Cap rate
- 7.44%
- Cash-on-cash
- 4.10%
- DSCR
- 1.18
- GRM
- 8.1
CMA / ARV
- ARV (on-the-fly)
- $281,650
- Comps found
- 2
Show comp detail 2 sales within ~0.75 mi
| Address | Dist | Beds/Ba | Sqft | Sold | Price | $/sf | Match |
|---|---|---|---|---|---|---|---|
| 33 B St | 0.23mi | 1/1.0 | 667 (+2%) | 8mo | $177,000 | $265 | 80 |
| 27 & 29 E Street | 0.20mi | 1/1.0 | 638 (-3%) | 13mo | $274,500 | $430 | 76 |
Match score weights: distance 35% · size 25% · config 20% · recency 20%. Top-matched comps best support the ARV.
Projected returns pro-forma
-3.0% appreciation · 3.0% rent growth · sell at horizon
- IRR
- -9.8%
- Equity multiple
- 0.64×
- Total profit
- $-20,094
- Equity at exit
- $29,746
- IRR
- -0.4%
- Equity multiple
- 0.97×
- Total profit
- $-1,566
- Equity at exit
- $17,249
Cash invested: $55,860 (down + closing). Projections, not guarantees.
Landlord ↔ Tenant lean methodology
- Overall (STATE)
- 91 Strongly Landlord-Friendly
- State Idaho
- 91 Strongly Landlord-Friendly · R+18
- County
- — inherits STATE
- City
- — inherits STATE
ZIP-level market 83611
- Home prices YoY
- -27.9%
- Active inventory
- 406
- Price-to-rent
- 8.1×
Monthly cashflow live
- Estimated rent
- $2,057 medium interval (Pro) →
- Mortgage (P&I)
- −$1,046
- Tax est. 1.5%
- −$249 /mo · $2,992/yr
- Insurance
- −$83
- HOA
- −$55
- Vacancy / Maint / Mgmt
- −$432
- Net cashflow
- $191
Break-even live
UW: 25.0% down · 7.5% · 30yr · 1.5% tax · 5.0% vac · 8.0% maint · 8.0% mgmt
Financing live
Cash to close
- Down payment
- $49,875
- Closing costs
- $5,985
- Reserves months
- —
- Total cash needed
- —
Loan-product check · same deal, 3 products live
Conventional
25% down · 7.5% · 30yr
- Down + closing
- —
- Monthly P&I
- —
- Monthly cashflow
- —
- DSCR
- —
- Eligible?
- —
Personal DTI + credit; lowest rate.
DSCR
20% down · 8.5% · 30yr
- Down + closing
- —
- Monthly P&I
- —
- Monthly cashflow
- —
- DSCR
- —
- Eligible?
- —
No personal income docs; deal must DSCR.
Hard money
10% down · 12.0% · 12mo
- Down + closing
- —
- Monthly P&I
- —
- Monthly cashflow
- —
- DSCR
- —
- Eligible?
- —
Short-term bridge; refi at stabilization.
HOA detail
- Monthly dues
- $55 · $660/yr
- Likely covers
- gaspool
Listing history 10 events
-
2026-06-18days on market $199,500 Active 128 DOM
-
2026-06-17days on market $199,500 Active 127 DOM
-
2026-06-16days on market $199,500 Active 126 DOM
-
2026-06-15days on market $199,500 Active 125 DOM
-
2026-06-13days on market $199,500 Active 123 DOM
-
2026-06-12days on market $199,500 Active 122 DOM
-
2026-06-09days on market $199,500 Active 119 DOM
-
2026-06-08days on market $199,500 Active 118 DOM
-
2026-06-07remarks 687-char remark
-
2026-06-07$199,500 Active 117 DOM
ⓘ Source: listings_history table (triggers on properties + properties_extension) + one-shot
backfill from property_details.listing_events for pre-trigger history.
Nearby sold comps map
Loading sold comps map…
Walkable amenities ~0.75 mi
Loading nearby amenities…
Taxation est. · year 1
- Rental income
- $24,680
- − Mortgage interest
- −$11,175
- − Property taxes
- −$2,992
- − Insurance
- −$998
- − Repairs & maintenance
- −$1,974
- − Management
- −$1,974
- − HOA
- −$660
- − Depreciation
- −$5,804
- Taxable loss
- −$898
- Est. tax savings @ 24.0%
- +$215
- After-tax cash flow
- $2,508/yr
For passive investors: Depreciation is non-cash, so a rental often shows a tax loss while cash-flowing — sheltering income. Rental losses are passive: they offset passive income freely, and up to $25,000/yr can offset ordinary (W-2) income if you actively participate and your MAGI is under $100k (phasing out to $0 by $150k); unused losses carry forward. On sale, claimed depreciation is recaptured at up to 25%, and gains may owe capital-gains tax (a 1031 exchange can defer both). Figures are a year-1 estimate at your 24.0% rate — not tax advice; consult a CPA.
Condition & rehab AI · 3 photos
This property is severely damaged by flooding, requiring extensive repairs and rebuilding to restore its structural integrity and curb appeal. Significant investment is needed to make it habitable and marketable.
Repairs flagged
- Major Roof — The independent satellite image shows a large section of the roof is missing or damaged.
- Major Floors and interior walls — The independent satellite image shows the house is underwater, indicating severe water damage to the interior.
- Major HVAC and mechanical systems — The independent satellite image shows the house is underwater, indicating severe water damage to the interior and potential damage to HVAC and mechanical systems.
- Major Landscaping and curb appeal — The listing photo shows the house surrounded by water, indicating severe flood damage and a lack of curb appeal due to the flooding. The independent satellite image shows the house is partially submerged in water, further emphasizing the extent of the damage.
Value-add opportunities
- Both Rebuild the roof and waterproof the interior — Rebuilding the roof and waterproofing the interior will address the major structural and water damage issues, improving both the resale and rental value.
- Both Rebuild the landscaping and curb appeal — Rebuilding the landscaping and curb appeal will improve the home's appearance and increase its marketability for both resale and rental purposes.
Renovation cost estimate screening
| Repair item | Severity | Est. cost |
|---|---|---|
| Roof · The independent satellite image shows a large section of the roof is missing or damaged. | Major | $15,000–50,000 |
| Floors and interior walls · The independent satellite image shows the house is underwater, indicating severe water damage to the interior. | Major | $15,000–50,000 |
| HVAC and mechanical systems · The independent satellite image shows the house is underwater, indicating severe water damage to the interior and potential damage to HVAC and mechanical systems. | Major | $15,000–50,000 |
| Landscaping and curb appeal · The listing photo shows the house surrounded by water, indicating severe flood damage and a lack of curb appeal due to the flooding. The independent satellite image shows the house is partially submerged in water, further emphasizing the extent of the damage. | Major | $15,000–50,000 |
| Total estimated repair cost · 4 items | $60,000–200,000 |
Value-add ROI direction
- Both Rebuild the roof and waterproof the interior — Rebuilding the roof and waterproofing the interior will address the major structural and water damage issues, improving both the resale and rental value. ↑
- Both Rebuild the landscaping and curb appeal — Rebuilding the landscaping and curb appeal will improve the home's appearance and increase its marketability for both resale and rental purposes. ↑
ⓘ Cost ranges are severity-bucket heuristics (US national rule-of-thumb). Get contractor quotes + a written scope before underwriting a rehab budget.
Schools (NCES district)
- District
- Cascade District
- NCES district ID
- 1600630
- Math proficiency
- 35% ▲ 5.00%
- Reading proficiency
- 45% ▬ 0.00%
- Median HH income
- $49,227
- Composite
- 36.83/100
- National rank
- #9162
- State rank
- #94 of 133 in ID
Livability — Cascade
- Score
- 66/100
- State rank
- #116
- US rank
- #12378
Category grades
Schools grade is shown separately in the Schools card above.
Census & demographics
- Census place
- Cascade, ID
- Population (ZIP)
- 2,997
Population outlook (Valley County) Hauer SSP2
- Today (2025)
- 10,964 people
- By 2030
- 11,279 · +2.9%
- By 2040
- 11,584 · +5.7%
- By 2050
- 11,754 · +7.2%
- By 2075
- 12,246 · +11.7%
- By 2100
- 11,948 · +9.0%
Race, ethnicity, and origin ACS 2023
- Neighborhood character
- Predominantly White (91%)
- Race & ethnicity
- White 91% Hispanic / Latino 7% Two or more races 6%
- Hispanic origin (detail)
- Mexican 2%
- Common ancestry
- Slovak 7% Dutch 6% Portuguese 5%
- Foreign-born
- 3% · Canada
- Languages at home
- 95% English-only · Spanish 4%
Political lean MEDSL · Valley
- 2024 margin
- R (+18.6) · D 39.6% · R 58.2% · Other 2.2%
- 2008→2024 swing
- -11.6pp toward R · 2008: -6.9pp · 2024: -18.6pp
- All cycles
- 2024: R+18.6 2020: R+13.7 2016: R+18.6 2012: R+11.6 2008: R+6.9
Not yet ingested
- Civics
- —
Market trends
- HPI YoY
- ▼ -118.61%
- Current HPI
- 307.0117
- Rent YoY
- —
- Metro
- —
- State GDP YoY
- ▲ 4.51%
- F500 in state
- 6
Industry mix (Fortune 500 HQ in ID)
| Industry | F500 HQs | Revenue |
|---|---|---|
| Retail | 1 | $79B |
|
||
| Technology | 1 | $25B |
|
||
| Food / Agriculture | 1 | $6B |
|
||
Price history
-12.9% since first listed4 events — show timeline
- 2026-05-23 Price Changed $199,500 IMLS
- 2026-04-30 Price Changed $218,900 IMLS
- 2026-03-24 Price Changed $218,999 IMLS
- 2026-02-10 Listed $229,000 IMLS
Cash-flow waterfall
monthlySold comps — $/sqft
last 12 mo · ≤1 miLoading sold comps…