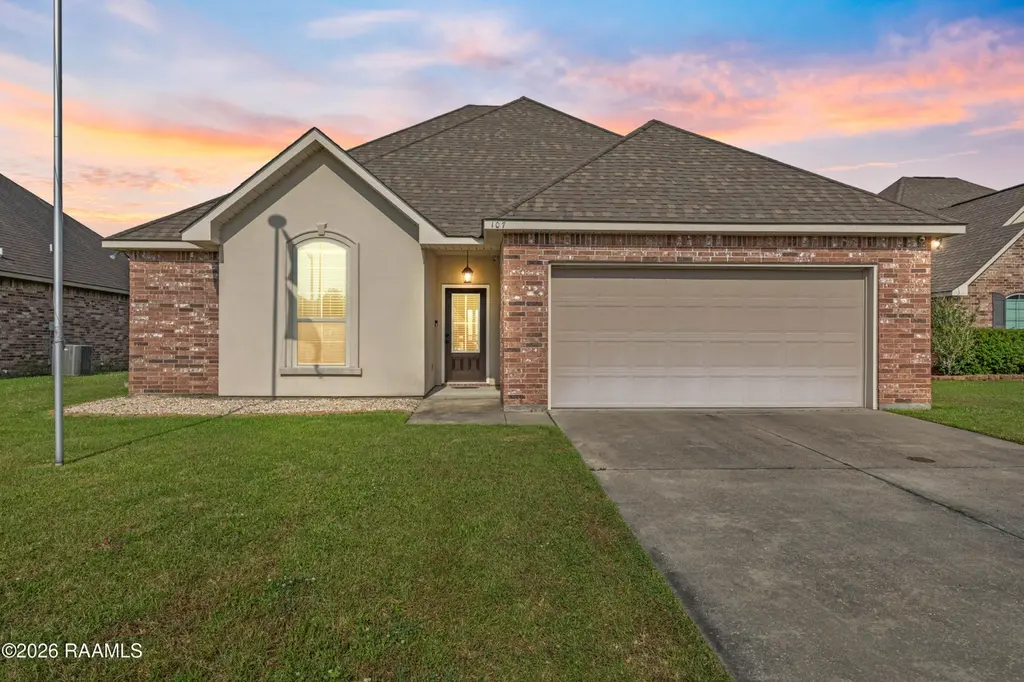
107 Green Mountain Ridge St · Youngsville, LA
Flood risk 3/10 · Minor
- FEMA flood zone
- A
- Chance of flooding over 30 yrs
- 0.2%
- Est. flood insurance / yr
- $1,009 – $1,996
Fire risk 1/10 · Minimal
- Est. fire insurance / yr
- $1,269 – $2,357
Heat risk 9/10 · Severe
- Hot days now (above 108°F)
- 7 days/yr
- Hot days in 30 yrs
- 22 days/yr
Wind risk 9/10 · Severe
- Chance of severe wind over 30 yrs
- 99.0%
Air-quality risk 1/10 · Minimal
- Unhealthy air days now
- 0 days/yr
- Unhealthy air days in 30 yrs
- 0 days/yr
Risk factors via First Street. Map © Google.
Why this score? — see what drove the C grade
The composite is a weighted blend of 9 inputs, each scored 0–100. Each bar is that input's sub-score; the figure is the points it added to the 100-point composite (weight × sub-score).
- Cash flow +17.8/30.0
- ARV discount +15.0/15.0
- DSCR +5.6/10.0
- 1% rule +4.3/10.0
- Livability +3.9/5.0
- Schools +3.6/10.0
- Rent growth +2.9/5.0
- Condition / age +2.5/5.0
- Appreciation +0.0/10.0
$215,000
🖨 Deal sheet 📄 Offer letter ✓ Due diligence
Listing remarks MLS
Own with confidence in Youngsville! This charming home at the end of a peaceful cul-de-sac is move-in ready, with all appliances remaining for the new owners. Forget about power outages! The included whole-house propane generator ensures you'll have comfort all year-round. Don't let the flood zone designation hold you back; this home has a flawless no-flood history and is a great candidate for a possible LOMA. The added bonus of a stunning pond view backyard, this home is sure to check all the boxes! * Back on Market because seller feels ready to move now*
Key facts
- Pond view backyard
- No-flood history
- 6,969 sq ft lot
Tags
Neighborhood map
What this means for you Summary
Snapshot
- This is a 3-bed/2.0-bath single-family listed at $215k.
Deal economics
- At list price, monthly cash flow is $54 ($646/yr) — positive.
- The deal already cash-flows at list — no discount required.
- To meet the 1% rule (rent ≥ 1% of price), the offer needs to be $201k (6.6% below list).
- Recommended offer: $196k (9.0% below list) — sets the bar for market timing.
- Cap rate 7.3% vs local median 4.8% in Youngsville — top-decile yield for the area; either an underpriced asset or a hidden risk that comps aren't pricing in. Stress-test before assuming the spread holds.
Location & tenants
- Location reads 78/100 on livability (#8 in LA, #2,614 nationally) — a middle-class / working-renter tenant base. Strengths: schools A+, employment A+, housing A+; Watch: amenities F, commute F.
- Lafayette Parish (urban): math 38% / reading 46% proficiency, ranked #19 of 98 in LA (top 19%) — families likely to look elsewhere, expect single-tenant / working-renter base with shorter leases.
- Market conditions: Rents rising (+1.6%/yr); 675 active listings in the ZIP; 17 comparable units currently listed for rent nearby; rentals lingering (median 44d on market — plan ~5-8 weeks vacancy on turnover, expect pricing pressure); 65% of comp listings sitting > 30 days — soft ceiling on asking rent; solid renter incomes; 1,585 units permitted in Lafayette Parish in 2024 (10 in 5+ unit buildings).
Forward outlook
- Local home prices are declining (-3.0%/yr); year-one equity from $1k of loan paydown is wiped out by about $6k of value loss. Plan a longer hold.
- Lafayette County population projected at +34% by 2050 — long-run rental-demand tailwind backs the buy-and-hold thesis.
Negotiation context
- It's been on market 117 days — a 9% lower offer ($196k) is reasonable based on typical stale-listing flexibility.
- 7 sale attempts since 14y ago with the ask held roughly flat each time — persistent listings suggest the price (not the market) is what's stuck; bring a comps-based counter.
Risks & watch-outs
- Watch-outs: flood insurance adds $125/mo.
- Climate carrying-cost: in FEMA flood zone A (mandatory federal flood insurance); severe wind risk, 99% chance of damaging wind over 30y; extreme-heat days projected 7→22/yr by 2055 (HVAC capex compounding) — expect insurance premiums to compound above CPI over the hold.
Questions for the listing agent
- It's been on market 117 days. Have you received any prior offers? Is the seller open to a 9% concession, seller financing, or rate buy-down credit?
- What's the actual annual flood-insurance premium (NFIP or private), and is the property in a SFHA with mandatory coverage?
- What does the HOA fee cover, when was the last increase, and are there any pending special assessments or reserve-fund shortfalls?
- Why hasn't it sold? Are there any deal-killer items the seller is aware of (foundation, flood, title, zoning, code violations)?
- Is there a deadline driving the sale (1031 exchange, divorce, estate, relocation)? That informs how much negotiation room exists.
- Schools are A-rated — typically a magnet for longer-tenancy family renters. What's the average tenant stay here, and is there a school-zone premium baked into asking?
- What's the average days-on-market for RENTAL listings here right now (not sales)? A rising rental-DOM trend means longer vacancies and softer asking-rent achievability than the comps imply.
- What's the recent tenant-quality profile in this submarket — average credit score on applications, eviction rate, late-payment / NSF rate, and stable-employment percentage? A property-management company in the area should have these aggregated.
- How much new for-sale + rental construction is in the pipeline within 1–3 miles? Heavy new supply typically softens prices + rents 12–24 months out; constrained supply supports both.
Investment metrics
- 1% rule
- 0.93% ✗
- Cap rate
- 7.29%
- Cash-on-cash
- 3.57%
- DSCR
- 1.16
- GRM
- 8.9
CMA / ARV
- ARV (median comp)
- $268,302
- List price
- $215,000
- Delta
- -19.87%
- Verdict
- UNDERPRICED
- Comps
- 20 within 1.0 mi
Show comp detail 12 sales within ~0.75 mi
| Address | Dist | Beds/Ba | Sqft | Sold | Price | $/sf | Match |
|---|---|---|---|---|---|---|---|
| 103 Sun Ridge St | 0.10mi | 3/2.0 | 1,568 (-3%) | 4mo | $215,000 | $137 | 86 |
| 105 Peak Valley St | 0.20mi | 3/2.0 | 1,564 (-3%) | 7mo | $230,000 | $147 | 79 |
| 511 Flanders Ridge Dr | 0.23mi | 3/2.0 | 1,569 (-3%) | 7mo | $199,000 | $127 | 79 |
| 413 Flanders Ridge Dr | 0.24mi | 3/2.0 | 1,710 (+6%) | 2mo | $245,000 | $143 | 78 |
| 306 Flanders Ridge Dr | 0.26mi | 3/2.0 | 1,710 (+6%) | 4mo | $255,000 | $149 | 75 |
| 107 Hidden Hills Dr | 0.29mi | 3/2.0 | 1,495 (-8%) | 4mo | $225,000 | $151 | 71 |
| 101 Peak Run | 0.13mi | 3/2.0 | 1,387 (-14%) | 6mo | $227,000 | $164 | 65 |
| 206 Green Ridge Dr | 0.30mi | 3/2.0 | 1,461 (-10%) | 6mo | $226,500 | $155 | 65 |
| 307 Oak Hill Ln | 0.64mi | 3/2.0 | 1,655 (+2%) | 3mo | $239,000 | $144 | 64 |
| 202 Clay Ridge Dr | 0.28mi | 3/2.0 | 1,401 (-14%) | 3mo | $232,000 | $166 | 62 |
| 224 Tall Oaks Ln | 0.58mi | 3/2.0 | 1,678 (+4%) | 6mo | $280,000 | $167 | 61 |
| 303 Lahasky Dr | 0.69mi | 3/2.0 | 1,815 (+12%) | 3mo | $295,000 | $163 | 45 |
Match score weights: distance 35% · size 25% · config 20% · recency 20%. Top-matched comps best support the ARV.
Projected returns pro-forma
-3.0% appreciation · 1.65% rent growth · sell at horizon
- IRR
- -16.1%
- Equity multiple
- 0.43×
- Total profit
- $-34,045
- Equity at exit
- $32,057
- IRR
- -10.4%
- Equity multiple
- 0.41×
- Total profit
- $-35,742
- Equity at exit
- $18,589
Cash invested: $60,200 (down + closing). Projections, not guarantees.
Landlord ↔ Tenant lean methodology
- Overall (STATE)
- 90 Strongly Landlord-Friendly
- State Louisiana
- 90 Strongly Landlord-Friendly · R+12
- County
- — inherits STATE
- City
- — inherits STATE
ZIP-level market 70592
- Home prices YoY
- -23.4%
- Rents YoY
- 1.6%
- Active inventory
- 675
- Price-to-rent
- 8.9×
Monthly cashflow live
- Estimated rent
- $2,008 high interval (Pro) →
- Mortgage (P&I)
- −$1,127
- Tax from tax record
- −$161 /mo · $1,934/yr
- Insurance
- −$90
- Flood insurance flood zone
- −$125 /mo · $1,502/yr
- HOA
- −$29
- Vacancy / Maint / Mgmt
- −$422
- Net cashflow
- $54
Break-even live
UW: 25.0% down · 7.5% · 30yr · 1.5% tax · 5.0% vac · 8.0% maint · 8.0% mgmt
Financing live
Cash to close
- Down payment
- $53,750
- Closing costs
- $6,450
- Reserves months
- —
- Total cash needed
- —
Loan-product check · same deal, 3 products live
Conventional
25% down · 7.5% · 30yr
- Down + closing
- —
- Monthly P&I
- —
- Monthly cashflow
- —
- DSCR
- —
- Eligible?
- —
Personal DTI + credit; lowest rate.
DSCR
20% down · 8.5% · 30yr
- Down + closing
- —
- Monthly P&I
- —
- Monthly cashflow
- —
- DSCR
- —
- Eligible?
- —
No personal income docs; deal must DSCR.
Hard money
10% down · 12.0% · 12mo
- Down + closing
- —
- Monthly P&I
- —
- Monthly cashflow
- —
- DSCR
- —
- Eligible?
- —
Short-term bridge; refi at stabilization.
Rent comps 17 comps
| Address | Beds | Baths | Sqft | Rent | $/sqft | DOM | Units | Dist |
|---|---|---|---|---|---|---|---|---|
| 309 Sun Ridge St Youngsville, LA | 3.0 | 2.0 | 1568 | $1,750 | $1.12 | 43d | 1 | 0.18mi |
| 220 Tall Oaks Ln Youngsville, LA | 4.0 | 2.0 | 1885 | $2,200 | $1.17 | 21d | 1 | 0.59mi |
| 210 Revere Dr Youngsville, LA | 3.0 | 2.0 | 1690 | $2,500 | $1.48 | 43d | 1 | 0.88mi |
| 101 Seneca Cir Youngsville, LA | 3.0 | 2.0 | 1640 | $1,900 | $1.16 | 21d | 1 | 0.90mi |
| 139 Iberia St Unit I Youngsville, LA | 3.0 | 3.0 | 1645 | $1,900 | $1.16 | 43d | 1 | 0.95mi |
| 106 Valcour Pl Youngsville, LA | 3.0 | 2.0 | 1495 | $1,950 | $1.30 | 43d | 1 | 1.01mi |
| 104 Field Pt Youngsville, LA | 4.0 | 2.0 | 1700 | $2,500 | $1.47 | 43d | 1 | 1.03mi |
| 204 Benson GRV Youngsville, LA | 4.0 | 2.0 | 1700 | $2,500 | $1.47 | 43d | 1 | 1.03mi |
| 102 Canvasback DR Youngsville, LA | 2.0 | 2.5 | 1305 | $1,900 | $1.46 | 43d | 1 | 1.03mi |
| — Youngsville, LA | 4.0 | 3.0 | 2072 | $2,550 | $1.23 | 43d | 1 | 1.03mi |
| 120 Mayberry Grove ST Youngsville, LA | 2.0 | 2.5 | 1500 | $1,725 | $1.15 | 43d | 1 | 1.03mi |
| 118 Gadwall DR Youngsville, LA | 2.0 | 2.5 | 1334 | $1,700 | $1.27 | 43d | 1 | 1.03mi |
| 204 Romero St Unit C Youngsville, LA | 2.0 | 2.5 | 1202 | $1,650 | $1.37 | 13d | 1 | 1.06mi |
| 205 Jacques St Youngsville, LA | 2.0 | 1.0 | 1100 | $995 | $0.90 | 21d | 1 | 1.09mi |
| 210 Caillou Grove Rd Youngsville, LA | 4.0 | 2.0 | 1961 | $2,100 | $1.07 | 13d | 1 | 1.12mi |
| 540 Guillot Rd Lot E Youngsville, LA | 4.0 | 2.0 | 1280 | $1,265 | $0.99 | 13d | 1 | 1.15mi |
| 110 Fourth St Youngsville, LA | 3.0 | 2.5 | 1700 | $1,800 | $1.06 | 43d | 1 | 1.26mi |
HOA detail
- Monthly dues
- $29 · $348/yr
Listing history 29 events
-
2026-06-18days on market $215,000 Active 117 DOM
-
2026-06-17days on market $215,000 Active 116 DOM
-
2026-06-16days on market $215,000 Active 115 DOM
-
2026-06-15days on market $215,000 Active 114 DOM
-
2026-06-14days on market $215,000 Active 112 DOM
-
2026-06-13days on market $215,000 Active 111 DOM
-
2026-06-10days on market $215,000 Active 109 DOM
-
2026-06-09days on market $215,000 Active 108 DOM
-
2026-06-08days on market $215,000 Active 107 DOM
-
2026-06-07days on market $215,000 Active 106 DOM
-
2026-06-05pricedays on market $215,000 Active 103 DOM
-
2026-06-03days on market $220,000 Active 102 DOM
-
2026-06-02days on market $220,000 Active 101 DOM
-
2026-06-01days on market $220,000 Active 100 DOM
-
2026-05-31days on market $220,000 Active 99 DOM
-
2026-05-30days on market $220,000 Active 98 DOM
-
2026-03-26status Active 562-char remark
Show marketing remark (562 chars)
Own with confidence in Youngsville! This charming home at the end of a peaceful cul-de-sac is move-in ready, with all appliances remaining for the new owners. Forget about power outages! The included whole-house propane generator ensures you'll have comfort all year-round. Don't let the flood zone designation hold you back; this home has a flawless no-flood history and is a great candidate for a possible LOMA. The added bonus of a stunning pond view backyard, this home is sure to check all the boxes! * Back on Market because seller feels ready to move now*
-
2026-01-09$220,000 Active 562-char remark
Show marketing remark (562 chars)
Own with confidence in Youngsville! This charming home at the end of a peaceful cul-de-sac is move-in ready, with all appliances remaining for the new owners. Forget about power outages! The included whole-house propane generator ensures you'll have comfort all year-round. Don't let the flood zone designation hold you back; this home has a flawless no-flood history and is a great candidate for a possible LOMA. The added bonus of a stunning pond view backyard, this home is sure to check all the boxes! * Back on Market because seller feels ready to move now*
-
2025-10-14price $225,000
-
2025-08-04price $235,000
-
2025-06-03status Active
-
2025-04-26$245,000 Active
-
2021-09-17soldstatus $213,000
-
2021-09-17soldstatus $213,000
-
2021-07-29$222,732
-
2015-04-20soldstatus $173,900
-
2014-12-05$173,900
-
2014-11-03soldstatus $36,000
-
2012-07-13$36,000
ⓘ Source: listings_history table (triggers on properties + properties_extension) + one-shot
backfill from property_details.listing_events for pre-trigger history.
Tax reassessment forecast LA · Resets to sale price
- Current annual tax
- $1,934 · $161/mo
- Projected year-2 tax
- $1,934 · $161/mo
- Expected delta
- $0/yr ($0/mo · 0.0%)
ⓘ Screening estimate from a state-policy table — verify with the county assessor before closing.
Climate risk First Street
- Flood 3/10 Moderate FEMA zone A · 20% chance over 30 yrs
- Wildfire 1/10 Low
- Heat 9/10 Extreme 7 d/yr ≥108°F today · 22 d/yr by 30 yrs out
- Wind 9/10 Extreme 99% chance of damaging wind over 30 yrs
- Air quality 1/10 Low 0 unhealthy d/yr today · 0 by 30 yrs out
Nearby sold comps map
Loading sold comps map…
Walkable amenities ~0.75 mi
Loading nearby amenities…
Taxation est. · year 1
- Rental income
- $24,095
- − Mortgage interest
- −$12,043
- − Property taxes
- −$1,934
- − Insurance
- −$2,578
- − Repairs & maintenance
- −$1,928
- − Management
- −$1,928
- − HOA
- −$348
- − Depreciation
- −$6,255
- Taxable loss
- −$2,918
- Est. tax savings @ 24.0%
- +$700
- After-tax cash flow
- $1,346/yr
For passive investors: Depreciation is non-cash, so a rental often shows a tax loss while cash-flowing — sheltering income. Rental losses are passive: they offset passive income freely, and up to $25,000/yr can offset ordinary (W-2) income if you actively participate and your MAGI is under $100k (phasing out to $0 by $150k); unused losses carry forward. On sale, claimed depreciation is recaptured at up to 25%, and gains may owe capital-gains tax (a 1031 exchange can defer both). Figures are a year-1 estimate at your 24.0% rate — not tax advice; consult a CPA.
Schools (NCES district)
- District
- Lafayette Parish
- NCES district ID
- 2200870
- Math proficiency
- 38% ▼ -32.00%
- Reading proficiency
- 46% ▼ -24.00%
- Median HH income
- $50,238
- Composite
- 36.15/100
- National rank
- #4741
- State rank
- #19 of 98 in LA
Livability — Youngsville
- Score
- 78/100
- State rank
- #8
- US rank
- #2614
Category grades
Schools grade is shown separately in the Schools card above.
Census & demographics
- Census place
- Youngsville, LA
- County
- Lafayette Parish · 207,544 people
- City population
- 32,167
- Metro
- Lafayette, LA
- Population (ZIP)
- 32,167
- Household income
- $93,204
- Rent vs Own
- Severe rent burden
- 424.0
Population outlook (Lafayette County) Hauer SSP2
- Today (2025)
- 280,930 people
- By 2030
- 301,092 · +7.2%
- By 2040
- 339,456 · +20.8%
- By 2050
- 375,156 · +33.5%
- By 2075
- 451,672 · +60.8%
- By 2100
- 497,203 · +77.0%
Race, ethnicity, and origin ACS 2023
- Neighborhood character
- Predominantly White (82%)
- Race & ethnicity
- White 82% Black 10% Two or more races 5% Hispanic / Latino 4% Asian 1%
- Common ancestry
- Lithuanian 24% Romanian 3% Italian 1%
- Foreign-born
- 3% · Canada
- Languages at home
- 94% English-only · French/Haitian/Cajun 3% Spanish 2%
Political lean MEDSL · Lafayette
- 2024 margin
- Solid R (+31.4) · D 33.5% · R 64.8% · Other 1.7%
- 2008→2024 swing
- -0.1pp no change · 2008: -31.3pp · 2024: -31.4pp
- All cycles
- 2024: R+31.4 2020: R+28.7 2016: R+33.6 2012: R+33.7 2008: R+31.3
Not yet ingested
- Civics
- —
Market trends
- HPI YoY
- ▼ -41.24%
- Current HPI
- 135.2825
- Rent YoY
- ▲ 1.65%
- Metro
- Lafayette, LA
- State GDP YoY
- ▲ 3.29%
- F500 in state
- 10
Industry mix (Fortune 500 HQ in LA)
| Industry | F500 HQs | Revenue |
|---|---|---|
| Telecommunications | 2 | $23B |
|
||
| Utilities | 1 | $12B |
|
||
| Wholesale / Distribution | 1 | $5B |
|
||
| Advertising | 1 | $2B |
|
||
Price history
+511.1% since first listed13 events — show timeline
- 2026-03-26 Relisted — AcadianaMLS
- 2026-01-09 Listed $220,000 AcadianaMLS
- 2025-10-14 Price Changed $225,000 AcadianaMLS
- 2025-08-04 Price Changed $235,000 AcadianaMLS
- 2025-06-03 Relisted — AcadianaMLS
- 2025-04-26 Listed $245,000 AcadianaMLS
- 2021-09-17 Sold (Public Records) $213,000 Public Records
- 2021-09-17 Sold (MLS) $213,000 AcadianaMLS
- 2021-07-29 Listed $222,732 AcadianaMLS
- 2015-04-20 Sold (MLS) $173,900 AcadianaMLS
- 2014-12-05 Listed $173,900 AcadianaMLS
- 2014-11-03 Sold (MLS) $36,000 AcadianaMLS
- 2012-07-13 Listed $36,000 AcadianaMLS
Property tax history
+12.0%/yrLatest (2025): $1,934 · -1.2% YoY. Source: county tax records.
Cash-flow waterfall
monthlySold comps — $/sqft
last 12 mo · ≤1 miLoading sold comps…