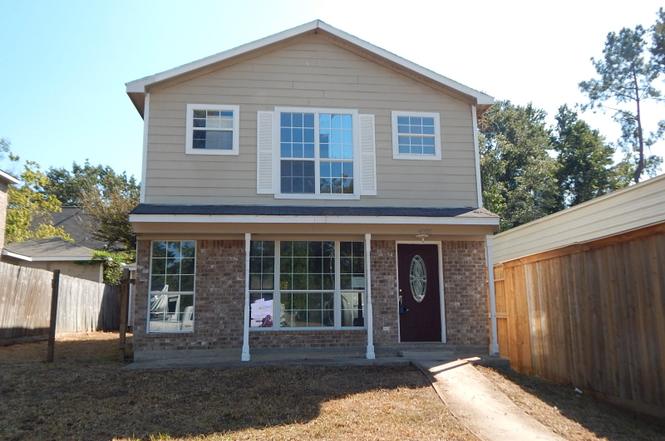
4021 Magnolia Dr · Conroe, TX
Flood risk 4/10 · Minor
- FEMA flood zone
- AE
- Chance of flooding over 30 yrs
- 0.22%
- Est. flood insurance / yr
- $1,737 – $8,500
Fire risk 3/10 · Minor
- Est. fire insurance / yr
- $1,222 – $2,270
Heat risk 9/10 · Severe
- Hot days now (above 111°F)
- 7 days/yr
- Hot days in 30 yrs
- 24 days/yr
Wind risk 8/10 · Major
- Chance of severe wind over 30 yrs
- 99.0%
Air-quality risk 2/10 · Minimal
- Unhealthy air days now
- 2 days/yr
- Unhealthy air days in 30 yrs
- 2 days/yr
Risk factors via First Street. Map © Google.
Why this score? — see what drove the B grade
The composite is a weighted blend of 9 inputs, each scored 0–100. Each bar is that input's sub-score; the figure is the points it added to the 100-point composite (weight × sub-score).
- Cash flow +30.0/30.0
- 1% rule +10.0/10.0
- DSCR +10.0/10.0
- ARV discount +7.5/15.0
- Schools +5.1/10.0
- Livability +3.7/5.0
- Rent growth +3.3/5.0
- Condition / age +2.5/5.0
- Appreciation +0.0/10.0
$129,900
🖨 Deal sheet 📄 Offer letter ✓ Due diligence
Listing remarks
SELLING BY AUCTION, WATCH FOR DATES. Offered by Homesteps - Mosswood 3 bedroom. Charming 2 story with good potential. Island kitchen opens to dining area and views of living room. All bedrooms up. Garage is accessed from rear. River Plantation area. Easy access to I45. Minutes from major shopping, entertainment and the Conroe/Woodlands Medical Center area.
Key facts
- Easy access to i45
- Island kitchen
- Dining area
Tags
Neighborhood map
What this means for you Summary
Snapshot
- This is a 3-bed/2.5-bath single-family listed at $130k.
Deal economics
- At list price, monthly cash flow is $268 ($3k/yr) — positive.
- The deal already cash-flows at list — no discount required.
- Meets the 1% rule at list price ($2k rent vs $130k).
- Recommended offer: $114k (12.0% below list) — sets the bar for market timing.
- Cap rate 12.7% vs local median 3.1% in Conroe — top-decile yield for the area; either an underpriced asset or a hidden risk that comps aren't pricing in. Stress-test before assuming the spread holds.
Location & tenants
- Location reads 74/100 on livability (#169 in TX, #4,447 nationally) — a middle-class / working-renter tenant base. Strengths: cost of living A+, housing A+, amenities B; Watch: commute F, health & safety F.
- Conroe ISD (other): math 57% / reading 57% proficiency, ranked #69 of 826 in TX (top 8%) — acceptable for families but not a draw, mixed tenant base, ~2y average lease.
- Zoned schools: Wilkinson El (math 38% / reading 43%, grade F, #1,490 of 4,322 statewide, top 35%, 944 students, 54% FRL); Conroe H S (math 32% / reading 51%, grade F, #767 of 1,632 statewide, top 47%, 4,915 students, 61% FRL) — zoned schools average 58% FRL vs 34% district-wide (23 pts higher); higher-poverty schools than district average — tighter screening recommended.
- Zoned-school proficiency averages 41% at this address vs 57% district-wide (-16 pts) — the specific schools serving this property underperform the Conroe ISD average; the district grade overstates school quality for this exact location.
- Market conditions: Rents rising (+3.3%/yr); 1111 active listings in the ZIP; 4 comparable units currently listed for rent nearby; rentals leasing fast (median 2d on market — plan ~1-2 weeks tenant-placement turnaround); solid renter incomes; 13,259 units permitted in Montgomery County in 2024 (1,402 in 5+ unit buildings).
- This rent runs 32% of the median local income ($85k/yr) — at the standard rent-burdened threshold; future hikes will face affordability resistance.
Forward outlook
- Local home prices are declining (-3.0%/yr); year-one equity from $898 of loan paydown is wiped out by about $4k of value loss. Plan a longer hold.
- Montgomery County population projected at +65% by 2050 — long-run rental-demand tailwind backs the buy-and-hold thesis.
Negotiation context
- It's been on market 207 days — a 12% lower offer ($114k) is reasonable based on typical stale-listing flexibility.
- 6 sale attempts since 5y ago; this cycle's ask has dropped $50k (28%) from the opening price — seller is motivated, your offer sets the floor, not the list.
Risks & watch-outs
- Watch-outs: property tax is 3.1% of price; flood insurance adds $427/mo.
- Climate carrying-cost: in FEMA flood zone AE (mandatory federal flood insurance); severe wind risk, 99% chance of damaging wind over 30y; extreme-heat days projected 7→24/yr by 2055 (HVAC capex compounding) — expect insurance premiums to compound above CPI over the hold.
Questions for the listing agent
- It's been on market 207 days. Have you received any prior offers? Is the seller open to a 12% concession, seller financing, or rate buy-down credit?
- Property tax is high relative to price — has the assessment been appealed recently, and will the sale trigger a re-assessment?
- What's the actual annual flood-insurance premium (NFIP or private), and is the property in a SFHA with mandatory coverage?
- Why hasn't it sold? Are there any deal-killer items the seller is aware of (foundation, flood, title, zoning, code violations)?
- Is there a deadline driving the sale (1031 exchange, divorce, estate, relocation)? That informs how much negotiation room exists.
- Schools are D-rated, which usually means shorter tenancies and higher turnover. Who's the typical renter profile here, and what's been the actual vacancy rate?
- What's the average days-on-market for RENTAL listings here right now (not sales)? A rising rental-DOM trend means longer vacancies and softer asking-rent achievability than the comps imply.
- What's the recent tenant-quality profile in this submarket — average credit score on applications, eviction rate, late-payment / NSF rate, and stable-employment percentage? A property-management company in the area should have these aggregated.
- How much new for-sale + rental construction is in the pipeline within 1–3 miles? Heavy new supply typically softens prices + rents 12–24 months out; constrained supply supports both.
Investment metrics
- 1% rule
- 1.72% ✓
- Cap rate
- 12.71%
- Cash-on-cash
- 22.92%
- DSCR
- 2.02
- GRM
- 4.8
CMA / ARV
- ARV (on-the-fly)
- $266,112
- Comps found
- 10
Show comp detail 10 sales within ~0.75 mi
| Address | Dist | Beds/Ba | Sqft | Sold | Price | $/sf | Match |
|---|---|---|---|---|---|---|---|
| 4021 Magnolia Dr | 0.00mi | 3/2.5 | 1,584 (0%) | 1mo | $129,900 | $82 | 99 |
| 509 Spruce Dr | 0.02mi | 3/2.5 | 1,518 (-4%) | 12mo | $210,000 | $138 | 82 |
| 589 Mosswood Dr | 0.21mi | 3/2.0 | 1,518 (-4%) | 5mo | $255,000 | $168 | 77 |
| 581 Mosswood Dr | 0.22mi | 3/2.0 | 1,765 (+11%) | 5mo | $279,972 | $159 | 64 |
| 596 Orangewood Dr | 0.12mi | 3/2.0 | 1,726 (+9%) | 20mo | $248,000 | $144 | 61 |
| 3812 Maple Dr | 0.02mi | 3/2.0 | 1,420 (-10%) | 24mo | $259,900 | $183 | 60 |
| 595 Mosswood Dr | 0.21mi | 3/2.0 | 1,777 (+12%) | 11mo | $299,990 | $169 | 59 |
| 642 Durham Dr | 0.72mi | 3/2.0 | 1,635 (+3%) | 2mo | $315,000 | $193 | 57 |
| — | 0.18mi | 4/2.5 (+1) | 1,763 (+11%) | 15mo | $530,000 | $301 | 55 |
| 638 Durham Dr | 0.70mi | 3/2.0 | 1,520 (-4%) | 18mo | $245,000 | $161 | 44 |
Match score weights: distance 35% · size 25% · config 20% · recency 20%. Top-matched comps best support the ARV.
Projected returns pro-forma
-3.0% appreciation · 3.3% rent growth · sell at horizon
- IRR
- -2.1%
- Equity multiple
- 0.92×
- Total profit
- $-2,889
- Equity at exit
- $19,369
- IRR
- 8.4%
- Equity multiple
- 1.66×
- Total profit
- $23,907
- Equity at exit
- $11,231
Cash invested: $36,372 (down + closing). Projections, not guarantees.
Landlord ↔ Tenant lean methodology
- Overall (STATE)
- 87 Strongly Landlord-Friendly
- State Texas
- 87 Strongly Landlord-Friendly · R+5
- County
- — inherits STATE
- City
- — inherits STATE
ZIP-level market 77302
- Rents YoY
- 3.3%
- Active inventory
- 1111
- Price-to-rent
- 4.8×
Monthly cashflow live
- Estimated rent
- $2,235 medium interval (Pro) →
- Mortgage (P&I)
- −$681
- Tax from tax record
- −$336 /mo · $4,029/yr
- Insurance
- −$54
- Flood insurance flood zone
- −$427 /mo · $5,118/yr
- HOA
- −$0
- Vacancy / Maint / Mgmt
- −$469
- Net cashflow
- $268
Break-even live
UW: 25.0% down · 7.5% · 30yr · 1.5% tax · 5.0% vac · 8.0% maint · 8.0% mgmt
Financing live
Cash to close
- Down payment
- $32,475
- Closing costs
- $3,897
- Reserves months
- —
- Total cash needed
- —
Loan-product check · same deal, 3 products live
Conventional
25% down · 7.5% · 30yr
- Down + closing
- —
- Monthly P&I
- —
- Monthly cashflow
- —
- DSCR
- —
- Eligible?
- —
Personal DTI + credit; lowest rate.
DSCR
20% down · 8.5% · 30yr
- Down + closing
- —
- Monthly P&I
- —
- Monthly cashflow
- —
- DSCR
- —
- Eligible?
- —
No personal income docs; deal must DSCR.
Hard money
10% down · 12.0% · 12mo
- Down + closing
- —
- Monthly P&I
- —
- Monthly cashflow
- —
- DSCR
- —
- Eligible?
- —
Short-term bridge; refi at stabilization.
Rent comps 4 comps
| Address | Beds | Baths | Sqft | Rent | $/sqft | DOM | Units | Dist |
|---|---|---|---|---|---|---|---|---|
| 915 Longleaf Ln Conroe, TX | 3.0 | 2.0 | 1767 | $1,975 | $1.12 | 43d | 1 | 1.23mi |
| 245 FM 1488 Rd Conroe, TX | 4.0 | 1.0–3.0 | 1170 | $2,006 | $1.71 | 1d | 48 | 1.34mi |
| 366 FM 1488 Rd Conroe, TX | 1.0–4.0 | 1.0–4.0 | 1251 | $2,356 | $1.88 | 1d | 36 | 1.35mi |
| 541 FM 1488 Rd Conroe, TX | 3.0 | 1.0–2.0 | 869 | $1,663 | $1.91 | 1d | 46 | 1.47mi |
Listing history 28 events
-
2026-04-27status Pending
-
2026-03-16price $129,900
-
2026-03-06price $134,900
-
2026-02-12price $144,900
-
2026-01-21price $159,900
-
2025-12-15price $164,900
-
2025-12-03price $169,900
-
2025-10-02$179,900 Active
-
2025-06-20soldstatus $158,700
-
2023-11-29historical
-
2023-11-15price $209,999
-
2023-10-25price $229,990
-
2023-10-11$239,500 Active
-
2022-03-23price $1,920
-
2022-03-21status Pending
-
2022-03-18status Option Pending
-
2022-03-16historical
-
2022-03-08status Active
-
2022-03-02status Option Pending
-
2022-02-23$223,500 Active
-
2021-06-21soldstatus
-
2021-06-17soldstatus Sold
-
2021-05-27status Pending
-
2021-05-19status Option Pending
-
2021-05-12status Active
-
2021-05-10status Pending
-
2021-04-29status Option Pending
-
2021-04-21$185,000 Active
ⓘ Source: listings_history table (triggers on properties + properties_extension) + one-shot
backfill from property_details.listing_events for pre-trigger history.
Tax reassessment forecast TX · Resets to sale price
- Current annual tax
- $4,029 · $336/mo
- Projected year-2 tax
- $4,029 · $336/mo
- Expected delta
- $0/yr ($0/mo · 0.0%)
ⓘ Screening estimate from a state-policy table — verify with the county assessor before closing.
Climate risk First Street
- Flood 4/10 Moderate FEMA zone AE · 22% chance over 30 yrs
- Wildfire 3/10 Moderate
- Heat 9/10 Extreme 7 d/yr ≥111°F today · 24 d/yr by 30 yrs out
- Wind 8/10 Severe 99% chance of damaging wind over 30 yrs
- Air quality 2/10 Low 2 unhealthy d/yr today · 2 by 30 yrs out
Nearby sold comps map
Loading sold comps map…
Walkable amenities ~0.75 mi
Loading nearby amenities…
Taxation est. · year 1
- Rental income
- $26,823
- − Mortgage interest
- −$7,276
- − Property taxes
- −$4,029
- − Insurance
- −$5,768
- − Repairs & maintenance
- −$2,146
- − Management
- −$2,146
- − Depreciation
- −$3,779
- Taxable income
- $1,679
- Est. tax owed @ 24.0%
- −$403
- After-tax cash flow
- $2,815/yr
For passive investors: Depreciation is non-cash, so a rental often shows a tax loss while cash-flowing — sheltering income. Rental losses are passive: they offset passive income freely, and up to $25,000/yr can offset ordinary (W-2) income if you actively participate and your MAGI is under $100k (phasing out to $0 by $150k); unused losses carry forward. On sale, claimed depreciation is recaptured at up to 25%, and gains may owe capital-gains tax (a 1031 exchange can defer both). Figures are a year-1 estimate at your 24.0% rate — not tax advice; consult a CPA.
Schools (NCES district)
- District
- Conroe ISD
- NCES district ID
- 4815000
- Math proficiency
- 57% ▼ -6.00%
- Reading proficiency
- 57% ▼ -1.00%
- Median HH income
- $71,541
- Composite
- 50.65/100
- National rank
- #1833
- State rank
- #69 of 826 in TX
Livability — Conroe
- Score
- 74/100
- State rank
- #169
- US rank
- #4447
Category grades
Schools grade is shown separately in the Schools card above.
Census & demographics
- County
- Montgomery County · 663,713 people
- City population
- 205,417
- Metro
- Houston-The Woodlands-Sugar Land, TX
- Population (ZIP)
- 21,546
- Household income
- $84,673
- Rent vs Own
- Severe rent burden
- 205.0
Population outlook (Montgomery County) Hauer SSP2
- Today (2025)
- 713,896 people
- By 2030
- 805,263 · +12.8%
- By 2040
- 992,708 · +39.1%
- By 2050
- 1,179,590 · +65.2%
- By 2075
- 1,628,084 · +128.1%
- By 2100
- 1,937,880 · +171.5%
Race, ethnicity, and origin ACS 2023
- Neighborhood character
- Majority White (63%)
- Race & ethnicity
- White 63% Hispanic / Latino 29% Two or more races 19% Black 3% Asian 1%
- Hispanic origin (detail)
- Mexican 26% Puerto Rican 1%
- Common ancestry
- Lithuanian 3% Italian 2% Slovak 2%
- Foreign-born
- 13% · Canada, Vietnam, China
- Languages at home
- 78% English-only · Spanish 20% Russian/Polish/Slavic 1% Other Indo-European 0%
Political lean MEDSL · Montgomery
- 2024 margin
- Solid R (+45.5) · D 26.8% · R 72.3%
- 2008→2024 swing
- +7.2pp toward D · 2008: -52.7pp · 2024: -45.5pp
- All cycles
- 2024: R+45.5 2020: R+43.8 2016: R+51.4 2012: R+60.7 2008: R+52.7
Not yet ingested
- Civics
- —
Market trends
- HPI YoY
- ▼ -187.56%
- Current HPI
- 262.1879
- Rent YoY
- ▲ 3.30%
- Metro
- Houston-The Woodlands-Sugar Land, TX
- State GDP YoY
- ▲ 3.95%
- F500 in state
- 110
Industry mix (Fortune 500 HQ in TX)
| Industry | F500 HQs | Revenue |
|---|---|---|
| Energy | 16 | $1,198B |
|
||
| Technology | 5 | $198B |
|
||
| Engineering / Construction | 4 | $72B |
|
||
| Energy Services | 3 | $60B |
|
||
| Utilities | 3 | $41B |
|
||
| Healthcare | 2 | $330B |
|
||
Price history
-29.8% since first listed28 events — show timeline
- 2026-04-27 Pending — HARMLS
- 2026-03-16 Price Changed $129,900 HARMLS
- 2026-03-06 Price Changed $134,900 HARMLS
- 2026-02-12 Price Changed $144,900 HARMLS
- 2026-01-21 Price Changed $159,900 HARMLS
- 2025-12-15 Price Changed $164,900 HARMLS
- 2025-12-03 Price Changed $169,900 HARMLS
- 2025-10-02 Listed $179,900 HARMLS
- 2025-06-20 Sold (Public Records) $158,700 Public Records
- 2023-11-29 Listing Removed — HARMLS
- 2023-11-15 Price Changed $209,999 HARMLS
- 2023-10-25 Price Changed $229,990 HARMLS
- 2023-10-11 Listed $239,500 HARMLS
- 2022-03-23 Price Changed $1,920 RENT.
- 2022-03-21 Pending — HARMLS
- 2022-03-18 Pending — HARMLS
- 2022-03-16 Listing Removed — HARMLS
- 2022-03-08 Relisted — HARMLS
- 2022-03-02 Pending — HARMLS
- 2022-02-23 Listed $223,500 HARMLS
- 2021-06-21 Sold (Public Records) — Public Records
- 2021-06-17 Sold (MLS) — HARMLS
- 2021-05-27 Pending — HARMLS
- 2021-05-19 Pending — HARMLS
- 2021-05-12 Relisted — HARMLS
- 2021-05-10 Pending — HARMLS
- 2021-04-29 Pending — HARMLS
- 2021-04-21 Listed $185,000 HARMLS
Property tax history
+4.3%/yrLatest (2025): $4,029 · +9.6% YoY. Source: county tax records.
Cash-flow waterfall
monthlySold comps — $/sqft
last 12 mo · ≤1 miLoading sold comps…