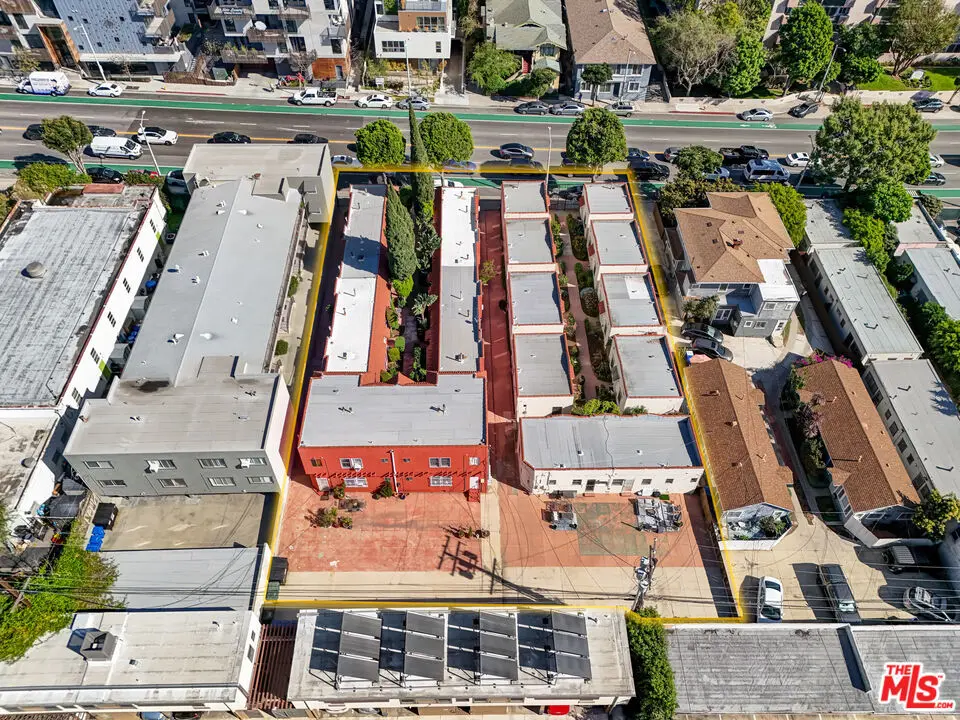
 22-Plex
1229 N Fairfax Ave · West Hollywood, CA
Flood risk 1/10 · Minimal
- FEMA flood zone
- X (unshaded)
- Chance of flooding over 30 yrs
- 0.0%
- Est. flood insurance / yr
- $507 – $1,088
Fire risk 1/10 · Minimal
- Est. fire insurance / yr
- $659 – $1,223
Heat risk 6/10 · Moderate
- Hot days now (above 88°F)
- 7 days/yr
- Hot days in 30 yrs
- 23 days/yr
Wind risk 1/10 · Minimal
- Chance of severe wind over 30 yrs
- —
Air-quality risk 5/10 · Moderate
- Unhealthy air days now
- 7 days/yr
- Unhealthy air days in 30 yrs
- 7 days/yr
Risk factors via First Street. Map © Google.
Why this score? — see what drove the B- grade
The composite is a weighted blend of 9 inputs, each scored 0–100. Each bar is that input's sub-score; the figure is the points it added to the 100-point composite (weight × sub-score).
- Cash flow +30.0/30.0
- DSCR +10.0/10.0
- 1% rule +8.1/10.0
- ARV discount +7.5/15.0
- Schools +3.6/10.0
- Livability +3.5/5.0
- Condition / age +2.5/5.0
- Rent growth +2.1/5.0
- Appreciation +0.0/10.0
$4,500,000
🖨 Deal sheet 📄 Offer letter ✓ Due diligence
Multi-family units
County records classify this as Multi-Family (5+ Unit). Listing-text estimate: 22 units. confirmed
5+ unit building — per-unit beds/baths from public records are typically unavailable; the breakdown below (if shown) is an estimate from the listing text.
Listing remarks MLS
1227-1237 Fairfax Avenue presents a 22-unit multifamily investment opportunity featuring a prominent 1920s-character building with strong street presence and architectural pedigree. Located in a highly desirable, high-demand rental corridor, the asset combines historic charm with meaningful repositioning potential. The property generates solid in-place income at a 12.55 GRM and 4.24% cap rate, equating to approximately $204,545 per unit and $437 per square foot. Significant upside exists through a strategic renovation program designed to enhance interior finishes while preserving the building's vintage character. Situated on a large 21,029-square-foot lot, the property offers additional potential for ADUs and/or the addition of parking in the expansive rear open space (buyer to verify). The oversized parcel further enhances long-term value and optionality. 1227-1237 Fairfax Avenue presents a classic value-add opportunity with substantial rental upside in one of Los Angeles' most sought-after submarkets.
Key facts
- Historic charm
- Large lot
- 0.48 acre lot
Tags
Neighborhood map
What this means for you Summary
Snapshot
- This is a 22 × 18-bed/22.0-bath units multifamily listed at $4.50M.
Deal economics
- At list price, monthly cash flow is $20k ($245k/yr) — positive. Per door: $926/mo.
- The deal already cash-flows at list — no discount required.
- Meets the 1% rule at list price ($59k rent vs $4.50M).
- Recommended offer: $4.09M (9.0% below list) — sets the bar for market timing.
- Cap rate 11.7% vs local median 1.5% in West Hollywood — top-decile yield for the area; either an underpriced asset or a hidden risk that comps aren't pricing in. Stress-test before assuming the spread holds.
Location & tenants
- Location reads 70/100 on livability (#239 in CA) — a middle-class / working-renter tenant base. Strengths: schools A+, amenities A+, commute A+; Watch: health & safety C-, crime F, cost of living F.
- Los Angeles Unified (urban): math 29% / reading 54% proficiency, ranked #223 of 517 in CA (top 43%) — families likely to look elsewhere, expect single-tenant / working-renter base with shorter leases; 67% free/reduced lunch — lower-income household profile, screen leases tightly.
- Market conditions: Rents soft (-1.5%/yr); 334 active listings in the ZIP; solid renter incomes; 19,697 units permitted in Los Angeles County in 2024 (9,426 in 5+ unit buildings).
- At $59,158/mo this rent would consume 738% of the median local household income ($96k/yr) (locally 5563% of renters already pay >50% of income on rent) — very limited rent-growth headroom before tenants either downsize or default.
Forward outlook
- Local home prices are declining (-3.0%/yr); year-one equity from $31k of loan paydown is wiped out by about $135k of value loss. Plan a longer hold.
- Los Angeles County population projected at +9% by 2050 — modest demand growth; plan on rents tracking national, not racing it.
- At projected returns (-3.0% appreciation + 0.0% rent growth), your $1.26M cash investment doubles in ~8 years — after that, you're playing with house money.
Negotiation context
- It's been on market 101 days — a 9% lower offer ($4.09M) is reasonable based on typical stale-listing flexibility.
Risks & watch-outs
- Watch-outs: built in 1923 — expect roof / HVAC / electrical / plumbing capex.
- Climate carrying-cost: extreme-heat days projected 7→23/yr by 2055 (HVAC capex compounding) — expect insurance premiums to compound above CPI over the hold.
Questions for the listing agent
- It's been on market 101 days. Have you received any prior offers? Is the seller open to a 9% concession, seller financing, or rate buy-down credit?
- Can we see the unit-by-unit rent roll, current vacancy, and any below-market leases? What's the average tenancy length?
- What capital expenditures (roof, boiler, parking lot, exteriors) have been made in the last 5 years, and what's planned in the next 2?
- Built in 1923 — when were the roof, HVAC, electrical panel, plumbing, and water heater last replaced?
- Why hasn't it sold? Are there any deal-killer items the seller is aware of (foundation, flood, title, zoning, code violations)?
- Is there a deadline driving the sale (1031 exchange, divorce, estate, relocation)? That informs how much negotiation room exists.
- Schools are A-rated — typically a magnet for longer-tenancy family renters. What's the average tenant stay here, and is there a school-zone premium baked into asking?
- Crime grade is F in this area — have there been break-ins, vandalism, or insurance claims at this property in the last 3 years? What carrier currently insures it and at what premium?
- What's the average days-on-market for RENTAL listings here right now (not sales)? A rising rental-DOM trend means longer vacancies and softer asking-rent achievability than the comps imply.
- What's the recent tenant-quality profile in this submarket — average credit score on applications, eviction rate, late-payment / NSF rate, and stable-employment percentage? A property-management company in the area should have these aggregated.
- How much new apartment / multifamily construction is in the pipeline within 1–3 miles? Heavy new supply (>2% of stock underway) typically softens rents 12–24 months out; light construction supports rent growth.
Investment metrics
- 1% rule
- 1.31% ✓
- Cap rate
- 11.73%
- Cash-on-cash
- 19.41%
- DSCR
- 1.86
- GRM
- 6.3
CMA / ARV
- ARV (median comp)
- $2,835,000
- List price
- $4,500,000
- Delta
- 58.73%
- Verdict
- OVERPRICED
- Comps
- 20 within 1.0 mi
Projected returns pro-forma
-3.0% appreciation · 0.0% rent growth · sell at horizon
- IRR
- 8.2%
- Equity multiple
- 1.31×
- Total profit
- $393,507
- Equity at exit
- $670,965
- IRR
- 15.0%
- Equity multiple
- 2.06×
- Total profit
- $1,335,939
- Equity at exit
- $389,078
Cash invested: $1,260,000 (down + closing). Projections, not guarantees.
Landlord ↔ Tenant lean methodology
- Overall (STATE)
- 18 Strongly Tenant-Friendly
- State California
- 18 Strongly Tenant-Friendly · D+13
- County
- — inherits STATE
- City
- — inherits STATE
ZIP-level market 90046
- Rents YoY
- -1.5%
- Active inventory
- 334
- Price-to-rent
- 139.5×
Monthly cashflow live
- Estimated rent
- $59,158 medium interval (Pro) →
- Mortgage (P&I)
- −$23,598
- Tax from tax record
- −$880 /mo · $10,561/yr
- Insurance
- −$1,875
- HOA
- −$0
- Vacancy / Maint / Mgmt
- −$12,423
- Net cashflow
- $20,381
Break-even live
22-unit breakdown (identical units grouped — click to expand)
| Units | Beds | Baths | Est. rent |
|---|---|---|---|
| 22× units | 18 | 22 | $59,158 |
| #1 | 18 | 22 | $2,689 |
| #2 | 18 | 22 | $2,689 |
| #3 | 18 | 22 | $2,689 |
| #4 | 18 | 22 | $2,689 |
| #5 | 18 | 22 | $2,689 |
| #6 | 18 | 22 | $2,689 |
| #7 | 18 | 22 | $2,689 |
| #8 | 18 | 22 | $2,689 |
| #9 | 18 | 22 | $2,689 |
| #10 | 18 | 22 | $2,689 |
| #11 | 18 | 22 | $2,689 |
| #12 | 18 | 22 | $2,689 |
| #13 | 18 | 22 | $2,689 |
| #14 | 18 | 22 | $2,689 |
| #15 | 18 | 22 | $2,689 |
| #16 | 18 | 22 | $2,689 |
| #17 | 18 | 22 | $2,689 |
| #18 | 18 | 22 | $2,689 |
| #19 | 18 | 22 | $2,689 |
| #20 | 18 | 22 | $2,689 |
| #21 | 18 | 22 | $2,689 |
| #22 | 18 | 22 | $2,689 |
| Total (22 units) | $59,158 | ||
UW: 25.0% down · 7.5% · 30yr · 1.5% tax · 5.0% vac · 8.0% maint · 8.0% mgmt
Financing live
Cash to close
- Down payment
- $1,125,000
- Closing costs
- $135,000
- Reserves months
- —
- Total cash needed
- —
Loan-product check · same deal, 3 products live
Conventional
25% down · 7.5% · 30yr
- Down + closing
- —
- Monthly P&I
- —
- Monthly cashflow
- —
- DSCR
- —
- Eligible?
- —
Personal DTI + credit; lowest rate.
DSCR
20% down · 8.5% · 30yr
- Down + closing
- —
- Monthly P&I
- —
- Monthly cashflow
- —
- DSCR
- —
- Eligible?
- —
No personal income docs; deal must DSCR.
Hard money
10% down · 12.0% · 12mo
- Down + closing
- —
- Monthly P&I
- —
- Monthly cashflow
- —
- DSCR
- —
- Eligible?
- —
Short-term bridge; refi at stabilization.
Listing history 14 events
-
2026-06-18days on market $4,500,000 Active 101 DOM
-
2026-06-17days on market $4,500,000 Active 100 DOM
-
2026-06-16days on market $4,500,000 Active 99 DOM
-
2026-06-15days on market $4,500,000 Active 98 DOM
-
2026-06-13days on market $4,500,000 Active 96 DOM
-
2026-06-09days on market $4,500,000 Active 92 DOM
-
2026-06-08days on market $4,500,000 Active 91 DOM
-
2026-06-07days on market $4,500,000 Active 90 DOM
-
2026-06-04days on market $4,500,000 Active 87 DOM
-
2026-06-03days on market $4,500,000 Active 86 DOM
-
2026-06-02days on market $4,500,000 Active 85 DOM
-
2026-06-01days on market $4,500,000 Active 84 DOM
-
2026-05-31days on market $4,500,000 Active 83 DOM
-
2026-03-09$4,500,000 Active 1018-char remark
Show marketing remark (1018 chars)
1227-1237 Fairfax Avenue presents a 22-unit multifamily investment opportunity featuring a prominent 1920s-character building with strong street presence and architectural pedigree. Located in a highly desirable, high-demand rental corridor, the asset combines historic charm with meaningful repositioning potential. The property generates solid in-place income at a 12.55 GRM and 4.24% cap rate, equating to approximately $204,545 per unit and $437 per square foot. Significant upside exists through a strategic renovation program designed to enhance interior finishes while preserving the building's vintage character. Situated on a large 21,029-square-foot lot, the property offers additional potential for ADUs and/or the addition of parking in the expansive rear open space (buyer to verify). The oversized parcel further enhances long-term value and optionality. 1227-1237 Fairfax Avenue presents a classic value-add opportunity with substantial rental upside in one of Los Angeles' most sought-after submarkets.
ⓘ Source: listings_history table (triggers on properties + properties_extension) + one-shot
backfill from property_details.listing_events for pre-trigger history.
Tax reassessment forecast CA · Resets to sale price
- Current annual tax
- $10,561 · $880/mo
- Projected year-2 tax
- $34,200 · $2,850/mo
- Expected delta
- +$23,639/yr (+$1,970/mo · 223.8%)
ⓘ Screening estimate from a state-policy table — verify with the county assessor before closing.
Climate risk First Street
- Flood 1/10 Low FEMA zone X (unshaded) · 0% chance over 30 yrs
- Wildfire 1/10 Low
- Heat 6/10 Major 7 d/yr ≥88°F today · 23 d/yr by 30 yrs out
- Wind 1/10 Low
- Air quality 5/10 Major 7 unhealthy d/yr today · 7 by 30 yrs out
Nearby sold comps map
Loading sold comps map…
Walkable amenities ~0.75 mi
Loading nearby amenities…
Taxation est. · year 1
- Rental income
- $709,896
- − Mortgage interest
- −$252,070
- − Property taxes
- −$10,561
- − Insurance
- −$22,500
- − Repairs & maintenance
- −$56,792
- − Management
- −$56,792
- − Depreciation
- −$130,909
- Taxable income
- $180,273
- Est. tax owed @ 24.0%
- −$43,265
- After-tax cash flow
- $201,310/yr
For passive investors: Depreciation is non-cash, so a rental often shows a tax loss while cash-flowing — sheltering income. Rental losses are passive: they offset passive income freely, and up to $25,000/yr can offset ordinary (W-2) income if you actively participate and your MAGI is under $100k (phasing out to $0 by $150k); unused losses carry forward. On sale, claimed depreciation is recaptured at up to 25%, and gains may owe capital-gains tax (a 1031 exchange can defer both). Figures are a year-1 estimate at your 24.0% rate — not tax advice; consult a CPA.
Schools (NCES district)
- District
- Los Angeles Unified
- NCES district ID
- 0622710
- Math proficiency
- 29% ▼ -4.00%
- Reading proficiency
- 54% ▲ 10.00%
- Median HH income
- $50,403
- Composite
- 35.67/100
- National rank
- #4875
- State rank
- #223 of 517 in CA
Livability — West Hollywood
- Score
- 70/100
- State rank
- #239
- US rank
- #7852
Category grades
Schools grade is shown separately in the Schools card above.
Census & demographics
- Census place
- West Hollywood, CA
- County
- Los Angeles County · 9,444,647 people
- City population
- 20,961
- Metro
- Los Angeles-Long Beach-Anaheim, CA
- Population (ZIP)
- 48,296
- Household income
- $96,250
- Rent vs Own
- Severe rent burden
- 5563.0
Population outlook (Los Angeles County) Hauer SSP2
- Today (2025)
- 10,940,515 people
- By 2030
- 11,256,481 · +2.9%
- By 2040
- 11,729,929 · +7.2%
- By 2050
- 11,948,407 · +9.2%
- By 2075
- 11,818,114 · +8.0%
- By 2100
- 10,842,928 · -0.9%
Race, ethnicity, and origin ACS 2023
- Neighborhood character
- Majority White (65%)
- Race & ethnicity
- White 65% Hispanic / Latino 16% Two or more races 13% Asian 7% Black 5%
- Hispanic origin (detail)
- Mexican 8% Puerto Rican 1%
- Common ancestry
- Scotch-Irish 6% Lithuanian 4% Romanian 4%
- Foreign-born
- 26% · Canada, China, South Korea
- Languages at home
- 71% English-only · Spanish 9% Russian/Polish/Slavic 8% Other Indo-European 3%
Political lean MEDSL · Los Angeles
- 2024 margin
- Solid D (+32.9) · D 64.8% · R 31.9% · Other 3.3%
- 2008→2024 swing
- -7.4pp toward R · 2008: 40.4pp · 2024: 32.9pp
- All cycles
- 2024: D+32.9 2020: D+44.2 2016: D+48.0 2012: D+40.0 2008: D+40.4
Not yet ingested
- Civics
- —
Market trends
- HPI YoY
- ▼ -571.28%
- Current HPI
- 365.8036
- Rent YoY
- ▼ -1.48%
- Metro
- Los Angeles-Long Beach-Anaheim, CA
- State GDP YoY
- ▲ 3.21%
- F500 in state
- 116
Industry mix (Fortune 500 HQ in CA)
| Industry | F500 HQs | Revenue |
|---|---|---|
| Technology | 27 | $1,492B |
|
||
| Financial Services | 3 | $174B |
|
||
| Retail | 3 | $44B |
|
||
| Insurance | 3 | $26B |
|
||
| Media / Entertainment | 2 | $115B |
|
||
| Pharmaceuticals / Biotech | 2 | $62B |
|
||
Price history
1 event — show timeline
- 2026-03-09 Listed $4,500,000 TheMLS
Property tax history
+1.8%/yrLatest (2025): $10,561 · +3.0% YoY. Source: county tax records.
Cash-flow waterfall
monthlySold comps — $/sqft
last 12 mo · ≤1 miLoading sold comps…