3538 NW 21st St · Cape Coral, FL
Flood risk 8/10 · Major
- FEMA flood zone
- X (shaded)
- Chance of flooding over 30 yrs
- 0.99%
- Est. flood insurance / yr
- $507 – $1,088
Fire risk 2/10 · Minimal
- Est. fire insurance / yr
- $947 – $1,759
Heat risk 10/10 · Severe
- Hot days now (above 107°F)
- 7 days/yr
- Hot days in 30 yrs
- 31 days/yr
Wind risk 10/10 · Severe
- Chance of severe wind over 30 yrs
- 99.0%
Air-quality risk 2/10 · Minimal
- Unhealthy air days now
- 1 days/yr
- Unhealthy air days in 30 yrs
- 1 days/yr
Risk factors via First Street. Map © Google.
Why this score? — see what drove the B- grade
The composite is a weighted blend of 9 inputs, each scored 0–100. Each bar is that input's sub-score; the figure is the points it added to the 100-point composite (weight × sub-score).
- Cash flow +30.0/30.0
- DSCR +10.0/10.0
- 1% rule +8.5/10.0
- ARV discount +7.5/15.0
- Schools +4.1/10.0
- Livability +3.9/5.0
- Condition / age +2.5/5.0
- Rent growth +1.1/5.0
- Appreciation +0.0/10.0
$190,000
🖨 Deal sheet 📄 Offer letter ✓ Due diligence
Listing remarks MLS
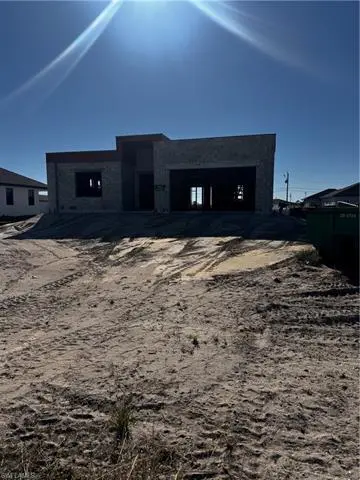
Cleared lot and ready to built, surrounded by beautiful new construction and gulf access homes. Close to Burnt Store Marina, Coral Oaks Golf Course, and more. Build here your forever home or buy as an Investment. No owls or tortoises restriction on this lot is a plus. Survey, approved site plan, septic system permit, and truss layout available. Don't miss this opportunity!
Key facts
- Outdoor recreation
- 0.23 acre lot
- 2 garage spots
Tags
Property features AI
Finance
- Other: Zoning: R1-D; Lot dimensions approximately 125' front/back by 80' sides (total area listed as 0.23 acres); Restrictions: No RV, No truck; Single unit, single-floor building
- HOA & community: Non-gated community; No HOA maintenance; No community amenities
Exterior
- Parking: Attached 2-car garage
- Utilities: Well water; Septic sewer
- Home design: Single-family residential; 1 story / ranch; Rear of property faces south; Located in the Cape Coral development
- Construction: Concrete block construction; Built in 2026
- Exterior features: Stucco exterior; Shingle roof; Storm protection described in remarks; Windows described in remarks; Paved road access; Regular lot
Interior
- Kitchen: Eat-in kitchen
- Bedrooms: 4 bedrooms
- Bathrooms: 3 full bathrooms; No master bath (listed as none)
- Interior features: Dining areas include family dining, formal living dining, and an eat-in kitchen; Split bedroom floor plan; Unfurnished; See remarks for additional interior details
Neighborhood map
What this means for you Summary
Snapshot
- This is a 4-bed/3.0-bath land listed at $190k.
Deal economics
- At list price, monthly cash flow is $773 ($9k/yr) — positive.
- The deal already cash-flows at list — no discount required.
- Meets the 1% rule at list price ($3k rent vs $190k).
- Recommended offer: $179k (6.0% below list) — sets the bar for market timing.
- Cap rate 11.6% vs local median 3.1% in Cape Coral — top-decile yield for the area; either an underpriced asset or a hidden risk that comps aren't pricing in. Stress-test before assuming the spread holds.
Location & tenants
- Location reads 77/100 on livability (#208 in FL, #3,098 nationally) — a middle-class / working-renter tenant base. Strengths: housing A+, health & safety A+, amenities B+; Watch: commute F.
- Lee (suburban): math 47% / reading 50% proficiency, ranked #42 of 73 in FL (top 58%) — families likely to look elsewhere, expect single-tenant / working-renter base with shorter leases.
- Market conditions: Rents falling (-5.5%/yr); 2652 active listings in the ZIP; 23 comparable units currently listed for rent nearby; rentals at typical pace (median 16d on market — plan ~3-4 weeks tenant-placement turnaround); solid renter incomes; 15,411 units permitted in Lee County in 2024 (4,686 in 5+ unit buildings).
- This rent runs 34% of the median local income ($91k/yr) — at the standard rent-burdened threshold; future hikes will face affordability resistance.
Forward outlook
- Local home prices are declining (-3.0%/yr); year-one equity from $1k of loan paydown is wiped out by about $6k of value loss. Plan a longer hold.
- Lee County population projected at +44% by 2050 — long-run rental-demand tailwind backs the buy-and-hold thesis.
- At projected returns (-3.0% appreciation + 0.0% rent growth), your $53k cash investment doubles in ~10 years — after that, you're playing with house money.
Negotiation context
- It's been on market 86 days — a 6% lower offer ($179k) is reasonable based on typical stale-listing flexibility.
- 3 sale attempts since 5y ago; this cycle's ask has dropped $20k (10%) from the opening price — seller is motivated, your offer sets the floor, not the list.
Risks & watch-outs
- Watch-outs: flood insurance adds $66/mo.
- Climate carrying-cost: severe flood risk; severe wind risk, 99% chance of damaging wind over 30y; extreme-heat days projected 7→31/yr by 2055 (HVAC capex compounding) — expect insurance premiums to compound above CPI over the hold.
Questions for the listing agent
- It's been on market 86 days. Have you received any prior offers? Is the seller open to a 6% concession, seller financing, or rate buy-down credit?
- What's the actual annual flood-insurance premium (NFIP or private), and is the property in a SFHA with mandatory coverage?
- Why hasn't it sold? Are there any deal-killer items the seller is aware of (foundation, flood, title, zoning, code violations)?
- Is there a deadline driving the sale (1031 exchange, divorce, estate, relocation)? That informs how much negotiation room exists.
- Schools are B-rated — typically a magnet for longer-tenancy family renters. What's the average tenant stay here, and is there a school-zone premium baked into asking?
- What's the average days-on-market for RENTAL listings here right now (not sales)? A rising rental-DOM trend means longer vacancies and softer asking-rent achievability than the comps imply.
- What's the recent tenant-quality profile in this submarket — average credit score on applications, eviction rate, late-payment / NSF rate, and stable-employment percentage? A property-management company in the area should have these aggregated.
- How much new for-sale + rental construction is in the pipeline within 1–3 miles? Heavy new supply typically softens prices + rents 12–24 months out; constrained supply supports both.
Investment metrics
- 1% rule
- 1.35% ✓
- Cap rate
- 11.59%
- Cash-on-cash
- 18.93%
- DSCR
- 1.84
- GRM
- 6.2
CMA / ARV
No comps found within radius.
Projected returns pro-forma
-3.0% appreciation · 0.0% rent growth · sell at horizon
- IRR
- 5.5%
- Equity multiple
- 1.21×
- Total profit
- $10,926
- Equity at exit
- $28,330
- IRR
- 12.1%
- Equity multiple
- 1.83×
- Total profit
- $43,915
- Equity at exit
- $16,428
Cash invested: $53,200 (down + closing). Projections, not guarantees.
Landlord ↔ Tenant lean methodology
- Overall (STATE)
- 87 Strongly Landlord-Friendly
- State Florida
- 87 Strongly Landlord-Friendly · R+3
- County
- — inherits STATE
- City
- — inherits STATE
ZIP-level market 33993
- Home prices YoY
- -14.1%
- Rents YoY
- -5.5%
- Active inventory
- 2652
- Price-to-rent
- 6.2×
Monthly cashflow live
- Estimated rent
- $2,557 high interval (Pro) →
- Mortgage (P&I)
- −$996
- Tax from tax record
- −$105 /mo · $1,262/yr
- Insurance
- −$79
- Flood insurance flood zone
- −$66 /mo · $798/yr
- HOA
- −$0
- Vacancy / Maint / Mgmt
- −$537
- Net cashflow
- $773
Break-even live
UW: 25.0% down · 7.5% · 30yr · 1.5% tax · 5.0% vac · 8.0% maint · 8.0% mgmt
Financing live
Cash to close
- Down payment
- $47,500
- Closing costs
- $5,700
- Reserves months
- —
- Total cash needed
- —
Loan-product check · same deal, 3 products live
Conventional
25% down · 7.5% · 30yr
- Down + closing
- —
- Monthly P&I
- —
- Monthly cashflow
- —
- DSCR
- —
- Eligible?
- —
Personal DTI + credit; lowest rate.
DSCR
20% down · 8.5% · 30yr
- Down + closing
- —
- Monthly P&I
- —
- Monthly cashflow
- —
- DSCR
- —
- Eligible?
- —
No personal income docs; deal must DSCR.
Hard money
10% down · 12.0% · 12mo
- Down + closing
- —
- Monthly P&I
- —
- Monthly cashflow
- —
- DSCR
- —
- Eligible?
- —
Short-term bridge; refi at stabilization.
Rent comps 23 comps
| Address | Beds | Baths | Sqft | Rent | $/sqft | DOM | Units | Dist |
|---|---|---|---|---|---|---|---|---|
| 2325 NW 34th Ave Cape Coral, FL | 4.0 | 2.0 | 1828 | $1,796 | $0.98 | 3d | 1 | 0.47mi |
| 2113 NW 41st Ave Cape Coral, FL | 4.0 | 3.0 | 1904 | $2,200 | $1.16 | 3d | 1 | 0.61mi |
| 1521 NW 37th Ave Cape Coral, FL | 3.0 | 3.0 | 2000 | $2,700 | $1.35 | 23d | 1 | 0.63mi |
| 4116 NW 20th St Cape Coral, FL | 4.0 | 3.0 | 2506 | $2,200 | $0.88 | 10d | 1 | 0.66mi |
| 4116 NW 20th Ter Cape Coral, FL | 4.0 | 3.0 | 1904 | $2,200 | $1.16 | 10d | 1 | 0.66mi |
| 2127 NW 41st Pl Cape Coral, FL | 4.0 | 2.0 | 1828 | $1,876 | $1.03 | 3d | 1 | 0.69mi |
| 4113 Kismet Pkwy Cape Coral, FL | 4.0 | 3.0 | 1816 | $2,300 | $1.27 | 3d | 1 | 0.82mi |
| 1255 NW 38th Ave Cape Coral, FL | 3.0 | 3.0 | 2219 | $6,500 | $2.93 | 23d | 1 | 0.87mi |
| 4102 NW 26th St Cape Coral, FL | 5.0 | 3.0 | 2561 | $3,100 | $1.21 | 15d | 1 | 0.94mi |
| 1220 NW 36th Pl Cape Coral, FL | 3.0 | 2.0 | 1468 | $1,995 | $1.36 | 13d | 1 | 0.97mi |
| 2532 NW 31st Ave Cape Coral, FL | 3.0 | 2.0 | 1750 | $2,400 | $1.37 | 23d | 1 | 1.02mi |
| 1221 NW 33rd Ave Cape Coral, FL | 3.0 | 2.0 | 2035 | $3,995 | $1.96 | 15d | 1 | 1.05mi |
| 1049 NW 38th Pl Cape Coral, FL | 3.0 | 2.0 | 2009 | $4,570 | $2.27 | 23d | 1 | 1.12mi |
| 2812 NW 25th St Cape Coral, FL | 4.0 | 2.0 | 1657 | $1,950 | $1.18 | 23d | 1 | 1.14mi |
| 2726 NW 41st Pl Cape Coral, FL | 4.0 | 3.0 | 1904 | $2,200 | $1.16 | 3d | 1 | 1.15mi |
| 2928 NW 27th St Cape Coral, FL | 4.0 | 2.0 | 1853 | $1,999 | $1.08 | 21d | 1 | 1.18mi |
| 2928 NW 27th St Cape Coral, FL | 4.0 | 2.0 | 1853 | $1,999 | $1.08 | 23d | 1 | 1.18mi |
| 2800 NW 25th Ter Cape Coral, FL | 3.0 | 2.0 | 1469 | $2,000 | $1.36 | 3d | 1 | 1.21mi |
| 2302 NW 27th Ave Cape Coral, FL | 3.0 | 2.0 | 2136 | $1,691 | $0.79 | 21d | 1 | 1.24mi |
| 2329 NW 27th Ave Cape Coral, FL | 3.0 | 2.0 | 1761 | $2,300 | $1.31 | 15d | 1 | 1.27mi |
| 2001 NW 25th Ave Cape Coral, FL | 3.0 | 2.0 | 1887 | $2,500 | $1.32 | 23d | 1 | 1.44mi |
| 1119 NW 28th Pl Cape Coral, FL | 3.0 | 3.0 | 2047 | $2,400 | $1.17 | 23d | 1 | 1.45mi |
| 825 NW 38th Pl Cape Coral, FL | 4.0 | 3.0 | 2594 | $2,699 | $1.04 | 23d | 1 | 1.47mi |
Listing history 30 events
-
2026-06-17days on market $190,000 Active 86 DOM
-
2026-06-16days on market $190,000 Active 85 DOM
-
2026-06-15days on market $190,000 Active 84 DOM
-
2026-06-13days on market $190,000 Active 82 DOM
-
2026-06-10days on market $190,000 Active 79 DOM
-
2026-06-09days on market $190,000 Active 78 DOM
-
2026-06-07days on market $190,000 Active 76 DOM
-
2026-06-03days on market $190,000 Active 72 DOM
-
2026-06-02days on market $190,000 Active 71 DOM
-
2026-06-01days on market $190,000 Active 70 DOM
-
2026-06-01days on market $190,000 Active 69 DOM
-
2026-04-28price $190,000
-
2026-03-23$210,000 Active
-
2024-03-12soldstatus $771,286
-
2024-03-08soldstatus $57,000 Closed 375-char remark
Show marketing remark (375 chars)
Cleared lot and ready to built, surrounded by beautiful new construction and gulf access homes. Close to Burnt Store Marina, Coral Oaks Golf Course, and more. Build here your forever home or buy as an Investment. No owls or tortoises restriction on this lot is a plus. Survey, approved site plan, septic system permit, and truss layout available. Don't miss this opportunity!
-
2024-02-15status Pending 375-char remark
Show marketing remark (375 chars)
Cleared lot and ready to built, surrounded by beautiful new construction and gulf access homes. Close to Burnt Store Marina, Coral Oaks Golf Course, and more. Build here your forever home or buy as an Investment. No owls or tortoises restriction on this lot is a plus. Survey, approved site plan, septic system permit, and truss layout available. Don't miss this opportunity!
-
2024-02-10price $60,000 375-char remark
Show marketing remark (375 chars)
Cleared lot and ready to built, surrounded by beautiful new construction and gulf access homes. Close to Burnt Store Marina, Coral Oaks Golf Course, and more. Build here your forever home or buy as an Investment. No owls or tortoises restriction on this lot is a plus. Survey, approved site plan, septic system permit, and truss layout available. Don't miss this opportunity!
-
2024-01-26$53,900 Active 375-char remark
Show marketing remark (375 chars)
Cleared lot and ready to built, surrounded by beautiful new construction and gulf access homes. Close to Burnt Store Marina, Coral Oaks Golf Course, and more. Build here your forever home or buy as an Investment. No owls or tortoises restriction on this lot is a plus. Survey, approved site plan, septic system permit, and truss layout available. Don't miss this opportunity!
-
2022-08-30soldstatus $53,100 Closed 24-char remark
Show marketing remark (24 chars)
Nice Cape Coral Homesite
-
2022-08-30soldstatus $53,100
Show marketing remark (24 chars)
Nice Cape Coral Homesite
-
2022-07-27status Pending 24-char remark
Show marketing remark (24 chars)
Nice Cape Coral Homesite
-
2022-07-21price $54,900 24-char remark
Show marketing remark (24 chars)
Nice Cape Coral Homesite
-
2022-06-09price $69,900 24-char remark
Show marketing remark (24 chars)
Nice Cape Coral Homesite
-
2022-05-13price $77,900 24-char remark
Show marketing remark (24 chars)
Nice Cape Coral Homesite
-
2022-04-05price $79,900 24-char remark
Show marketing remark (24 chars)
Nice Cape Coral Homesite
-
2022-02-16price $69,900 24-char remark
Show marketing remark (24 chars)
Nice Cape Coral Homesite
-
2021-09-15price $59,900 24-char remark
Show marketing remark (24 chars)
Nice Cape Coral Homesite
-
2021-07-19soldstatus $30,000
-
2021-07-16$49,900 Active 24-char remark
Show marketing remark (24 chars)
Nice Cape Coral Homesite
-
2004-06-28soldstatus $42,500
ⓘ Source: listings_history table (triggers on properties + properties_extension) + one-shot
backfill from property_details.listing_events for pre-trigger history.
Tax reassessment forecast FL · Resets to sale price
- Current annual tax
- $1,262 · $105/mo
- Projected year-2 tax
- $1,577 · $131/mo
- Expected delta
- +$315/yr (+$26/mo · 25.0%)
ⓘ Screening estimate from a state-policy table — verify with the county assessor before closing.
Climate risk First Street
- Flood 8/10 Severe FEMA zone X (shaded) · 99% chance over 30 yrs
- Wildfire 2/10 Low
- Heat 10/10 Extreme 7 d/yr ≥107°F today · 31 d/yr by 30 yrs out
- Wind 10/10 Extreme 99% chance of damaging wind over 30 yrs
- Air quality 2/10 Low 1 unhealthy d/yr today · 1 by 30 yrs out
Nearby sold comps map
Loading sold comps map…
Walkable amenities ~0.75 mi
Loading nearby amenities…
Taxation est. · year 1
- Rental income
- $30,681
- − Mortgage interest
- −$10,643
- − Property taxes
- −$1,262
- − Insurance
- −$1,748
- − Repairs & maintenance
- −$2,454
- − Management
- −$2,454
- − Depreciation
- −$5,527
- Taxable income
- $6,592
- Est. tax owed @ 24.0%
- −$1,582
- After-tax cash flow
- $7,689/yr
For passive investors: Depreciation is non-cash, so a rental often shows a tax loss while cash-flowing — sheltering income. Rental losses are passive: they offset passive income freely, and up to $25,000/yr can offset ordinary (W-2) income if you actively participate and your MAGI is under $100k (phasing out to $0 by $150k); unused losses carry forward. On sale, claimed depreciation is recaptured at up to 25%, and gains may owe capital-gains tax (a 1031 exchange can defer both). Figures are a year-1 estimate at your 24.0% rate — not tax advice; consult a CPA.
Schools (NCES district)
- District
- Lee
- NCES district ID
- 1201080
- Math proficiency
- 47% ▼ -11.00%
- Reading proficiency
- 50% ▼ -4.00%
- Median HH income
- $49,518
- Composite
- 41.49/100
- National rank
- #3458
- State rank
- #42 of 73 in FL
Livability — Cape Coral
- Score
- 77/100
- State rank
- #208
- US rank
- #3098
Category grades
Schools grade is shown separately in the Schools card above.
Census & demographics
- Census place
- Cape Coral, FL
- County
- Lee County · 788,662 people
- City population
- 217,388
- Metro
- Cape Coral-Fort Myers, FL
- Population (ZIP)
- 35,580
- Household income
- $90,577
- Rent vs Own
- Severe rent burden
- 286.0
Population outlook (Lee County) Hauer SSP2
- Today (2025)
- 871,946 people
- By 2030
- 955,468 · +9.6%
- By 2040
- 1,113,587 · +27.7%
- By 2050
- 1,256,891 · +44.1%
- By 2075
- 1,560,270 · +78.9%
- By 2100
- 1,726,848 · +98.0%
Race, ethnicity, and origin ACS 2023
- Neighborhood character
- Diverse neighborhood (Simpson 0.58)
- Race & ethnicity
- White 57% Hispanic / Latino 30% Two or more races 21% Black 7% Asian 2%
- Hispanic origin (detail)
- Mexican 2% Puerto Rican 6% Cuban 17% Dominican 1%
- Common ancestry
- Romanian 2% Hispanic 2% Lithuanian 2%
- Foreign-born
- 21% · Canada, Jamaica, China
- Languages at home
- 73% English-only · Spanish 24% French/Haitian/Cajun 1% Russian/Polish/Slavic 1%
Political lean MEDSL · Lee
- 2024 margin
- Strong R (+28.4) · D 35.5% · R 63.9%
- 2008→2024 swing
- -18.0pp toward R · 2008: -10.4pp · 2024: -28.4pp
- All cycles
- 2024: R+28.4 2020: R+19.2 2016: R+20.4 2012: R+16.6 2008: R+10.4
Not yet ingested
- Civics
- —
Market trends
- HPI YoY
- ▼ -55.34%
- Current HPI
- 337.0575
- Rent YoY
- ▼ -5.51%
- Metro
- Cape Coral-Fort Myers, FL
- State GDP YoY
- ▲ 3.28%
- F500 in state
- 36
Industry mix (Fortune 500 HQ in FL)
| Industry | F500 HQs | Revenue |
|---|---|---|
| Industrial Technology | 2 | $29B |
|
||
| Insurance | 2 | $17B |
|
||
| Retail | 1 | $60B |
|
||
| Technology Distribution | 1 | $58B |
|
||
| Homebuilding | 1 | $35B |
|
||
| Technology Manufacturing | 1 | $35B |
|
||
Price history
+347.1% since first listed19 events — show timeline
- 2026-04-28 Price Changed $190,000 NAPLESMLS
- 2026-03-23 Listed $210,000 NAPLESMLS
- 2024-03-12 Sold (Public Records) $771,286 Public Records
- 2024-03-08 Sold (MLS) $57,000 FORTMLS
- 2024-02-15 Pending — FORTMLS
- 2024-02-10 Price Changed $60,000 FORTMLS
- 2024-01-26 Listed $53,900 FORTMLS
- 2022-08-30 Sold (Public Records) $53,100 Public Records
- 2022-08-30 Sold (MLS) $53,100 FORTMLS
- 2022-07-27 Pending — FORTMLS
- 2022-07-21 Price Changed $54,900 FORTMLS
- 2022-06-09 Price Changed $69,900 FORTMLS
- 2022-05-13 Price Changed $77,900 FORTMLS
- 2022-04-05 Price Changed $79,900 FORTMLS
- 2022-02-16 Price Changed $69,900 FORTMLS
- 2021-09-15 Price Changed $59,900 FORTMLS
- 2021-07-19 Sold (Public Records) $30,000 Public Records
- 2021-07-16 Listed $49,900 FORTMLS
- 2004-06-28 Sold (Public Records) $42,500 Public Records
Property tax history
+13.8%/yrLatest (2025): $1,262 · +12.9% YoY. Source: county tax records.
Cash-flow waterfall
monthlySold comps — $/sqft
last 12 mo · ≤1 miLoading sold comps…