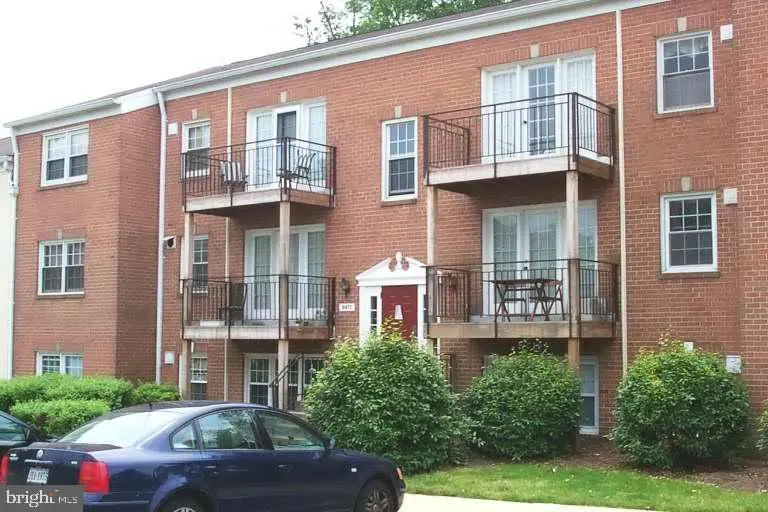
9471 Fairfax Blvd #103 · Fairfax, VA
Flood risk 1/10 · Minimal
- FEMA flood zone
- X (unshaded)
- Chance of flooding over 30 yrs
- 0.0%
- Est. flood insurance / yr
- $507 – $1,088
Fire risk 1/10 · Minimal
- Est. fire insurance / yr
- $666 – $1,236
Heat risk 7/10 · Major
- Hot days now (above 103°F)
- 7 days/yr
- Hot days in 30 yrs
- 17 days/yr
Wind risk 4/10 · Minor
- Chance of severe wind over 30 yrs
- 13.0%
Air-quality risk 2/10 · Minimal
- Unhealthy air days now
- 2 days/yr
- Unhealthy air days in 30 yrs
- 2 days/yr
Risk factors via First Street. Map © Google.
Why this score? — see what drove the D grade
The composite is a weighted blend of 9 inputs, each scored 0–100. Each bar is that input's sub-score; the figure is the points it added to the 100-point composite (weight × sub-score).
- Cash flow +10.3/30.0
- ARV discount +9.1/15.0
- 1% rule +5.4/10.0
- Schools +5.0/10.0
- Livability +4.4/5.0
- DSCR +2.9/10.0
- Condition / age +2.5/5.0
- Rent growth +1.7/5.0
- Appreciation +0.0/10.0
$200,000
🖨 Deal sheet 📄 Offer letter ✓ Due diligence
Listing remarks MLS
THIS PROPERTY HAS GREAT POTENTIAL AND NEEDS TO REMODELED. ALL UTILITIES ARE INCLUDED IN THE CONDO FEE. CASH BUYERS OR DSCR LOAN . SOLD AS IS. SELLER OFFERING A $15K CREDIT AT CLOSING. CONTACT Michelle Hewitt Commercial Loan Originator
Key facts
- $440 HOA
- Community pool
- Built 1963
Neighborhood map
What this means for you Summary
Snapshot
- This is a 1-bed/1.0-bath condo listed at $200k.
Deal economics
- At list price, monthly cash flow is $-111 ($-1k/yr) — negative.
- To cash-flow at today's rent, offer at most $180k (9.8% below list).
- Meets the 1% rule at list price ($2k rent vs $200k).
- Recommended offer: $180k (9.8% below list) — sets the bar for cash-flow.
- Cap rate 5.6% vs local median 2.2% in Fairfax — top-decile yield for the area; either an underpriced asset or a hidden risk that comps aren't pricing in. Stress-test before assuming the spread holds.
Location & tenants
- Location reads 87/100 on livability (#13 in VA, #315 nationally) — a professional / high-income tenant draw. Strengths: schools A+, crime A+, amenities A+; Watch: cost of living F.
- Market conditions: Rents falling (-3.1%/yr); 139 active listings in the ZIP; 9 comparable units currently listed for rent nearby; rentals leasing fast (median 5d on market — plan ~1-2 weeks tenant-placement turnaround); high-income renter base; 71 units permitted in Fairfax city in 2024 (0 in 5+ unit buildings).
Forward outlook
- Local home prices are declining (-3.0%/yr); year-one equity from $1k of loan paydown is wiped out by about $6k of value loss. Plan a longer hold.
- Fairfax County population projected at +12% by 2050 — modest demand growth; plan on rents tracking national, not racing it.
Negotiation context
- It's been on market 84 days — a 6% lower offer ($188k) is reasonable based on typical stale-listing flexibility.
- Current owner paid $59k; list at $200k implies a 240% gain — meaningful room to come down on a strong offer.
Risks & watch-outs
- Watch-outs: HOA is 21% of rent.
- Climate carrying-cost: extreme-heat days projected 7→17/yr by 2055 (HVAC capex compounding) — expect insurance premiums to compound above CPI over the hold.
Questions for the listing agent
- What do current leases actually rent for vs. the listed asking? Can we see a recent rent roll and the last 12 months of T-12 income?
- It's been on market 84 days. Have you received any prior offers? Is the seller open to a 10% concession, seller financing, or rate buy-down credit?
- Built in 1963 — when were the roof, HVAC, electrical panel, plumbing, and water heater last replaced?
- What does the HOA fee cover, when was the last increase, and are there any pending special assessments or reserve-fund shortfalls?
- Any open or pending special assessments — roof, HVAC, plumbing, elevator, façade? What's the per-unit balance and payoff schedule, and is the seller paying it off at close or rolling it to the buyer?
- Why hasn't it sold? Are there any deal-killer items the seller is aware of (foundation, flood, title, zoning, code violations)?
- Is there a deadline driving the sale (1031 exchange, divorce, estate, relocation)? That informs how much negotiation room exists.
- Schools are A-rated — typically a magnet for longer-tenancy family renters. What's the average tenant stay here, and is there a school-zone premium baked into asking?
- The area grade is low — what's the realistic commute time and amenity access for the typical tenant pool here? Any planned neighborhood developments (good or bad) we should know about?
- What's the average days-on-market for RENTAL listings here right now (not sales)? A rising rental-DOM trend means longer vacancies and softer asking-rent achievability than the comps imply.
- What's the recent tenant-quality profile in this submarket — average credit score on applications, eviction rate, late-payment / NSF rate, and stable-employment percentage? A property-management company in the area should have these aggregated.
- How much new apartment / multifamily construction is in the pipeline within 1–3 miles? Heavy new supply (>2% of stock underway) typically softens rents 12–24 months out; light construction supports rent growth.
Investment metrics
- 1% rule
- 1.04% ✓
- Cap rate
- 5.63%
- Cash-on-cash
- -2.37%
- DSCR
- 0.89
- GRM
- 8.0
CMA / ARV
- ARV (median comp)
- $207,455
- List price
- $200,000
- Delta
- -3.59%
- Verdict
- FAIR
- Comps
- 20 within 1.0 mi
Projected returns pro-forma
-3.0% appreciation · 0.0% rent growth · sell at horizon
- IRR
- -24.5%
- Equity multiple
- 0.19×
- Total profit
- $-45,293
- Equity at exit
- $29,821
- IRR
- -37.9%
- Equity multiple
- -0.27×
- Total profit
- $-71,027
- Equity at exit
- $17,292
Cash invested: $56,000 (down + closing). Projections, not guarantees.
Landlord ↔ Tenant lean methodology
- Overall (STATE)
- 55 Moderately Landlord-Leaning
- State Virginia
- 55 Moderately Landlord-Leaning · D+2
- County
- — inherits STATE
- City
- — inherits STATE
ZIP-level market 22031
- Rents YoY
- -3.1%
- Active inventory
- 139
- Price-to-rent
- 8.0×
Monthly cashflow live
- Estimated rent
- $2,081 high interval (Pro) →
- Mortgage (P&I)
- −$1,049
- Tax from tax record
- −$183 /mo · $2,193/yr
- Insurance
- −$83
- HOA
- −$440
- Vacancy / Maint / Mgmt
- −$437
- Net cashflow
- $-111
Break-even live
UW: 25.0% down · 7.5% · 30yr · 1.5% tax · 5.0% vac · 8.0% maint · 8.0% mgmt
Financing live
Cash to close
- Down payment
- $50,000
- Closing costs
- $6,000
- Reserves months
- —
- Total cash needed
- —
Loan-product check · same deal, 3 products live
Conventional
25% down · 7.5% · 30yr
- Down + closing
- —
- Monthly P&I
- —
- Monthly cashflow
- —
- DSCR
- —
- Eligible?
- —
Personal DTI + credit; lowest rate.
DSCR
20% down · 8.5% · 30yr
- Down + closing
- —
- Monthly P&I
- —
- Monthly cashflow
- —
- DSCR
- —
- Eligible?
- —
No personal income docs; deal must DSCR.
Hard money
10% down · 12.0% · 12mo
- Down + closing
- —
- Monthly P&I
- —
- Monthly cashflow
- —
- DSCR
- —
- Eligible?
- —
Short-term bridge; refi at stabilization.
Rent comps 9 comps
| Address | Beds | Baths | Sqft | Rent | $/sqft | DOM | Units | Dist |
|---|---|---|---|---|---|---|---|---|
| 9450 Fairfax Blvd Fairfax, VA | 3.0 | 1.0–2.0 | 1090 | $2,567 | $2.35 | 1d | 28 | 0.10mi |
| 9401 Lee Hwy Fairfax, VA | 1.0–3.0 | 1.0–2.5 | 1120 | $1,599 | $1.43 | 1d | 36 | 0.28mi |
| 9555 Blake Ln Fairfax, VA | 1.0–2.0 | 1.0–1.5 | 852 | $1,790 | $2.10 | 43d | 1 | 0.39mi |
| 9333 Clocktower Pl Fairfax, VA | 1.0–3.0 | 1.0–2.0 | 974 | $2,275 | $2.34 | 1d | 38 | 0.63mi |
| 2975 Hunters Branch Rd Fairfax, VA | 1.0–2.0 | 1.0–2.0 | 954 | $1,989 | $2.08 | 5d | 18 | 0.75mi |
| 10025 Fair Woods Dr #143 Fairfax, VA | 1.0 | 1.0 | 720 | $1,750 | $2.43 | 43d | 1 | 1.12mi |
| 2765 Centerboro Dr Vienna, VA | 1.0–2.0 | 1.0–2.0 | 911 | $2,150 | $2.36 | 20d | 2 | 1.13mi |
| 9480 Virginia Center Blvd Unit 104 Vienna, VA | 1.0 | 1.0 | 741 | $1,950 | $2.63 | 43d | 1 | 1.15mi |
| 3316 Prosperity Ave Fairfax, VA | — | 1.0 | 680 | $1,900 | $2.79 | 1d | 1 | 1.47mi |
HOA detail condo
- Monthly dues
- $440 · $5,280/yr
- Assessments
- None detected in remarks — confirm with the listing agent.
Listing history 19 events
-
2026-06-18status $200,000 Pending 84 DOM
-
2026-06-18days on market $200,000 Active 84 DOM
-
2026-06-17days on market $200,000 Active 83 DOM
-
2026-06-16days on market $200,000 Active 82 DOM
-
2026-06-15days on market $200,000 Active 81 DOM
-
2026-06-13days on market $200,000 Active 79 DOM
-
2026-06-13days on market $200,000 Active 78 DOM
-
2026-06-09days on market $200,000 Active 75 DOM
-
2026-06-08days on market $200,000 Active 74 DOM
-
2026-06-07days on market $200,000 Active 73 DOM
-
2026-06-04days on market $200,000 Active 70 DOM
-
2026-06-03days on market $200,000 Active 69 DOM
-
2026-06-02days on market $200,000 Active 68 DOM
-
2026-06-01days on market $200,000 Active 67 DOM
-
2026-05-31days on market $200,000 Active 66 DOM
-
2026-04-22price $200,000 234-char remark
Show marketing remark (234 chars)
THIS PROPERTY HAS GREAT POTENTIAL AND NEEDS TO REMODELED. ALL UTILITIES ARE INCLUDED IN THE CONDO FEE. CASH BUYERS OR DSCR LOAN . SOLD AS IS. SELLER OFFERING A $15K CREDIT AT CLOSING. CONTACT Michelle Hewitt Commercial Loan Originator
-
2026-03-26$210,000 Active 234-char remark
Show marketing remark (234 chars)
THIS PROPERTY HAS GREAT POTENTIAL AND NEEDS TO REMODELED. ALL UTILITIES ARE INCLUDED IN THE CONDO FEE. CASH BUYERS OR DSCR LOAN . SOLD AS IS. SELLER OFFERING A $15K CREDIT AT CLOSING. CONTACT Michelle Hewitt Commercial Loan Originator
-
2001-03-01soldstatus $58,800
-
1989-12-04soldstatus $65,375
ⓘ Source: listings_history table (triggers on properties + properties_extension) + one-shot
backfill from property_details.listing_events for pre-trigger history.
Tax reassessment forecast VA · Resets to sale price
- Current annual tax
- $2,193 · $183/mo
- Projected year-2 tax
- $2,193 · $183/mo
- Expected delta
- $0/yr ($0/mo · 0.0%)
ⓘ Screening estimate from a state-policy table — verify with the county assessor before closing.
Climate risk First Street
- Flood 1/10 Low FEMA zone X (unshaded) · 0% chance over 30 yrs
- Wildfire 1/10 Low
- Heat 7/10 Severe 7 d/yr ≥103°F today · 17 d/yr by 30 yrs out
- Wind 4/10 Moderate 13% chance of damaging wind over 30 yrs
- Air quality 2/10 Low 2 unhealthy d/yr today · 2 by 30 yrs out
Nearby sold comps map
Loading sold comps map…
Walkable amenities ~0.75 mi
Loading nearby amenities…
Taxation est. · year 1
- Rental income
- $24,977
- − Mortgage interest
- −$11,203
- − Property taxes
- −$2,193
- − Insurance
- −$1,000
- − Repairs & maintenance
- −$1,998
- − Management
- −$1,998
- − HOA
- −$5,280
- − Depreciation
- −$5,818
- Taxable loss
- −$4,514
- Est. tax savings @ 24.0%
- +$1,083
- After-tax cash flow
- $-244/yr
For passive investors: Depreciation is non-cash, so a rental often shows a tax loss while cash-flowing — sheltering income. Rental losses are passive: they offset passive income freely, and up to $25,000/yr can offset ordinary (W-2) income if you actively participate and your MAGI is under $100k (phasing out to $0 by $150k); unused losses carry forward. On sale, claimed depreciation is recaptured at up to 25%, and gains may owe capital-gains tax (a 1031 exchange can defer both). Figures are a year-1 estimate at your 24.0% rate — not tax advice; consult a CPA.
Schools (NCES district)
No district data.
Livability — Fairfax
- Score
- 87/100
- State rank
- #13
- US rank
- #315
Category grades
Schools grade is shown separately in the Schools card above.
Census & demographics
- Census place
- Fairfax, VA
- County
- Fairfax County · 1,104,456 people
- City population
- 138,134
- Metro
- Washington-Arlington-Alexandria, DC-VA-MD-WV
- Population (ZIP)
- 37,276
- Household income
- $134,577
- Rent vs Own
- Severe rent burden
- 1368.0
Population outlook (Fairfax County) Hauer SSP2
- Today (2025)
- 25,615 people
- By 2030
- 26,369 · +2.9%
- By 2040
- 27,692 · +8.1%
- By 2050
- 28,756 · +12.3%
- By 2075
- 31,201 · +21.8%
- By 2100
- 32,455 · +26.7%
Race, ethnicity, and origin ACS 2023
- Neighborhood character
- Diverse neighborhood (Simpson 0.67)
- Race & ethnicity
- White 47% Asian 31% Hispanic / Latino 10% Two or more races 8% Black 7%
- Hispanic origin (detail)
- Common ancestry
- Italian 2% Lithuanian 2% Romanian 2%
- Foreign-born
- 39% · Canada, South Korea, China
- Languages at home
- 54% English-only · Other Indo-European 11% Spanish 9% Other Asian/Pacific 7%
Political lean MEDSL · Fairfax
- 2024 margin
- Solid D (+33.4) · D 65.4% · R 32.0% · Other 2.6%
- 2008→2024 swing
- +16.9pp toward D · 2008: 16.5pp · 2024: 33.4pp
- All cycles
- 2024: D+33.4 2020: D+38.3 2016: D+30.9 2012: D+16.2 2008: D+16.5
Not yet ingested
- Civics
- —
Market trends
- HPI YoY
- ▼ -412.96%
- Current HPI
- 310.2994
- Rent YoY
- ▼ -3.09%
- Metro
- Washington-Arlington-Alexandria, DC-VA-MD-WV
- State GDP YoY
- ▲ 2.40%
- F500 in state
- 50
Industry mix (Fortune 500 HQ in VA)
| Industry | F500 HQs | Revenue |
|---|---|---|
| Aerospace / Defense | 4 | $236B |
|
||
| Technology / Defense | 3 | $32B |
|
||
| Financial Services | 2 | $176B |
|
||
| Utilities | 2 | $27B |
|
||
| Insurance | 2 | $25B |
|
||
| Technology | 2 | $15B |
|
||
Price history
+205.9% since first listed4 events — show timeline
- 2026-04-22 Price Changed $200,000 BRIGHT MLS
- 2026-03-26 Listed $210,000 BRIGHT MLS
- 2001-03-01 Sold (Public Records) $58,800 Public Records
- 1989-12-04 Sold (Public Records) $65,375 Public Records
Property tax history
+9.5%/yrLatest (2025): $2,193 · +12.8% YoY. Source: county tax records.
Cash-flow waterfall
monthlySold comps — $/sqft
last 12 mo · ≤1 miLoading sold comps…