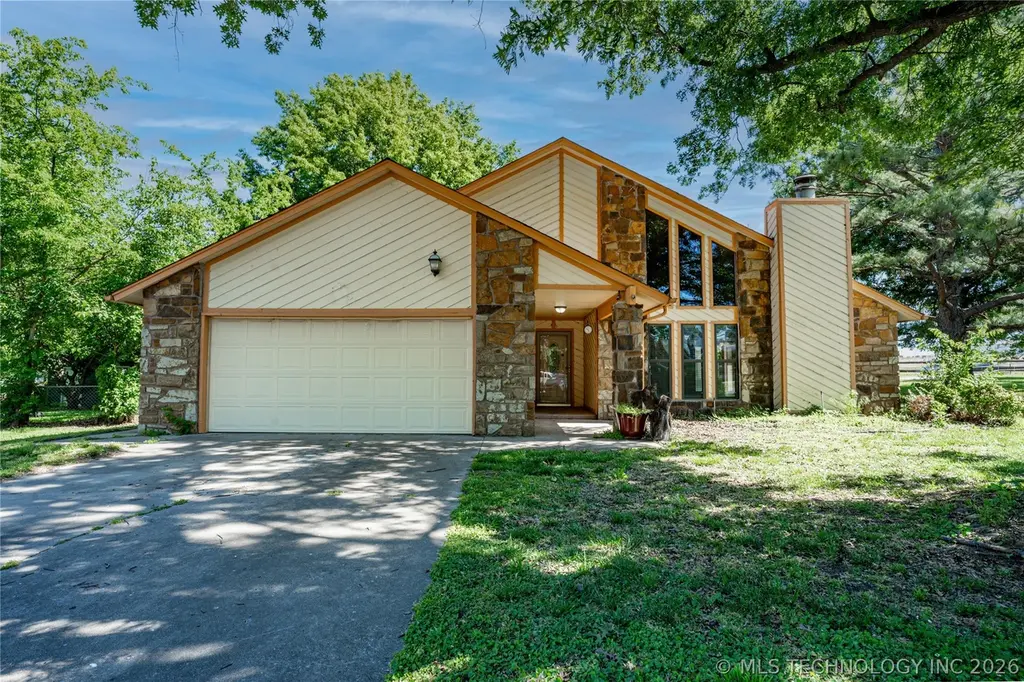
25661 Chestnut Dr · Broken Arrow, OK
Flood risk 1/10 · Minimal
- FEMA flood zone
- X (unshaded)
- Chance of flooding over 30 yrs
- 0.0%
- Est. flood insurance / yr
- $507 – $1,088
Fire risk 5/10 · Moderate
- Est. fire insurance / yr
- $2,463 – $4,575
Heat risk 6/10 · Moderate
- Hot days now (above 110°F)
- 7 days/yr
- Hot days in 30 yrs
- 19 days/yr
Wind risk 3/10 · Minor
- Chance of severe wind over 30 yrs
- 4.0%
Air-quality risk 1/10 · Minimal
- Unhealthy air days now
- 0 days/yr
- Unhealthy air days in 30 yrs
- 0 days/yr
Risk factors via First Street. Map © Google.
Why this score? — see what drove the D- grade
The composite is a weighted blend of 9 inputs, each scored 0–100. Each bar is that input's sub-score; the figure is the points it added to the 100-point composite (weight × sub-score).
- Cash flow +11.8/30.0
- ARV discount +7.5/15.0
- Livability +3.9/5.0
- DSCR +3.5/10.0
- Rent growth +3.0/5.0
- 1% rule +2.7/10.0
- Condition / age +2.5/5.0
- Schools +2.4/10.0
- Appreciation +0.0/10.0
$249,000
🖨 Deal sheet (PDF) 📄 Offer letter ✓ Due diligence
Listing remarks
Tucked away on a quiet cul-de-sac, this 3 bedroom, 2 bath home sits on a spacious 1-acre lot offering plenty of room to spread out and enjoy the outdoors. The property features a detached 3-car garage/shop in the back, perfect for additional storage, hobbies, or workspace. The home itself has a new HVAC installed in 2023, providing peace of mind on one of the major updates already completed. Inside, the property offers a great layout and solid bones, just waiting for a buyer to bring their vision and make it their own. With a little updating and TLC, this home has incredible potential to truly shine in a desirable setting.
Key facts
- 1 acre lot
- 2 garage spots
- Built 1979
Property features AI
Finance
- Financial info: Pets allowed
- HOA & community: Community gutters
Exterior
- Parking: Attached garage; 2-car garage
- Security: Smoke detector(s); No safety shelter
- Utilities: Electricity available; Natural gas available; High-speed internet available; Water available (rural water source); Public sewer
- Home design: Single-story home; Faces northeast; Slab foundation
- Construction: HardiPlank, stone and wood frame construction; Asphalt/fiberglass roof; Built per public records
- Exterior features: Patio; Rain gutters; Chain link fencing; Second garage structure; Mature trees; Cul-de-sac lot
Interior
- Kitchen: Dishwasher; Disposal; Microwave; Oven; Range; Refrigerator
- Bedrooms: Master bedroom with private bath (first level); Additional bedrooms on first level
- Flooring: Tile; Wood veneer
- Bathrooms: Two full bathrooms; Master bath with double sink and shower; Hall bath with bathtub
- Heating & cooling: Central heating (electric and gas); Central air conditioning
- Interior features: High ceilings with vaulted areas; Ceiling fans; Laminate countertops; Vinyl windows
- Laundry & utility: Inside utility room; Gas dryer hookup; Gas water heater
Neighborhood map
What this means for you Summary
Snapshot
- This is a 3-bed/2.0-bath land listed at $249k.
Deal economics
- At list price, monthly cash flow is $-67 ($-808/yr) — negative.
- To cash-flow at today's rent, offer at most $237k (4.8% below list).
- To meet the 1% rule (rent ≥ 1% of price), the offer needs to be $191k (23.3% below list).
- Recommended offer: $191k (23.3% below list) — sets the bar for 1% rule.
- Cap rate 6.0% vs local median 4.0% in Broken Arrow — top-decile yield for the area; either an underpriced asset or a hidden risk that comps aren't pricing in. Stress-test before assuming the spread holds.
Location & tenants
- Location reads 78/100 on livability (#7 in OK, #2,691 nationally) — a middle-class / working-renter tenant base. Strengths: commute A+, cost of living A+, housing A+; Watch: amenities F.
- Broken Arrow (suburban): math 23% / reading 28% proficiency, ranked #79 of 270 in OK (top 29%) — low school quality limits family demand, transient renter base, plan for 1-2y turnover.
- Zoned schools: Highland Park Es (math 41% / reading 33%, grade F, #132 of 845 statewide, top 19%, 698 students, 0% FRL); Oneta Ridge Ms (math 25% / reading 26%, grade F, #84 of 345 statewide, top 26%, 924 students, 0% FRL); Broken Arrow Hs (math 22% / reading 36%, grade F, #120 of 447 statewide, top 27%, 4,589 students, 0% FRL) — zoned schools average 0% FRL vs 33% district-wide (33 pts lower); this property's tenant base skews higher-income than the district average.
- Market conditions: Rents rising (+2.1%/yr); 655 active listings in the ZIP; 1 comparable units currently listed for rent nearby; solid renter incomes; 581 units permitted in Wagoner County in 2024 (0 in 5+ unit buildings).
Forward outlook
- Local home prices are declining (-3.0%/yr); year-one equity from $2k of loan paydown is wiped out by about $7k of value loss. Plan a longer hold.
- Wagoner County population projected at +16% by 2050 — long-run rental-demand tailwind backs the buy-and-hold thesis.
Negotiation context
- Only 7 days on market — expect competitive offers; lowballing is unlikely to land.
Risks & watch-outs
- Climate carrying-cost: moderate wildfire risk; extreme-heat days projected 7→19/yr by 2055 (HVAC capex compounding) — expect insurance premiums to compound above CPI over the hold.
Questions for the listing agent
- What do current leases actually rent for vs. the listed asking? Can we see a recent rent roll and the last 12 months of T-12 income?
- Built in 1979 — when were the roof, HVAC, electrical panel, plumbing, and water heater last replaced?
- Is there a deadline driving the sale (1031 exchange, divorce, estate, relocation)? That informs how much negotiation room exists.
- Schools are D-rated, which usually means shorter tenancies and higher turnover. Who's the typical renter profile here, and what's been the actual vacancy rate?
- The area grade is low — what's the realistic commute time and amenity access for the typical tenant pool here? Any planned neighborhood developments (good or bad) we should know about?
- What's the average days-on-market for RENTAL listings here right now (not sales)? A rising rental-DOM trend means longer vacancies and softer asking-rent achievability than the comps imply.
- What's the recent tenant-quality profile in this submarket — average credit score on applications, eviction rate, late-payment / NSF rate, and stable-employment percentage? A property-management company in the area should have these aggregated.
- How much new for-sale + rental construction is in the pipeline within 1–3 miles? Heavy new supply typically softens prices + rents 12–24 months out; constrained supply supports both.
Investment metrics
- 1% rule
- 0.77% ✗
- Cap rate
- 5.97%
- Cash-on-cash
- -1.16%
- DSCR
- 0.95
- GRM
- 10.9
CMA / ARV
No comps found within radius.
Projected returns pro-forma
-3.0% appreciation · 2.12% rent growth · sell at horizon
- IRR
- -19.1%
- Equity multiple
- 0.33×
- Total profit
- $-46,371
- Equity at exit
- $37,127
- IRR
- -13.6%
- Equity multiple
- 0.24×
- Total profit
- $-52,900
- Equity at exit
- $21,529
Cash invested: $69,720 (down + closing). Projections, not guarantees.
Landlord ↔ Tenant lean methodology
- Overall (STATE)
- 83 Strongly Landlord-Friendly
- State Oklahoma
- 83 Strongly Landlord-Friendly · R+20
- County
- — inherits STATE
- City
- — inherits STATE
ZIP-level market 74014
- Rents YoY
- 2.1%
- Active inventory
- 655
- Price-to-rent
- 10.9×
Monthly cashflow live
- Estimated rent
- $1,909 medium interval (Pro) →
- Mortgage (P&I)
- −$1,306
- Tax from tax record
- −$166 /mo · $1,993/yr
- Insurance
- −$104
- HOA
- −$0
- Vacancy / Maint / Mgmt
- −$401
- Net cashflow
- $-67
Break-even live
Sensitivity live
| Price | -10% $74 | -5% $3 | +0% $-67 | +5% $-138 | +10% $-208 |
|---|---|---|---|---|---|
| Rent | -10% $-218 | -5% $-143 | +0% $-67 | +5% $8 | +10% $84 |
| Rate | -1.0pp $58 | -0.5pp $-4 | base $-67 | +0.5pp $-132 | +1.0pp $-197 |
UW: 25.0% down · 7.5% · 30yr · 1.5% tax · 5.0% vac · 8.0% maint · 8.0% mgmt
Financing live
Cash to close
- Down payment
- $62,250
- Closing costs
- $7,470
- Reserves months
- —
- Total cash needed
- —
Loan-product check · same deal, 3 products live
Conventional
25% down · 7.5% · 30yr
- Down + closing
- —
- Monthly P&I
- —
- Monthly cashflow
- —
- DSCR
- —
- Eligible?
- —
Personal DTI + credit; lowest rate.
DSCR
20% down · 8.5% · 30yr
- Down + closing
- —
- Monthly P&I
- —
- Monthly cashflow
- —
- DSCR
- —
- Eligible?
- —
No personal income docs; deal must DSCR.
Hard money
10% down · 12.0% · 12mo
- Down + closing
- —
- Monthly P&I
- —
- Monthly cashflow
- —
- DSCR
- —
- Eligible?
- —
Short-term bridge; refi at stabilization.
Rent comps 1 comps
| Address | Beds | Baths | Sqft | Rent | $/sqft | DOM | Units | Dist |
|---|---|---|---|---|---|---|---|---|
| 9127 S 256th East Ave Broken Arrow, OK | 3.0 | 2.0 | 1455 | $1,750 | $1.20 | 3d | 1 | 0.90mi |
Listing history 2 events
-
2026-05-14status Pending
-
2026-05-07$249,000 Active
ⓘ Source: listings_history table (triggers on properties + properties_extension) + one-shot
backfill from property_details.listing_events for pre-trigger history.
Tax reassessment forecast OK · Resets to sale price
- Current annual tax
- $1,993 · $166/mo
- Projected year-2 tax
- $2,241 · $187/mo
- Expected delta
- +$248/yr (+$21/mo · 12.4%)
ⓘ Screening estimate from a state-policy table — verify with the county assessor before closing.
Climate risk First Street
- Flood 1/10 Low FEMA zone X (unshaded) · 0% chance over 30 yrs
- Wildfire 5/10 Major
- Heat 6/10 Major 7 d/yr ≥110°F today · 19 d/yr by 30 yrs out
- Wind 3/10 Moderate 4% chance of damaging wind over 30 yrs
- Air quality 1/10 Low 0 unhealthy d/yr today · 0 by 30 yrs out
Nearby sold comps map
Loading sold comps map…
Walkable amenities ~0.75 mi
Loading nearby amenities…
Taxation est. · year 1
- Rental income
- $22,911
- − Mortgage interest
- −$13,948
- − Property taxes
- −$1,993
- − Insurance
- −$1,245
- − Repairs & maintenance
- −$1,833
- − Management
- −$1,833
- − Depreciation
- −$7,244
- Taxable loss
- −$5,184
- Est. tax savings @ 24.0%
- +$1,244
- After-tax cash flow
- $437/yr
For passive investors: Depreciation is non-cash, so a rental often shows a tax loss while cash-flowing — sheltering income. Rental losses are passive: they offset passive income freely, and up to $25,000/yr can offset ordinary (W-2) income if you actively participate and your MAGI is under $100k (phasing out to $0 by $150k); unused losses carry forward. On sale, claimed depreciation is recaptured at up to 25%, and gains may owe capital-gains tax (a 1031 exchange can defer both). Figures are a year-1 estimate at your 24.0% rate — not tax advice; consult a CPA.
Schools (NCES district)
- District
- Broken Arrow
- NCES district ID
- 4005490
- Math proficiency
- 23% ▼ -9.00%
- Reading proficiency
- 28% ▼ -9.00%
- Median HH income
- $64,646
- Composite
- 23.86/100
- National rank
- #7801
- State rank
- #79 of 270 in OK
Livability — Broken Arrow
- Score
- 78/100
- State rank
- #7
- US rank
- #2691
Category grades
Schools grade is shown separately in the Schools card above.
Census & demographics
- County
- Wagoner County · 61,834 people
- City population
- 144,172
- Metro
- Tulsa, OK
- Population (ZIP)
- 45,212
- Household income
- $95,501
- Rent vs Own
- Severe rent burden
- 289.0
Population outlook (Wagoner County) Hauer SSP2
- Today (2025)
- 84,796 people
- By 2030
- 88,162 · +4.0%
- By 2040
- 93,882 · +10.7%
- By 2050
- 98,219 · +15.8%
- By 2075
- 106,561 · +25.7%
- By 2100
- 109,360 · +29.0%
Race, ethnicity, and origin ACS 2023
- Neighborhood character
- Predominantly White (69%)
- Race & ethnicity
- White 69% Two or more races 11% Hispanic / Latino 11% Native American 6% Asian 4% Black 3%
- Hispanic origin (detail)
- Mexican 8%
- Common ancestry
- Italian 2% Slovak 2% Lithuanian 2%
- Foreign-born
- 7% · Canada
- Languages at home
- 89% English-only · Spanish 7% Other Asian/Pacific 2% Russian/Polish/Slavic 1%
Political lean MEDSL · Wagoner
- 2024 margin
- Solid R (+49.8) · D 24.2% · R 74.0% · Other 1.8%
- 2008→2024 swing
- -8.0pp toward R · 2008: -41.8pp · 2024: -49.8pp
- All cycles
- 2024: R+49.8 2020: R+50.1 2016: R+52.0 2012: R+45.7 2008: R+41.8
Not yet ingested
- Civics
- —
Market trends
- HPI YoY
- ▼ -206.67%
- Current HPI
- 203.7301
- Rent YoY
- ▲ 2.12%
- Metro
- Tulsa, OK
- State GDP YoY
- ▲ 1.55%
- F500 in state
- 6
Industry mix (Fortune 500 HQ in OK)
| Industry | F500 HQs | Revenue |
|---|---|---|
| Energy | 3 | $48B |
|
||
Price history
2 events — show timeline
- 2026-05-14 Pending — MLS Technology, Inc.
- 2026-05-07 Listed $249,000 MLS Technology, Inc.
Property tax history
+2.9%/yrLatest (2025): $1,993 · +2.7% YoY. Source: county tax records.
Cash-flow waterfall
monthlySold comps — $/sqft
last 12 mo · ≤1 miLoading sold comps…