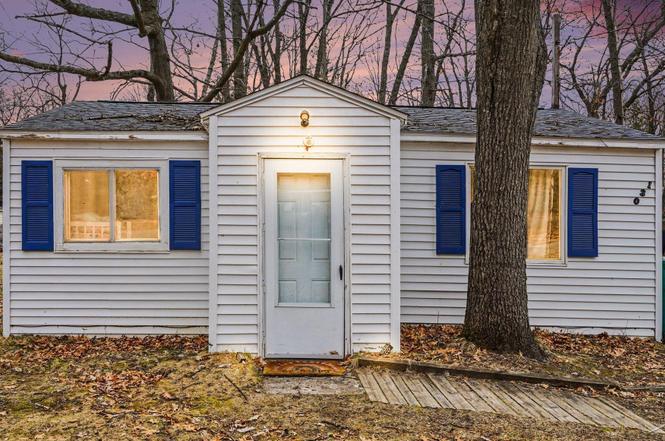
130 Burrill Dr · Denton, MI
Flood risk 1/10 · Minimal
- FEMA flood zone
- X (unshaded)
- Chance of flooding over 30 yrs
- 0.0%
- Est. flood insurance / yr
- $473 – $860
Fire risk 2/10 · Minimal
- Est. fire insurance / yr
- $784 – $1,456
Heat risk 1/10 · Minimal
- Hot days now (above 92°F)
- 7 days/yr
- Hot days in 30 yrs
- 14 days/yr
Wind risk 1/10 · Minimal
- Chance of severe wind over 30 yrs
- —
Air-quality risk 2/10 · Minimal
- Unhealthy air days now
- 0 days/yr
- Unhealthy air days in 30 yrs
- 1 days/yr
Risk factors via First Street. Map © Google.
Why this score? — see what drove the B grade
The composite is a weighted blend of 9 inputs, each scored 0–100. Each bar is that input's sub-score; the figure is the points it added to the 100-point composite (weight × sub-score).
- Cash flow +30.0/30.0
- ARV discount +13.9/15.0
- 1% rule +10.0/10.0
- DSCR +10.0/10.0
- Rent growth +2.5/5.0
- Livability +2.5/5.0
- Condition / age +2.5/5.0
- Schools +2.2/10.0
- Appreciation +0.0/10.0
$92,500
🖨 Deal sheet 📄 Offer letter ✓ Due diligence
Listing remarks MLS
Are you looking for your first rental… or your twentieth? Either way, this could be your next solid addition. Welcome to 130 Burrill Dr in Prudenville — a cash-flowing opportunity currently bringing in $1,100/month. Whether you’re building your portfolio or looking for a low-maintenance investment, this property offers immediate income potential. Located just minutes from Houghton Lake, this home benefits from strong rental demand driven by year-round recreation, tourism, and local convenience. If you’re looking for a straightforward investment with income already in place, this one is worth a look.
Key facts
- 6,098 sq ft lot
- Built 1955
- Listed 66 days
Property features AI
Finance
- HOA & community: Homeowners association present
Exterior
- Utilities: Public water; Public sewer
- Home design: Single-family residence; One story
- Construction: Vinyl siding
- Exterior features: Lot in Houghton Beach Subdivision; Corner/near Burrill / Fairmont Dr
Interior
- Bathrooms: 1 full bathroom
- Heating & cooling: Forced air heating (natural gas); No cooling
- Interior features: Crawl space basement; 3 total rooms
Neighborhood map
What this means for you Summary
Snapshot
- This is a 2-bed/1.0-bath single-family listed at $92k.
Deal economics
- At list price, monthly cash flow is $544 ($7k/yr) — positive.
- The deal already cash-flows at list — no discount required.
- Meets the 1% rule at list price ($2k rent vs $92k).
- Recommended offer: $87k (6.0% below list) — sets the bar for market timing.
Location & tenants
- Location reads: area grade B — affects rentability + tenant quality, not the cash-flow math above.
- Houghton Lake Community Schools (rural): math 18% / reading 36% proficiency, ranked #410 of 540 in MI (top 76%) — low school quality limits family demand, transient renter base, plan for 1-2y turnover.
- Market conditions: 84 active listings in the ZIP; 73 units permitted in Roscommon County in 2024 (0 in 5+ unit buildings).
Forward outlook
- Local home prices are declining (-3.0%/yr); year-one equity from $640 of loan paydown is wiped out by about $3k of value loss. Plan a longer hold.
- Roscommon County population projected at -21% by 2050 — secular population decline; favor cash flow + early exit over multi-decade hold.
- At projected returns (-3.0% appreciation + 3.0% rent growth), your $26k cash investment doubles in ~5 years — after that, you're playing with house money.
Negotiation context
- It's been on market 66 days — a 6% lower offer ($87k) is reasonable based on typical stale-listing flexibility.
- 2 sale attempts; this cycle's ask has dropped $7k (7%) from the opening price — seller is motivated, your offer sets the floor, not the list.
- Current owner paid $62k; 48% above their basis — modest negotiation headroom, anchor on the comps not their cost.
Risks & watch-outs
- Watch-outs: built in 1955 — expect roof / HVAC / electrical / plumbing capex.
Questions for the listing agent
- It's been on market 66 days. Have you received any prior offers? Is the seller open to a 6% concession, seller financing, or rate buy-down credit?
- Built in 1955 — when were the roof, HVAC, electrical panel, plumbing, and water heater last replaced?
- Why hasn't it sold? Are there any deal-killer items the seller is aware of (foundation, flood, title, zoning, code violations)?
- Is there a deadline driving the sale (1031 exchange, divorce, estate, relocation)? That informs how much negotiation room exists.
- What's the average days-on-market for RENTAL listings here right now (not sales)? A rising rental-DOM trend means longer vacancies and softer asking-rent achievability than the comps imply.
- What's the recent tenant-quality profile in this submarket — average credit score on applications, eviction rate, late-payment / NSF rate, and stable-employment percentage? A property-management company in the area should have these aggregated.
- How much new for-sale + rental construction is in the pipeline within 1–3 miles? Heavy new supply typically softens prices + rents 12–24 months out; constrained supply supports both.
Investment metrics
- 1% rule
- 1.67% ✓
- Cap rate
- 13.35%
- Cash-on-cash
- 25.19%
- DSCR
- 2.12
- GRM
- 5.0
CMA / ARV
- ARV (on-the-fly)
- $107,800
- Comps found
- 12
Show comp detail 12 sales within ~0.75 mi
| Address | Dist | Beds/Ba | Sqft | Sold | Price | $/sf | Match |
|---|---|---|---|---|---|---|---|
| 116 Burrill Dr | 0.07mi | 2/1.0 | 780 (+11%) | 4mo | $35,000 | $45 | 75 |
| 107 Sheridan Dr | 0.23mi | 2/1.0 | 672 (-4%) | 10mo | $75,000 | $112 | 74 |
| 155 Kimberly Dr | 0.12mi | 2/1.0 | 775 (+11%) | 5mo | $105,000 | $135 | 73 |
| 147 Devonshire Dr | 0.11mi | 2/1.0 | 780 (+11%) | 5mo | $150,000 | $192 | 71 |
| 213 Devonshire Dr | 0.28mi | 2/1.0 | 748 (+7%) | 10mo | $159,000 | $213 | 68 |
| 133 Maple Bluffs Ave | 0.47mi | 2/1.0 | 728 (+4%) | 5mo | $112,000 | $154 | 67 |
| 148 Cottage Dr | 0.09mi | 1/1.0 (-1) | 768 (+10%) | 13mo | $140,000 | $182 | 64 |
| 203 Tudor Dr | 0.25mi | 2/1.0 | 752 (+7%) | 17mo | $38,000 | $51 | 62 |
| 216 Cottage Dr | 0.18mi | 2/1.0 | 600 (-14%) | 13mo | $101,000 | $168 | 57 |
| 106 Toepher Dr | 0.26mi | 2/1.0 | 620 (-11%) | 16mo | $70,000 | $113 | 55 |
| 2757 Owens Dr Unit 84 | 0.40mi | 1/1.0 (-1) | 615 (-12%) | 17mo | $82,900 | $135 | 42 |
| 209 Deer Track Dr | 0.56mi | 2/1.0 | 600 (-14%) | 15mo | $109,000 | $182 | 38 |
Match score weights: distance 35% · size 25% · config 20% · recency 20%. Top-matched comps best support the ARV.
Projected returns pro-forma
-3.0% appreciation · 3.0% rent growth · sell at horizon
- IRR
- 18.7%
- Equity multiple
- 1.76×
- Total profit
- $19,688
- Equity at exit
- $13,792
- IRR
- 27.1%
- Equity multiple
- 3.39×
- Total profit
- $61,925
- Equity at exit
- $7,998
Cash invested: $25,900 (down + closing). Projections, not guarantees.
Landlord ↔ Tenant lean methodology
- Overall (STATE)
- 62 Landlord-Friendly
- State Michigan
- 62 Landlord-Friendly · EVEN
- County
- — inherits STATE
- City
- — inherits STATE
ZIP-level market 48651
- Home prices YoY
- -25.6%
- Active inventory
- 84
- Price-to-rent
- 5.0×
Monthly cashflow live
- Estimated rent
- $1,545 medium interval (Pro) →
- Mortgage (P&I)
- −$485
- Tax from tax record
- −$154 /mo · $1,843/yr
- Insurance
- −$39
- HOA
- −$0
- Vacancy / Maint / Mgmt
- −$325
- Net cashflow
- $544
Break-even live
UW: 25.0% down · 7.5% · 30yr · 1.5% tax · 5.0% vac · 8.0% maint · 8.0% mgmt
Financing live
Cash to close
- Down payment
- $23,125
- Closing costs
- $2,775
- Reserves months
- —
- Total cash needed
- —
Loan-product check · same deal, 3 products live
Conventional
25% down · 7.5% · 30yr
- Down + closing
- —
- Monthly P&I
- —
- Monthly cashflow
- —
- DSCR
- —
- Eligible?
- —
Personal DTI + credit; lowest rate.
DSCR
20% down · 8.5% · 30yr
- Down + closing
- —
- Monthly P&I
- —
- Monthly cashflow
- —
- DSCR
- —
- Eligible?
- —
No personal income docs; deal must DSCR.
Hard money
10% down · 12.0% · 12mo
- Down + closing
- —
- Monthly P&I
- —
- Monthly cashflow
- —
- DSCR
- —
- Eligible?
- —
Short-term bridge; refi at stabilization.
Listing history 19 events
-
2026-06-18days on market $92,500 Active 66 DOM
-
2026-06-17days on market $92,500 Active 65 DOM
-
2026-06-16days on market $92,500 Active 64 DOM
-
2026-06-15days on market $92,500 Active 63 DOM
-
2026-06-13days on market $92,500 Active 61 DOM
-
2026-06-12days on market $92,500 Active 60 DOM
-
2026-06-09days on market $92,500 Active 57 DOM
-
2026-06-08days on market $92,500 Active 56 DOM
-
2026-06-07pricedays on market $92,500 Active 55 DOM
-
2026-06-07days on market $99,900 Active 54 DOM
-
2026-06-04days on market $99,900 Active 51 DOM
-
2026-06-02days on market $99,900 Active 50 DOM
-
2026-06-01days on market $99,900 Active 49 DOM
-
2026-05-31days on market $99,900 Active 48 DOM
-
2026-05-31days on market $99,900 Active 47 DOM
-
2026-04-13$99,900 Active
Show marketing remark (631 chars)
Are you looking for your first rental… or your twentieth? Either way, this could be your next solid addition. Welcome to 130 Burrill Dr in Prudenville — a cash-flowing opportunity currently bringing in $1,100/month. Whether you’re building your portfolio or looking for a low-maintenance investment, this property offers immediate income potential. Located just minutes from Houghton Lake, this home benefits from strong rental demand driven by year-round recreation, tourism, and local convenience. If you’re looking for a straightforward investment with income already in place, this one is worth a look.
-
2026-04-13$99,900 Active 631-char remark
Show marketing remark (631 chars)
Are you looking for your first rental… or your twentieth? Either way, this could be your next solid addition. Welcome to 130 Burrill Dr in Prudenville — a cash-flowing opportunity currently bringing in $1,100/month. Whether you’re building your portfolio or looking for a low-maintenance investment, this property offers immediate income potential. Located just minutes from Houghton Lake, this home benefits from strong rental demand driven by year-round recreation, tourism, and local convenience. If you’re looking for a straightforward investment with income already in place, this one is worth a look.
-
2023-02-28soldstatus $62,500
-
2004-11-10soldstatus $35,000
ⓘ Source: listings_history table (triggers on properties + properties_extension) + one-shot
backfill from property_details.listing_events for pre-trigger history.
Tax reassessment forecast MI · Partial reset (capped growth)
- Current annual tax
- $1,843 · $154/mo
- Projected year-2 tax
- $1,843 · $154/mo
- Expected delta
- $0/yr ($0/mo · 0.0%)
ⓘ Screening estimate from a state-policy table — verify with the county assessor before closing.
Climate risk First Street
- Flood 1/10 Low FEMA zone X (unshaded) · 0% chance over 30 yrs
- Wildfire 2/10 Low
- Heat 1/10 Low 7 d/yr ≥92°F today · 14 d/yr by 30 yrs out
- Wind 1/10 Low
- Air quality 2/10 Low 0 unhealthy d/yr today · 1 by 30 yrs out
Nearby sold comps map
Loading sold comps map…
Walkable amenities ~0.75 mi
Loading nearby amenities…
Taxation est. · year 1
- Rental income
- $18,545
- − Mortgage interest
- −$5,181
- − Property taxes
- −$1,843
- − Insurance
- −$462
- − Repairs & maintenance
- −$1,484
- − Management
- −$1,484
- − Depreciation
- −$2,691
- Taxable income
- $5,401
- Est. tax owed @ 24.0%
- −$1,296
- After-tax cash flow
- $5,229/yr
For passive investors: Depreciation is non-cash, so a rental often shows a tax loss while cash-flowing — sheltering income. Rental losses are passive: they offset passive income freely, and up to $25,000/yr can offset ordinary (W-2) income if you actively participate and your MAGI is under $100k (phasing out to $0 by $150k); unused losses carry forward. On sale, claimed depreciation is recaptured at up to 25%, and gains may owe capital-gains tax (a 1031 exchange can defer both). Figures are a year-1 estimate at your 24.0% rate — not tax advice; consult a CPA.
Schools (NCES district)
- District
- Houghton Lake Community Schools
- NCES district ID
- 2618600
- Math proficiency
- 18% ▼ -7.00%
- Reading proficiency
- 36% ▼ -3.00%
- Median HH income
- $34,744
- Composite
- 22.19/100
- National rank
- #8158
- State rank
- #410 of 540 in MI
Livability — Denton
No livability data for this city. (Only ~50 U.S. cities are tracked.)
Census & demographics
- Census place
- Houghton Lake, MI
- Population (ZIP)
- 4,331
Population outlook (Roscommon County) Hauer SSP2
- Today (2025)
- 22,249 people
- By 2030
- 21,206 · -4.7%
- By 2040
- 19,070 · -14.3%
- By 2050
- 17,564 · -21.1%
- By 2075
- 15,420 · -30.7%
- By 2100
- 13,168 · -40.8%
Race, ethnicity, and origin ACS 2023
- Neighborhood character
- Predominantly White (94%)
- Race & ethnicity
- White 94% Two or more races 4% Hispanic / Latino 1%
- Common ancestry
- Romanian 9% Slovak 4% Iranian 4%
- Foreign-born
- 2%
- Languages at home
- 98% English-only · Spanish 1%
Political lean MEDSL · Roscommon
- 2024 margin
- Solid R (+32.9) · D 32.9% · R 65.9% · Other 1.2%
- 2008→2024 swing
- -35.5pp toward R · 2008: 2.5pp · 2024: -32.9pp
- All cycles
- 2024: R+32.9 2020: R+30.0 2016: R+29.6 2012: R+3.9 2008: D+2.5
Not yet ingested
- Civics
- —
Market trends
- HPI YoY
- ▼ -87.27%
- Current HPI
- 252.9662
- Rent YoY
- —
- Metro
- —
- State GDP YoY
- ▲ 1.37%
- F500 in state
- 28
Industry mix (Fortune 500 HQ in MI)
| Industry | F500 HQs | Revenue |
|---|---|---|
| Automotive Parts | 3 | $48B |
|
||
| Automotive | 2 | $372B |
|
||
| Chemicals | 1 | $45B |
|
||
| Automotive Retail | 1 | $29B |
|
||
| Healthcare / Medical Devices | 1 | $23B |
|
||
| Automotive Technology | 1 | $20B |
|
||
Price history
+185.4% since first listed4 events — show timeline
- 2026-04-13 Listed $99,900 REALCOMP
- 2026-04-13 Listed $99,900 MiRealSource-MiMLS
- 2023-02-28 Sold (Public Records) $62,500 Public Records
- 2004-11-10 Sold (Public Records) $35,000 Public Records
Property tax history
+6.1%/yrLatest (2025): $1,843 · +21.6% YoY. Source: county tax records.
Cash-flow waterfall
monthlySold comps — $/sqft
last 12 mo · ≤1 miLoading sold comps…