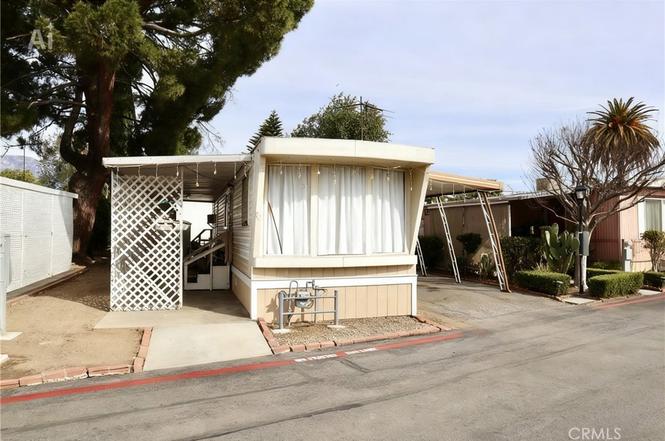
1512 E 5th St #70 · Ontario, CA
Flood risk 4/10 · Minor
- FEMA flood zone
- X (shaded)
- Chance of flooding over 30 yrs
- 0.22%
- Est. flood insurance / yr
- $507 – $1,088
Fire risk 1/10 · Minimal
- Est. fire insurance / yr
- $659 – $1,223
Heat risk 7/10 · Major
- Hot days now (above 100°F)
- 6 days/yr
- Hot days in 30 yrs
- 17 days/yr
Wind risk 1/10 · Minimal
- Chance of severe wind over 30 yrs
- —
Air-quality risk 9/10 · Severe
- Unhealthy air days now
- 23 days/yr
- Unhealthy air days in 30 yrs
- 28 days/yr
Risk factors via First Street. Map © Google.
Why this score? — see what drove the B- grade
The composite is a weighted blend of 9 inputs, each scored 0–100. Each bar is that input's sub-score; the figure is the points it added to the 100-point composite (weight × sub-score).
- Cash flow +30.0/30.0
- 1% rule +10.0/10.0
- DSCR +10.0/10.0
- ARV discount +7.5/15.0
- Schools +3.7/10.0
- Livability +3.2/5.0
- Condition / age +2.5/5.0
- Rent growth +2.4/5.0
- Appreciation +0.0/10.0
$80,000
🖨 Deal sheet 📄 Offer letter ✓ Due diligence
Listing remarks
Welcome to 1512 E Fifth Street, a well-located 2 bed, 1 bath property in the heart of Ontario. This home offers a great opportunity for homeowners looking to purchase their first opportunity into home ownership and investors alike, featuring a functional layout, comfortable living spaces, and plenty of potential to make it your own. Conveniently located near schools, shopping, dining, and major freeways, this property provides easy access to everything the city has to offer. A wonderful opportunity to own in an established neighborhood. Manufactured Home financing available.
Key facts
- Easy access
- Well located
- Functional layout
Tags
Property features AI
Finance
- Other: Located in park named Frenwood Community
- HOA & community: Land lease: $1,433; Community setting: Suburban
Exterior
- Parking: Located in Frenwood Community park
- Utilities: Public water (district/public); Sewer or septic (unknown)
- Home design: Single-story mobile home (10 ft wide by 45 ft long); Mobile home remains on site
- Construction: Year built: other (source: Other)
- Exterior features: No pool; Lot is level/flat; Elevation measured in feet
Interior
- Bathrooms: 1 full bathroom
- Interior features: Single-level entry (Entry level 1)
- Laundry & utility: Laundry area
Neighborhood map
What this means for you Summary
Snapshot
- This is a 2-bed/1.0-bath manufactured listed at $80k.
Deal economics
- At list price, monthly cash flow is $1k ($15k/yr) — positive.
- The deal already cash-flows at list — no discount required.
- Meets the 1% rule at list price ($2k rent vs $80k).
- Recommended offer: $70k (12.0% below list) — sets the bar for market timing.
- Cap rate 24.5% vs local median 2.7% in Ontario — top-decile yield for the area; either an underpriced asset or a hidden risk that comps aren't pricing in. Stress-test before assuming the spread holds.
Location & tenants
- Location reads 63/100 on livability (#435 in CA) — a middle-class / working-renter tenant base. Strengths: commute A-, housing B+; Watch: schools F, cost of living F, health & safety F.
- Ontario-Montclair (urban): math 35% / reading 44% proficiency, ranked #731 of 1,400 in CA (top 52%) — families likely to look elsewhere, expect single-tenant / working-renter base with shorter leases; 75% free/reduced lunch — lower-income household profile, screen leases tightly.
- Market conditions: Rents soft (-0.3%/yr); 75 active listings in the ZIP; solid renter incomes; 5,458 units permitted in San Bernardino County in 2024 (1,500 in 5+ unit buildings).
- This rent runs 33% of the median local income ($82k/yr) — at the standard rent-burdened threshold; future hikes will face affordability resistance.
Forward outlook
- Local home prices are declining (-3.0%/yr); year-one equity from $553 of loan paydown is wiped out by about $2k of value loss. Plan a longer hold.
- San Bernardino County population projected at +15% by 2050 — modest demand growth; plan on rents tracking national, not racing it.
- At projected returns (-3.0% appreciation + 0.0% rent growth), your $22k cash investment doubles in ~2 years — after that, you're playing with house money.
Negotiation context
- It's been on market 133 days — a 12% lower offer ($70k) is reasonable based on typical stale-listing flexibility.
Risks & watch-outs
- Watch-outs: built in 1959 — expect roof / HVAC / electrical / plumbing capex.
- Climate carrying-cost: extreme-heat days projected 6→17/yr by 2055 (HVAC capex compounding) — expect insurance premiums to compound above CPI over the hold.
Questions for the listing agent
- It's been on market 133 days. Have you received any prior offers? Is the seller open to a 12% concession, seller financing, or rate buy-down credit?
- Built in 1959 — when were the roof, HVAC, electrical panel, plumbing, and water heater last replaced?
- Why hasn't it sold? Are there any deal-killer items the seller is aware of (foundation, flood, title, zoning, code violations)?
- Is there a deadline driving the sale (1031 exchange, divorce, estate, relocation)? That informs how much negotiation room exists.
- Schools are F-rated, which usually means shorter tenancies and higher turnover. Who's the typical renter profile here, and what's been the actual vacancy rate?
- What's the average days-on-market for RENTAL listings here right now (not sales)? A rising rental-DOM trend means longer vacancies and softer asking-rent achievability than the comps imply.
- What's the recent tenant-quality profile in this submarket — average credit score on applications, eviction rate, late-payment / NSF rate, and stable-employment percentage? A property-management company in the area should have these aggregated.
- How much new for-sale + rental construction is in the pipeline within 1–3 miles? Heavy new supply typically softens prices + rents 12–24 months out; constrained supply supports both.
Investment metrics
- 1% rule
- 2.79% ✓
- Cap rate
- 24.45%
- Cash-on-cash
- 64.86%
- DSCR
- 3.89
- GRM
- 3.0
CMA / ARV
No comps found within radius.
Projected returns pro-forma
-3.0% appreciation · 0.0% rent growth · sell at horizon
- IRR
- 60.6%
- Equity multiple
- 3.57×
- Total profit
- $57,643
- Equity at exit
- $11,928
- IRR
- 64.2%
- Equity multiple
- 6.55×
- Total profit
- $124,345
- Equity at exit
- $6,917
Cash invested: $22,400 (down + closing). Projections, not guarantees.
Landlord ↔ Tenant lean methodology
- Overall (STATE)
- 18 Strongly Tenant-Friendly
- State California
- 18 Strongly Tenant-Friendly · D+13
- County
- — inherits STATE
- City
- — inherits STATE
ZIP-level market 91764
- Rents YoY
- -0.3%
- Active inventory
- 75
- Price-to-rent
- 3.0×
Monthly cashflow live
- Estimated rent
- $2,232 medium interval (Pro) →
- Mortgage (P&I)
- −$420
- Tax est. 1.5%
- −$100 /mo · $1,200/yr
- Insurance
- −$33
- HOA
- −$0
- Vacancy / Maint / Mgmt
- −$469
- Net cashflow
- $1,211
Break-even live
UW: 25.0% down · 7.5% · 30yr · 1.5% tax · 5.0% vac · 8.0% maint · 8.0% mgmt
Financing live
Cash to close
- Down payment
- $20,000
- Closing costs
- $2,400
- Reserves months
- —
- Total cash needed
- —
Loan-product check · same deal, 3 products live
Conventional
25% down · 7.5% · 30yr
- Down + closing
- —
- Monthly P&I
- —
- Monthly cashflow
- —
- DSCR
- —
- Eligible?
- —
Personal DTI + credit; lowest rate.
DSCR
20% down · 8.5% · 30yr
- Down + closing
- —
- Monthly P&I
- —
- Monthly cashflow
- —
- DSCR
- —
- Eligible?
- —
No personal income docs; deal must DSCR.
Hard money
10% down · 12.0% · 12mo
- Down + closing
- —
- Monthly P&I
- —
- Monthly cashflow
- —
- DSCR
- —
- Eligible?
- —
Short-term bridge; refi at stabilization.
Listing history 16 events
-
2026-06-18days on market $80,000 Active 133 DOM
-
2026-06-17days on market $80,000 Active 132 DOM
-
2026-06-16days on market $80,000 Active 131 DOM
-
2026-06-15days on market $80,000 Active 130 DOM
-
2026-06-13days on market $80,000 Active 128 DOM
-
2026-06-13days on market $80,000 Active 127 DOM
-
2026-06-09days on market $80,000 Active 124 DOM
-
2026-06-08days on market $80,000 Active 123 DOM
-
2026-06-07days on market $80,000 Active 122 DOM
-
2026-06-04days on market $80,000 Active 119 DOM
-
2026-06-03days on market $80,000 Active 118 DOM
-
2026-06-02days on market $80,000 Active 117 DOM
-
2026-06-01days on market $80,000 Active 116 DOM
-
2026-05-31days on market $80,000 Active 115 DOM
-
2026-05-15price $80,000
-
2026-02-05$90,000 Active
ⓘ Source: listings_history table (triggers on properties + properties_extension) + one-shot
backfill from property_details.listing_events for pre-trigger history.
Climate risk First Street
- Flood 4/10 Moderate FEMA zone X (shaded) · 22% chance over 30 yrs
- Wildfire 1/10 Low
- Heat 7/10 Severe 6 d/yr ≥100°F today · 17 d/yr by 30 yrs out
- Wind 1/10 Low
- Air quality 9/10 Extreme 23 unhealthy d/yr today · 28 by 30 yrs out
Nearby sold comps map
Loading sold comps map…
Walkable amenities ~0.75 mi
Loading nearby amenities…
Taxation est. · year 1
- Rental income
- $26,789
- − Mortgage interest
- −$4,481
- − Property taxes
- −$1,200
- − Insurance
- −$400
- − Repairs & maintenance
- −$2,143
- − Management
- −$2,143
- − Depreciation
- −$2,327
- Taxable income
- $14,095
- Est. tax owed @ 24.0%
- −$3,383
- After-tax cash flow
- $11,147/yr
For passive investors: Depreciation is non-cash, so a rental often shows a tax loss while cash-flowing — sheltering income. Rental losses are passive: they offset passive income freely, and up to $25,000/yr can offset ordinary (W-2) income if you actively participate and your MAGI is under $100k (phasing out to $0 by $150k); unused losses carry forward. On sale, claimed depreciation is recaptured at up to 25%, and gains may owe capital-gains tax (a 1031 exchange can defer both). Figures are a year-1 estimate at your 24.0% rate — not tax advice; consult a CPA.
Schools (NCES district)
- District
- Ontario-Montclair
- NCES district ID
- 0628470
- Math proficiency
- 35% ▲ 4.00%
- Reading proficiency
- 44% ▲ 2.00%
- Median HH income
- $50,668
- Composite
- 36.57/100
- National rank
- #9282
- State rank
- #731 of 1400 in CA
Livability — Ontario
- Score
- 63/100
- State rank
- #435
- US rank
- #14949
Category grades
Schools grade is shown separately in the Schools card above.
Census & demographics
- Census place
- Ontario, CA
- County
- San Bernardino County · 2,030,291 people
- City population
- 183,440
- Metro
- Riverside-San Bernardino-Ontario, CA
- Population (ZIP)
- 56,270
- Household income
- $81,762
- Rent vs Own
- Severe rent burden
- 3075.0
Population outlook (San Bernardino County) Hauer SSP2
- Today (2025)
- 2,300,329 people
- By 2030
- 2,378,907 · +3.4%
- By 2040
- 2,523,137 · +9.7%
- By 2050
- 2,642,388 · +14.9%
- By 2075
- 2,880,769 · +25.2%
- By 2100
- 2,909,436 · +26.5%
Race, ethnicity, and origin ACS 2023
- Neighborhood character
- Predominantly Hispanic (70%)
- Race & ethnicity
- Hispanic / Latino 70% Two or more races 26% White 12% Black 8% Asian 6% Native American 2%
- Hispanic origin (detail)
- Mexican 60%
- Common ancestry
- Italian 1% Romanian 1% Serbian 1%
- Foreign-born
- 28% · Canada, China, Vietnam
- Languages at home
- 44% English-only · Spanish 50% Chinese 1% Tagalog/Filipino 1%
Political lean MEDSL · San Bernardino
- 2024 margin
- Toss-up / Even · D 47.5% · R 49.7% · Other 2.8%
- 2008→2024 swing
- -8.5pp toward R · 2008: 6.3pp · 2024: -2.1pp
- All cycles
- 2024: R+2.1 2020: D+10.7 2016: D+9.8 2012: D+5.4 2008: D+6.3
Not yet ingested
- Civics
- —
Market trends
- HPI YoY
- ▼ -571.87%
- Current HPI
- 456.8173
- Rent YoY
- ▼ -0.27%
- Metro
- Riverside-San Bernardino-Ontario, CA
- State GDP YoY
- ▲ 3.21%
- F500 in state
- 116
Industry mix (Fortune 500 HQ in CA)
| Industry | F500 HQs | Revenue |
|---|---|---|
| Technology | 27 | $1,492B |
|
||
| Financial Services | 3 | $174B |
|
||
| Retail | 3 | $44B |
|
||
| Insurance | 3 | $26B |
|
||
| Media / Entertainment | 2 | $115B |
|
||
| Pharmaceuticals / Biotech | 2 | $62B |
|
||
Price history
-11.1% since first listed2 events — show timeline
- 2026-05-15 Price Changed $80,000 CRMLS
- 2026-02-05 Listed $90,000 CRMLS
Cash-flow waterfall
monthlySold comps — $/sqft
last 12 mo · ≤1 miLoading sold comps…