 Multi-family
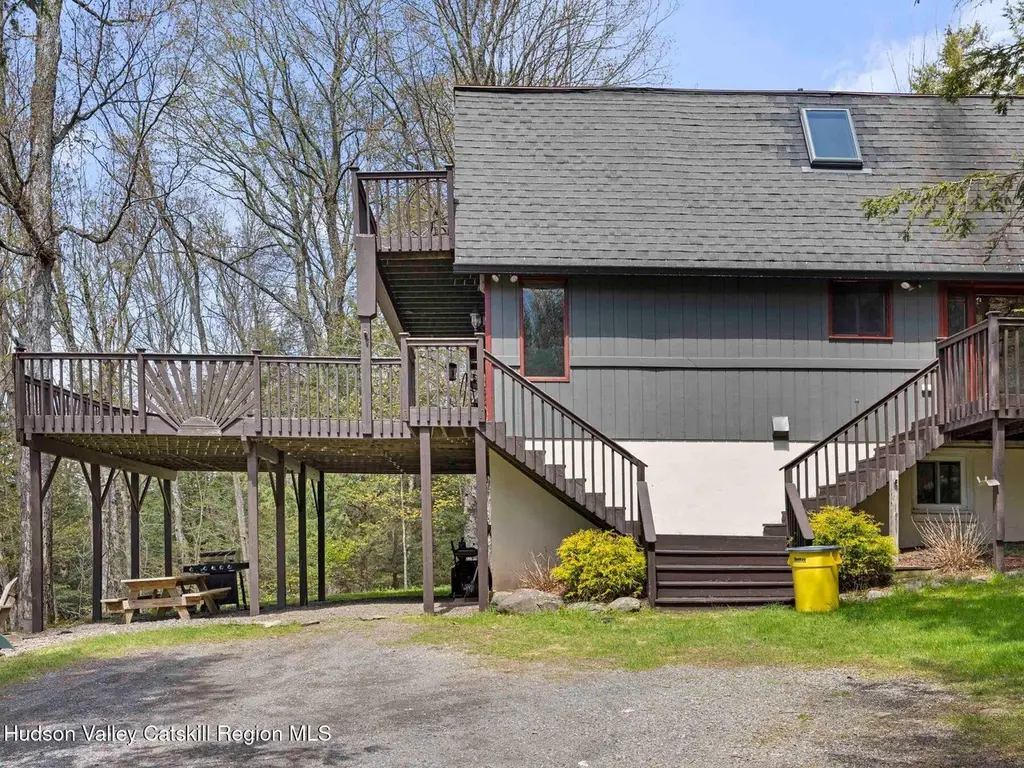
49 Chase Dr · Windham, NY
Flood risk 1/10 · Minimal
- FEMA flood zone
- X (unshaded)
- Chance of flooding over 30 yrs
- 0.0%
- Est. flood insurance / yr
- $473 – $860
Fire risk 3/10 · Minor
- Est. fire insurance / yr
- $691 – $1,283
Heat risk 1/10 · Minimal
- Hot days now (above 86°F)
- 7 days/yr
- Hot days in 30 yrs
- 17 days/yr
Wind risk 2/10 · Minimal
- Chance of severe wind over 30 yrs
- 4.0%
Air-quality risk 1/10 · Minimal
- Unhealthy air days now
- 0 days/yr
- Unhealthy air days in 30 yrs
- 0 days/yr
Risk factors via First Street. Map © Google.
Why this score? — see what drove the D+ grade
The composite is a weighted blend of 9 inputs, each scored 0–100. Each bar is that input's sub-score; the figure is the points it added to the 100-point composite (weight × sub-score).
- Cash flow +14.2/30.0
- ARV discount +7.5/15.0
- Appreciation +7.5/10.0
- DSCR +4.3/10.0
- Schools +4.3/10.0
- 1% rule +3.1/10.0
- Livability +3.0/5.0
- Rent growth +2.5/5.0
- Condition / age +2.5/5.0
$579,000
🖨 Deal sheet 📄 Offer letter ✓ Due diligence
Multi-family units
County records classify this as Multi-Family (2-4 Unit). Listing-text estimate: 1 unit. estimate disagrees with records
Listing remarks
A rare income-generating property nestled in the heart of the Catskills -- fully positioned to capitalize on year-round ski and outdoor tourism. This turnkey investment property features two self-contained apartments, each ideally suited for short-term rental on Airbnb. With ski season drawing visitors from across the region, the property's proximity to both Windham Mountain Club and Hunter Mountain ensures strong year-round demand and repeat bookings. When guests aren't on the slopes, they'll enjoy strolling the scenic Windham path -- a peaceful walkway set against sweeping mountain range views -- or venturing into the surrounding Catskill highlands, where miles of hiking trails await adve
Key facts
- Investment property
- Hunter mountain
- Airbnb
Tags
Property features AI
Exterior
- Parking: On-site parking
- Utilities: Public water; Septic tank; Cable available; Electricity connected; Water connected
- Home design: Multi-family residential income property; Residential zoning
- Construction: Frame construction with shingle siding; Asbestos shingle roof; Slab foundation; Built as multi-family (total finished area includes above- and below-grade space)
- Exterior features: Private yard; Deck; Sliding doors; Has a view
Interior
- Kitchen: Built-in range; Dishwasher; Microwave; Refrigerator; Electric water heater
- Flooring: Carpet; Hardwood; Tile
- Heating & cooling: Baseboard heat; Electric heating; Wood stove
- Interior features: High-speed internet; Kitchen island
- Laundry & utility: Washer and dryer; Dryer
Neighborhood map
What this means for you Summary
Snapshot
- This is a 6-bed/3.0-bath multifamily listed at $579k.
Deal economics
- At list price, monthly cash flow is $99 ($1k/yr) — positive.
- The deal already cash-flows at list — no discount required.
- To meet the 1% rule (rent ≥ 1% of price), the offer needs to be $468k (19.2% below list).
- Recommended offer: $468k (19.2% below list) — sets the bar for 1% rule.
- Cap rate 6.5% vs local median 3.4% in Windham — top-decile yield for the area; either an underpriced asset or a hidden risk that comps aren't pricing in. Stress-test before assuming the spread holds.
Location & tenants
- Location reads 60/100 on livability (#964 in NY) — a middle-class / working-renter tenant base. Strengths: housing A+, employment B+; Watch: schools C-, crime D+, cost of living D+.
- Windham-Ashland-Jewett Central School District (rural): math 55% / reading 40% proficiency, ranked #517 of 755 in NY (top 68%) — families likely to look elsewhere, expect single-tenant / working-renter base with shorter leases.
- Market conditions: 141 active listings in the ZIP; 97 units permitted in Greene County in 2024 (0 in 5+ unit buildings).
Forward outlook
- In year one you build about $33k of equity ($4k loan paydown + $29k appreciation (5.1% local appreciation)).
- Greene County population projected at -22% by 2050 — secular population decline; favor cash flow + early exit over multi-decade hold.
- At projected returns (5.1% appreciation + 3.0% rent growth), your $162k cash investment doubles in ~5 years — after that, you're playing with house money.
- By year 2, paydown + projected appreciation supports a ~$53k cash-out refi (75% LTV) — recoverable capital for the next deal without selling this one.
Negotiation context
- It's been on market 38 days — a 3% lower offer ($562k) is reasonable based on typical stale-listing flexibility.
- 4 sale attempts since 10y ago with the ask held roughly flat each time — persistent listings suggest the price (not the market) is what's stuck; bring a comps-based counter.
- Current owner paid $200k; list at $579k implies a 190% gain — meaningful room to come down on a strong offer.
Questions for the listing agent
- It's been on market 38 days. Have you received any prior offers? Is the seller open to a 19% concession, seller financing, or rate buy-down credit?
- Is there a deadline driving the sale (1031 exchange, divorce, estate, relocation)? That informs how much negotiation room exists.
- Crime grade is D in this area — have there been break-ins, vandalism, or insurance claims at this property in the last 3 years? What carrier currently insures it and at what premium?
- The area grade is low — what's the realistic commute time and amenity access for the typical tenant pool here? Any planned neighborhood developments (good or bad) we should know about?
- What's the average days-on-market for RENTAL listings here right now (not sales)? A rising rental-DOM trend means longer vacancies and softer asking-rent achievability than the comps imply.
- What's the recent tenant-quality profile in this submarket — average credit score on applications, eviction rate, late-payment / NSF rate, and stable-employment percentage? A property-management company in the area should have these aggregated.
- How much new apartment / multifamily construction is in the pipeline within 1–3 miles? Heavy new supply (>2% of stock underway) typically softens rents 12–24 months out; light construction supports rent growth.
Investment metrics
- 1% rule
- 0.81% ✗
- Cap rate
- 6.50%
- Cash-on-cash
- 0.73%
- DSCR
- 1.03
- GRM
- 10.3
CMA / ARV
No comps found within radius.
Projected returns pro-forma
5.06% appreciation · 3.0% rent growth · sell at horizon
- IRR
- 13.6%
- Equity multiple
- 1.87×
- Total profit
- $141,404
- Equity at exit
- $330,085
- IRR
- 14.4%
- Equity multiple
- 3.60×
- Total profit
- $420,954
- Equity at exit
- $571,319
Cash invested: $162,120 (down + closing). Projections, not guarantees.
Landlord ↔ Tenant lean methodology
- Overall (STATE)
- 15 Strongly Tenant-Friendly
- State New York
- 15 Strongly Tenant-Friendly · D+10
- County
- — inherits STATE
- City
- — inherits STATE
ZIP-level market 12496
- Home prices YoY
- 1.2%
- Active inventory
- 141
- Price-to-rent
- 20.6×
Monthly cashflow live
- Estimated rent
- $4,679 medium interval (Pro) →
- Mortgage (P&I)
- −$3,036
- Tax from tax record
- −$320 /mo · $3,843/yr
- Insurance
- −$241
- HOA
- −$0
- Vacancy / Maint / Mgmt
- −$983
- Net cashflow
- $99
Break-even live
2-unit breakdown (identical units grouped — click to expand)
| Units | Beds | Baths | Est. rent |
|---|---|---|---|
| 2× units | 2 | 1 | $4,680 |
| #1 | 2 | 1 | $2,340 |
| #2 | 2 | 1 | $2,340 |
| Total (2 units) | $4,679 | ||
UW: 25.0% down · 7.5% · 30yr · 1.5% tax · 5.0% vac · 8.0% maint · 8.0% mgmt
Financing live
Cash to close
- Down payment
- $144,750
- Closing costs
- $17,370
- Reserves months
- —
- Total cash needed
- —
Loan-product check · same deal, 3 products live
Conventional
25% down · 7.5% · 30yr
- Down + closing
- —
- Monthly P&I
- —
- Monthly cashflow
- —
- DSCR
- —
- Eligible?
- —
Personal DTI + credit; lowest rate.
DSCR
20% down · 8.5% · 30yr
- Down + closing
- —
- Monthly P&I
- —
- Monthly cashflow
- —
- DSCR
- —
- Eligible?
- —
No personal income docs; deal must DSCR.
Hard money
10% down · 12.0% · 12mo
- Down + closing
- —
- Monthly P&I
- —
- Monthly cashflow
- —
- DSCR
- —
- Eligible?
- —
Short-term bridge; refi at stabilization.
Listing history 20 events
-
2026-06-18days on market $579,000 Active 38 DOM
-
2026-06-17days on market $579,000 Active 37 DOM
-
2026-06-16days on market $579,000 Active 36 DOM
-
2026-06-15days on market $579,000 Active 35 DOM
-
2026-06-13days on market $579,000 Active 33 DOM
-
2026-06-12days on market $579,000 Active 32 DOM
-
2026-06-09days on market $579,000 Active 29 DOM
-
2026-06-08days on market $579,000 Active 28 DOM
-
2026-06-07days on market $579,000 Active 27 DOM
-
2026-06-07days on market $579,000 Active 26 DOM
-
2026-06-04days on market $579,000 Active 23 DOM
-
2026-06-02days on market $579,000 Active 22 DOM
-
2026-06-01days on market $579,000 Active 21 DOM
-
2026-05-31days on market $579,000 Active 20 DOM
-
2026-05-11$579,000 Active 1027-char remark
-
2023-12-10$575,000
-
2023-12-08$575,000
-
2016-10-31soldstatus $200,000
-
2016-10-28soldstatus $200,000
-
2016-02-10$224,000
ⓘ Source: listings_history table (triggers on properties + properties_extension) + one-shot
backfill from property_details.listing_events for pre-trigger history.
Tax reassessment forecast NY · Partial reset (capped growth)
- Current annual tax
- $3,843 · $320/mo
- Projected year-2 tax
- $6,814 · $568/mo
- Expected delta
- +$2,971/yr (+$248/mo · 77.3%)
ⓘ Screening estimate from a state-policy table — verify with the county assessor before closing.
Climate risk First Street
- Flood 1/10 Low FEMA zone X (unshaded) · 0% chance over 30 yrs
- Wildfire 3/10 Moderate
- Heat 1/10 Low 7 d/yr ≥86°F today · 17 d/yr by 30 yrs out
- Wind 2/10 Low 4% chance of damaging wind over 30 yrs
- Air quality 1/10 Low 0 unhealthy d/yr today · 0 by 30 yrs out
Nearby sold comps map
Loading sold comps map…
Walkable amenities ~0.75 mi
Loading nearby amenities…
Taxation est. · year 1
- Rental income
- $56,148
- − Mortgage interest
- −$32,433
- − Property taxes
- −$3,843
- − Insurance
- −$2,895
- − Repairs & maintenance
- −$4,492
- − Management
- −$4,492
- − Depreciation
- −$16,844
- Taxable loss
- −$8,851
- Est. tax savings @ 24.0%
- +$2,124
- After-tax cash flow
- $3,307/yr
For passive investors: Depreciation is non-cash, so a rental often shows a tax loss while cash-flowing — sheltering income. Rental losses are passive: they offset passive income freely, and up to $25,000/yr can offset ordinary (W-2) income if you actively participate and your MAGI is under $100k (phasing out to $0 by $150k); unused losses carry forward. On sale, claimed depreciation is recaptured at up to 25%, and gains may owe capital-gains tax (a 1031 exchange can defer both). Figures are a year-1 estimate at your 24.0% rate — not tax advice; consult a CPA.
Schools (NCES district)
- District
- Windham-Ashland-Jewett Central School District
- NCES district ID
- 3631590
- Math proficiency
- 55% ▲ 5.00%
- Reading proficiency
- 40% ▼ -10.00%
- Median HH income
- $46,942
- Composite
- 42.57/100
- National rank
- #6842
- State rank
- #517 of 755 in NY
Livability — Windham
- Score
- 60/100
- State rank
- #964
- US rank
- #18888
Category grades
Schools grade is shown separately in the Schools card above.
Census & demographics
- Population (ZIP)
- 1,241
Population outlook (Greene County) Hauer SSP2
- Today (2025)
- 44,963 people
- By 2030
- 43,126 · -4.1%
- By 2040
- 38,756 · -13.8%
- By 2050
- 34,913 · -22.4%
- By 2075
- 28,156 · -37.4%
- By 2100
- 22,296 · -50.4%
Race, ethnicity, and origin ACS 2023
- Neighborhood character
- Predominantly White (84%)
- Race & ethnicity
- White 84% Two or more races 5% Black 5% Hispanic / Latino 3% Asian 2%
- Common ancestry
- Romanian 5% Hispanic 4% Lithuanian 3%
- Foreign-born
- 18% · Canada
- Languages at home
- 75% English-only · Russian/Polish/Slavic 10% French/Haitian/Cajun 7% Other Indo-European 4%
Political lean MEDSL · Greene
- 2024 margin
- R (+17.0) · D 41.5% · R 58.5%
- 2008→2024 swing
- -7.1pp toward R · 2008: -9.9pp · 2024: -17.0pp
- All cycles
- 2024: R+17.0 2020: R+15.6 2016: R+27.4 2012: R+11.1 2008: R+9.9
Not yet ingested
- Civics
- —
Market trends
- HPI YoY
- ▲ 5.06%
- Current HPI
- 425.2138
- Rent YoY
- —
- Metro
- —
- State GDP YoY
- ▲ 2.60%
- F500 in state
- 92
Industry mix (Fortune 500 HQ in NY)
| Industry | F500 HQs | Revenue |
|---|---|---|
| Financial Services | 10 | $950B |
|
||
| Consumer Goods | 9 | $162B |
|
||
| Insurance | 4 | $225B |
|
||
| Telecommunications | 2 | $144B |
|
||
| Pharmaceuticals | 2 | $112B |
|
||
| Media / Entertainment | 2 | $69B |
|
||
Price history
+158.5% since first listed6 events — show timeline
- 2026-05-11 Listed $579,000 HVCRMLS
- 2023-12-10 Listed $575,000 HVCRMLS
- 2023-12-08 Listed $575,000 HVCRMLS
- 2016-10-31 Sold (Public Records) $200,000 Public Records
- 2016-10-28 Sold (MLS) $200,000 HVCRMLS
- 2016-02-10 Listed $224,000 HVCRMLS
Property tax history
+1.8%/yrLatest (2025): $3,843 · +4.1% YoY. Source: county tax records.
Cash-flow waterfall
monthlySold comps — $/sqft
last 12 mo · ≤1 miLoading sold comps…