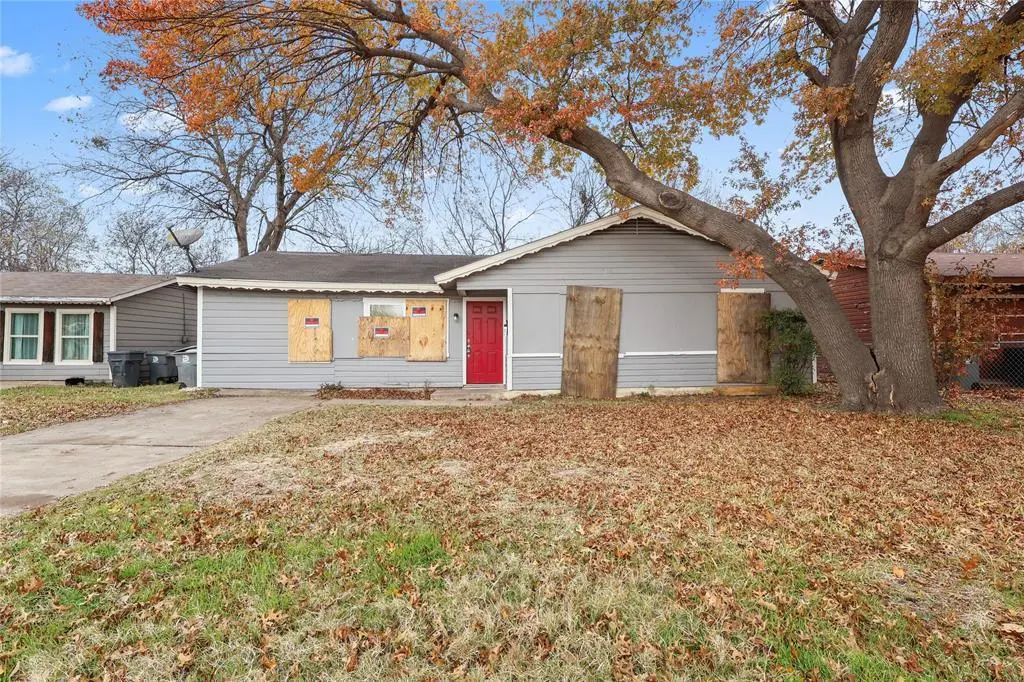
725 Emberwood Dr · Dallas, TX
Flood risk 1/10 · Minimal
- FEMA flood zone
- X (unshaded)
- Chance of flooding over 30 yrs
- 0.0%
- Est. flood insurance / yr
- $507 – $1,088
Fire risk 1/10 · Minimal
- Est. fire insurance / yr
- $1,222 – $2,270
Heat risk 7/10 · Major
- Hot days now (above 109°F)
- 7 days/yr
- Hot days in 30 yrs
- 24 days/yr
Wind risk 6/10 · Moderate
- Chance of severe wind over 30 yrs
- 27.0%
Air-quality risk 2/10 · Minimal
- Unhealthy air days now
- 1 days/yr
- Unhealthy air days in 30 yrs
- 2 days/yr
Risk factors via First Street. Map © Google.
Why this score? — see what drove the C grade
The composite is a weighted blend of 9 inputs, each scored 0–100. Each bar is that input's sub-score; the figure is the points it added to the 100-point composite (weight × sub-score).
- Cash flow +19.8/30.0
- ARV discount +15.0/15.0
- 1% rule +7.0/10.0
- DSCR +6.3/10.0
- Livability +4.0/5.0
- Schools +2.8/10.0
- Rent growth +2.5/5.0
- Condition / age +2.5/5.0
- Appreciation +0.0/10.0
$159,900
🖨 Deal sheet 📄 Offer letter ✓ Due diligence
Listing remarks MLS
Layout includes 4 bedrooms, 1 bathroom, an open living area, and a converted garage space. The property also features a large fenced backyard. Located near Camp Wisdom with quick access to Hwy 35E, UNT Dallas, shopping, and restaurants. Ideal opportunity for investors or buyers seeking a renovation project.
Key facts
- Near camp wisdom
- Open living area
- 7,667 sq ft lot
Tags
Neighborhood map
What this means for you Summary
Snapshot
- This is a 4-bed/1.0-bath single-family listed at $160k.
Deal economics
- At list price, monthly cash flow is $191 ($2k/yr) — positive.
- The deal already cash-flows at list — no discount required.
- Meets the 1% rule at list price ($2k rent vs $160k).
- Recommended offer: $141k (12.0% below list) — sets the bar for market timing.
- Cap rate 7.7% vs local median 2.3% in Dallas — top-decile yield for the area; either an underpriced asset or a hidden risk that comps aren't pricing in. Stress-test before assuming the spread holds.
Location & tenants
- Location reads 81/100 on livability (#24 in TX, #1,380 nationally) — a professional / high-income tenant draw. Strengths: amenities A+, commute A+, housing A+; Watch: schools C-, crime F.
- Dallas ISD (urban): math 31% / reading 36% proficiency, ranked #559 of 826 in TX (top 68%) — families likely to look elsewhere, expect single-tenant / working-renter base with shorter leases; 83% free/reduced lunch — lower-income household profile, screen leases tightly.
- Market conditions: 98 active listings in the ZIP; 32 comparable units currently listed for rent nearby; rentals leasing fast (median 8d on market — plan ~1-2 weeks tenant-placement turnaround); 12,577 units permitted in Dallas County in 2024 (6,829 in 5+ unit buildings).
Forward outlook
- Local home prices are declining (-3.0%/yr); year-one equity from $1k of loan paydown is wiped out by about $5k of value loss. Plan a longer hold.
- Dallas County population projected at +35% by 2050 — long-run rental-demand tailwind backs the buy-and-hold thesis.
Negotiation context
- It's been on market 181 days — a 12% lower offer ($141k) is reasonable based on typical stale-listing flexibility.
- 5 sale attempts since 23y ago; this cycle's ask has dropped $30k (16%) from the opening price — seller is motivated, your offer sets the floor, not the list.
Risks & watch-outs
- Watch-outs: property tax is 3.1% of price; built in 1956 — expect roof / HVAC / electrical / plumbing capex.
- Climate carrying-cost: major wind risk, 27% chance of damaging wind over 30y; extreme-heat days projected 7→24/yr by 2055 (HVAC capex compounding) — expect insurance premiums to compound above CPI over the hold.
Questions for the listing agent
- It's been on market 181 days. Have you received any prior offers? Is the seller open to a 12% concession, seller financing, or rate buy-down credit?
- Built in 1956 — when were the roof, HVAC, electrical panel, plumbing, and water heater last replaced?
- Property tax is high relative to price — has the assessment been appealed recently, and will the sale trigger a re-assessment?
- Why hasn't it sold? Are there any deal-killer items the seller is aware of (foundation, flood, title, zoning, code violations)?
- Is there a deadline driving the sale (1031 exchange, divorce, estate, relocation)? That informs how much negotiation room exists.
- Crime grade is F in this area — have there been break-ins, vandalism, or insurance claims at this property in the last 3 years? What carrier currently insures it and at what premium?
- What's the average days-on-market for RENTAL listings here right now (not sales)? A rising rental-DOM trend means longer vacancies and softer asking-rent achievability than the comps imply.
- What's the recent tenant-quality profile in this submarket — average credit score on applications, eviction rate, late-payment / NSF rate, and stable-employment percentage? A property-management company in the area should have these aggregated.
- How much new for-sale + rental construction is in the pipeline within 1–3 miles? Heavy new supply typically softens prices + rents 12–24 months out; constrained supply supports both.
Investment metrics
- 1% rule
- 1.20% ✓
- Cap rate
- 7.72%
- Cash-on-cash
- 5.11%
- DSCR
- 1.23
- GRM
- 7.0
CMA / ARV
- ARV (median comp)
- $213,664
- List price
- $159,900
- Delta
- -25.16%
- Verdict
- UNDERPRICED
- Comps
- 20 within 1.0 mi
Show comp detail 12 sales within ~0.75 mi
| Address | Dist | Beds/Ba | Sqft | Sold | Price | $/sf | Match |
|---|---|---|---|---|---|---|---|
| 821 Goldwood Dr | 0.23mi | 3/2.0 (-1) | 1,284 (0%) | 0mo | $239,000 | $186 | 80 |
| 740 Goldwood Dr | 0.15mi | 4/2.0 | 1,339 (+4%) | 3mo | $239,900 | $179 | 80 |
| 751 Ivywood Dr | 0.25mi | 4/2.0 | 1,330 (+4%) | 0mo | $235,000 | $177 | 78 |
| 7207 Greenspan Ave | 0.14mi | 3/2.0 (-1) | 1,188 (-8%) | 1mo | $175,000 | $147 | 71 |
| 625 Midvale Dr | 0.33mi | 4/1.0 | 1,178 (-8%) | 2mo | $159,900 | $136 | 69 |
| 6946 Trailcrest Dr | 0.33mi | 3/2.0 (-1) | 1,327 (+3%) | 3mo | $232,000 | $175 | 68 |
| 7917 Woodshire Dr | 0.66mi | 3/1.0 (-1) | 1,294 (+1%) | 1mo | $149,900 | $116 | 62 |
| 7815 Woodshire Dr | 0.57mi | 3/1.0 (-1) | 1,240 (-3%) | 2mo | $159,900 | $129 | 61 |
| 721 Ivywood Dr | 0.24mi | 3/1.0 (-1) | 1,092 (-15%) | 1mo | $130,000 | $119 | 58 |
| 612 Highcrest Dr | 0.37mi | 3/1.0 (-1) | 1,140 (-11%) | 2mo | $180,000 | $158 | 57 |
| 728 Oceanview Dr | 0.71mi | 3/2.0 (-1) | 1,282 (-0%) | 1mo | $257,000 | $200 | 57 |
| 226 Bettyrae Way | 0.64mi | 3/2.0 (-1) | 1,208 (-6%) | 2mo | $154,900 | $128 | 49 |
Match score weights: distance 35% · size 25% · config 20% · recency 20%. Top-matched comps best support the ARV.
Projected returns pro-forma
-3.0% appreciation · 3.0% rent growth · sell at horizon
- IRR
- -8.3%
- Equity multiple
- 0.70×
- Total profit
- $-13,604
- Equity at exit
- $23,842
- IRR
- 1.4%
- Equity multiple
- 1.10×
- Total profit
- $4,454
- Equity at exit
- $13,825
Cash invested: $44,772 (down + closing). Projections, not guarantees.
Landlord ↔ Tenant lean methodology
- Overall (STATE)
- 87 Strongly Landlord-Friendly
- State Texas
- 87 Strongly Landlord-Friendly · R+5
- County
- — inherits STATE
- City
- — inherits STATE
ZIP-level market 75232
- Home prices YoY
- -4.0%
- Active inventory
- 98
- Price-to-rent
- 7.0×
Monthly cashflow live
- Estimated rent
- $1,917 high interval (Pro) →
- Mortgage (P&I)
- −$839
- Tax from tax record
- −$419 /mo · $5,022/yr
- Insurance
- −$67
- HOA
- −$0
- Vacancy / Maint / Mgmt
- −$403
- Net cashflow
- $191
Break-even live
UW: 25.0% down · 7.5% · 30yr · 1.5% tax · 5.0% vac · 8.0% maint · 8.0% mgmt
Financing live
Cash to close
- Down payment
- $39,975
- Closing costs
- $4,797
- Reserves months
- —
- Total cash needed
- —
Loan-product check · same deal, 3 products live
Conventional
25% down · 7.5% · 30yr
- Down + closing
- —
- Monthly P&I
- —
- Monthly cashflow
- —
- DSCR
- —
- Eligible?
- —
Personal DTI + credit; lowest rate.
DSCR
20% down · 8.5% · 30yr
- Down + closing
- —
- Monthly P&I
- —
- Monthly cashflow
- —
- DSCR
- —
- Eligible?
- —
No personal income docs; deal must DSCR.
Hard money
10% down · 12.0% · 12mo
- Down + closing
- —
- Monthly P&I
- —
- Monthly cashflow
- —
- DSCR
- —
- Eligible?
- —
Short-term bridge; refi at stabilization.
Rent comps 32 comps
| Address | Beds | Baths | Sqft | Rent | $/sqft | DOM | Units | Dist |
|---|---|---|---|---|---|---|---|---|
| 815 Havenwood Dr Dallas, TX | 3.0 | 1.5 | 1666 | $2,300 | $1.38 | 7d | 1 | 0.24mi |
| 7704 Woodspan Dr Dallas, TX | 3.0 | 1.0 | 1355 | $1,700 | $1.25 | 7d | 1 | 0.31mi |
| 7207 Arborcrest Dr Dallas, TX | 3.0 | 1.0 | 1149 | $1,695 | $1.48 | 14d | 1 | 0.31mi |
| 925 Bluewood Dr Dallas, TX | 4.0 | 2.0 | 1670 | $2,000 | $1.20 | 43d | 1 | 0.31mi |
| 922 Havenwood Dr Dallas, TX | 3.0 | 1.5 | 1714 | $2,200 | $1.28 | 43d | 1 | 0.36mi |
| 405 Highcrest Dr Dallas, TX | 3.0 | 1.0 | 1171 | $1,675 | $1.43 | 43d | 1 | 0.38mi |
| 308 Longridge Dr Dallas, TX | 3.0 | 2.0 | 1687 | $2,040 | $1.21 | 7d | 1 | 0.38mi |
| 7027 Coleshire Dr Dallas, TX | 3.0 | 1.0 | 1178 | $2,100 | $1.78 | 3d | 1 | 0.40mi |
| 511 Highcrest Dr Dallas, TX | 3.0 | 2.0 | 1513 | $1,700 | $1.12 | 43d | 1 | 0.41mi |
| 7826 Overridge Dr Dallas, TX | 4.0 | 1.0 | 1307 | $1,650 | $1.26 | 7d | 1 | 0.49mi |
| 7842 Overridge Dr Dallas, TX | 4.0 | 2.0 | 1300 | $1,650 | $1.27 | 24d | 1 | 0.52mi |
| 7924 Silverdale Dr Dallas, TX | 3.0 | 2.0 | 1180 | $1,795 | $1.52 | 24d | 1 | 0.54mi |
| 7924 Silverdale Dr Dallas, TX | 3.0 | 2.0 | 1540 | $1,795 | $1.17 | 7d | 1 | 0.54mi |
| 624 Oceanview Dr Dallas, TX | 3.0 | 2.0 | 1730 | $1,950 | $1.13 | 7d | 1 | 0.69mi |
| 247 Cliff Heights Cir Dallas, TX | 3.0 | 2.0 | 1166 | $1,775 | $1.52 | 7d | 1 | 0.73mi |
| 1256 Golden Trophy Dr Dallas, TX | 3.0 | 2.0 | 1566 | $2,750 | $1.76 | 1d | 1 | 0.74mi |
| 1336 Mill Stream Dr Dallas, TX | 3.0 | 2.0 | 1290 | $1,775 | $1.38 | 7d | 1 | 0.84mi |
| 8206 Willoughby Blvd Dallas, TX | 1.0–3.0 | 1.0–2.0 | 901 | $1,450 | $1.61 | 43d | 7 | 0.86mi |
| 1320 Cleardale Dr Dallas, TX | 3.0 | 2.0 | 1170 | $1,999 | $1.71 | 7d | 1 | 0.91mi |
| 8022 Genesis Dr Dallas, TX | 3.0 | 2.0 | 1399 | $2,000 | $1.43 | 2d | 1 | 0.94mi |
| 104 Idlewheat Ln Dallas, TX | 3.0 | 2.0 | 1820 | $2,000 | $1.10 | 20d | 1 | 0.95mi |
| 1777 Westerham Dr Dallas, TX | 3.0 | 3.0 | 1300 | $1,795 | $1.38 | 43d | 1 | 0.97mi |
| 144 Triumph Rd Dallas, TX | 3.0 | 2.0 | 1820 | $2,130 | $1.17 | 43d | 1 | 0.98mi |
| 7709 Reese St Dallas, TX | 4.0 | 2.0 | 1707 | $2,300 | $1.35 | 14d | 1 | 1.07mi |
| 7225 Harold Walker Dr Dallas, TX | 4.0 | 2.0 | 1458 | $1,975 | $1.35 | 2d | 1 | 1.15mi |
| 7326 Harold Walker Dr Dallas, TX | 3.0 | 1.5 | 1008 | $1,650 | $1.64 | 7d | 1 | 1.17mi |
| 704 Panola Dr Dallas, TX | 3.0 | 2.0 | 1359 | $2,030 | $1.49 | 7d | 1 | 1.19mi |
| 7324 Buford Dr Dallas, TX | 3.0 | 2.0 | 1405 | $2,011 | $1.43 | 15d | 1 | 1.22mi |
| 735 Panola Dr Dallas, TX | 3.0 | 2.0 | 1276 | $1,865 | $1.46 | 7d | 1 | 1.25mi |
| 7422 Amber Dr Dallas, TX | 4.0 | 2.0 | 1621 | $2,079 | $1.28 | 7d | 1 | 1.27mi |
| 7463 Concordia Ln Dallas, TX | 3.0 | 2.0 | 1728 | $2,100 | $1.22 | 44d | 1 | 1.30mi |
| 7808 S Hampton Rd Dallas, TX | 2.0–3.0 | 2.0 | 1064 | $2,100 | $1.97 | 43d | 3 | 1.41mi |
Listing history 28 events
-
2026-06-18days on market $159,900 Active 181 DOM
-
2026-06-17days on market $159,900 Active 180 DOM
-
2026-06-16days on market $159,900 Active 179 DOM
-
2026-06-15days on market $159,900 Active 178 DOM
-
2026-06-13days on market $159,900 Active 176 DOM
-
2026-06-09days on market $159,900 Active 172 DOM
-
2026-06-08days on market $159,900 Active 171 DOM
-
2026-06-07days on market $159,900 Active 170 DOM
-
2026-06-04pricedays on market $159,900 Active 167 DOM
-
2026-06-03days on market $164,900 Active 166 DOM
-
2026-06-02days on market $164,900 Active 165 DOM
-
2026-06-02days on market $164,900 Active 164 DOM
-
2026-05-31days on market $164,900 Active 163 DOM
-
2026-05-05price $164,900 308-char remark
Show marketing remark (308 chars)
Layout includes 4 bedrooms, 1 bathroom, an open living area, and a converted garage space. The property also features a large fenced backyard. Located near Camp Wisdom with quick access to Hwy 35E, UNT Dallas, shopping, and restaurants. Ideal opportunity for investors or buyers seeking a renovation project.
-
2026-04-03price $169,900 308-char remark
Show marketing remark (308 chars)
Layout includes 4 bedrooms, 1 bathroom, an open living area, and a converted garage space. The property also features a large fenced backyard. Located near Camp Wisdom with quick access to Hwy 35E, UNT Dallas, shopping, and restaurants. Ideal opportunity for investors or buyers seeking a renovation project.
-
2026-03-06price $174,900 308-char remark
Show marketing remark (308 chars)
Layout includes 4 bedrooms, 1 bathroom, an open living area, and a converted garage space. The property also features a large fenced backyard. Located near Camp Wisdom with quick access to Hwy 35E, UNT Dallas, shopping, and restaurants. Ideal opportunity for investors or buyers seeking a renovation project.
-
2026-02-16price $179,900 308-char remark
Show marketing remark (308 chars)
Layout includes 4 bedrooms, 1 bathroom, an open living area, and a converted garage space. The property also features a large fenced backyard. Located near Camp Wisdom with quick access to Hwy 35E, UNT Dallas, shopping, and restaurants. Ideal opportunity for investors or buyers seeking a renovation project.
-
2026-01-18price $184,900 308-char remark
Show marketing remark (308 chars)
Layout includes 4 bedrooms, 1 bathroom, an open living area, and a converted garage space. The property also features a large fenced backyard. Located near Camp Wisdom with quick access to Hwy 35E, UNT Dallas, shopping, and restaurants. Ideal opportunity for investors or buyers seeking a renovation project.
-
2025-12-19$189,900 Active 308-char remark
Show marketing remark (308 chars)
Layout includes 4 bedrooms, 1 bathroom, an open living area, and a converted garage space. The property also features a large fenced backyard. Located near Camp Wisdom with quick access to Hwy 35E, UNT Dallas, shopping, and restaurants. Ideal opportunity for investors or buyers seeking a renovation project.
-
2024-08-13status Active
-
2024-03-23$223,000 Active
-
2023-12-07price $244,000
-
2023-10-28$249,000 Active
-
2023-07-17soldstatus
-
2003-11-12soldstatus
-
2003-09-12historical
-
2003-06-12$66,900
-
1988-01-22soldstatus
ⓘ Source: listings_history table (triggers on properties + properties_extension) + one-shot
backfill from property_details.listing_events for pre-trigger history.
Tax reassessment forecast TX · Resets to sale price
- Current annual tax
- $5,022 · $419/mo
- Projected year-2 tax
- $5,022 · $419/mo
- Expected delta
- $0/yr ($0/mo · 0.0%)
ⓘ Screening estimate from a state-policy table — verify with the county assessor before closing.
Climate risk First Street
- Flood 1/10 Low FEMA zone X (unshaded) · 0% chance over 30 yrs
- Wildfire 1/10 Low
- Heat 7/10 Severe 7 d/yr ≥109°F today · 24 d/yr by 30 yrs out
- Wind 6/10 Major 27% chance of damaging wind over 30 yrs
- Air quality 2/10 Low 1 unhealthy d/yr today · 2 by 30 yrs out
Nearby sold comps map
Loading sold comps map…
Walkable amenities ~0.75 mi
Loading nearby amenities…
Taxation est. · year 1
- Rental income
- $23,003
- − Mortgage interest
- −$8,957
- − Property taxes
- −$5,022
- − Insurance
- −$800
- − Repairs & maintenance
- −$1,840
- − Management
- −$1,840
- − Depreciation
- −$4,652
- Taxable loss
- −$108
- Est. tax savings @ 24.0%
- +$26
- After-tax cash flow
- $2,314/yr
For passive investors: Depreciation is non-cash, so a rental often shows a tax loss while cash-flowing — sheltering income. Rental losses are passive: they offset passive income freely, and up to $25,000/yr can offset ordinary (W-2) income if you actively participate and your MAGI is under $100k (phasing out to $0 by $150k); unused losses carry forward. On sale, claimed depreciation is recaptured at up to 25%, and gains may owe capital-gains tax (a 1031 exchange can defer both). Figures are a year-1 estimate at your 24.0% rate — not tax advice; consult a CPA.
Schools (NCES district)
- District
- Dallas ISD
- NCES district ID
- 4816230
- Math proficiency
- 31% ▼ -16.00%
- Reading proficiency
- 36% ▼ -4.00%
- Median HH income
- $42,881
- Composite
- 28.41/100
- National rank
- #6763
- State rank
- #559 of 826 in TX
Livability — Dallas
- Score
- 81/100
- State rank
- #24
- US rank
- #1380
Category grades
Schools grade is shown separately in the Schools card above.
Census & demographics
- Census place
- Dallas, TX
- City population
- 1,168,437
- Population (ZIP)
- 32,967
Population outlook (Dallas County) Hauer SSP2
- Today (2025)
- 2,979,839 people
- By 2030
- 3,191,823 · +7.1%
- By 2040
- 3,619,611 · +21.5%
- By 2050
- 4,026,915 · +35.1%
- By 2075
- 4,957,073 · +66.4%
- By 2100
- 5,508,725 · +84.9%
Race, ethnicity, and origin ACS 2023
- Neighborhood character
- Diverse neighborhood (Simpson 0.56)
- Race & ethnicity
- Black 49% Hispanic / Latino 45% Two or more races 20% White 5% Native American 1%
- Hispanic origin (detail)
- Mexican 39%
- Common ancestry
- Serbian 1%
- Foreign-born
- 17% · Canada
- Languages at home
- 64% English-only · Spanish 35%
Political lean MEDSL · Dallas
- 2024 margin
- Strong D (+22.2) · D 60.2% · R 38.0% · Other 1.8%
- 2008→2024 swing
- +6.9pp toward D · 2008: 15.3pp · 2024: 22.2pp
- All cycles
- 2024: D+22.2 2020: D+31.6 2016: D+26.2 2012: D+15.4 2008: D+15.3
Not yet ingested
- Civics
- —
Market trends
- HPI YoY
- ▼ -16.24%
- Current HPI
- 389.7618
- Rent YoY
- —
- Metro
- —
- State GDP YoY
- ▲ 3.95%
- F500 in state
- 110
Industry mix (Fortune 500 HQ in TX)
| Industry | F500 HQs | Revenue |
|---|---|---|
| Energy | 16 | $1,198B |
|
||
| Technology | 5 | $198B |
|
||
| Engineering / Construction | 4 | $72B |
|
||
| Energy Services | 3 | $60B |
|
||
| Utilities | 3 | $41B |
|
||
| Healthcare | 2 | $330B |
|
||
Price history
+146.5% since first listed15 events — show timeline
- 2026-05-05 Price Changed $164,900 NTREIS
- 2026-04-03 Price Changed $169,900 NTREIS
- 2026-03-06 Price Changed $174,900 NTREIS
- 2026-02-16 Price Changed $179,900 NTREIS
- 2026-01-18 Price Changed $184,900 NTREIS
- 2025-12-19 Listed $189,900 NTREIS
- 2024-08-13 Relisted — NTREIS
- 2024-03-23 Listed $223,000 NTREIS
- 2023-12-07 Price Changed $244,000 NTREIS
- 2023-10-28 Listed $249,000 NTREIS
- 2023-07-17 Sold (Public Records) — Public Records
- 2003-11-12 Sold (Public Records) — Public Records
- 2003-09-12 Listing Removed — NTREIS
- 2003-06-12 Listed $66,900 NTREIS
- 1988-01-22 Sold (Public Records) — Public Records
Property tax history
+8.6%/yrLatest (2025): $5,022 · -0.4% YoY. Source: county tax records.
Cash-flow waterfall
monthlySold comps — $/sqft
last 12 mo · ≤1 miLoading sold comps…