 🏷️ Likely Rental
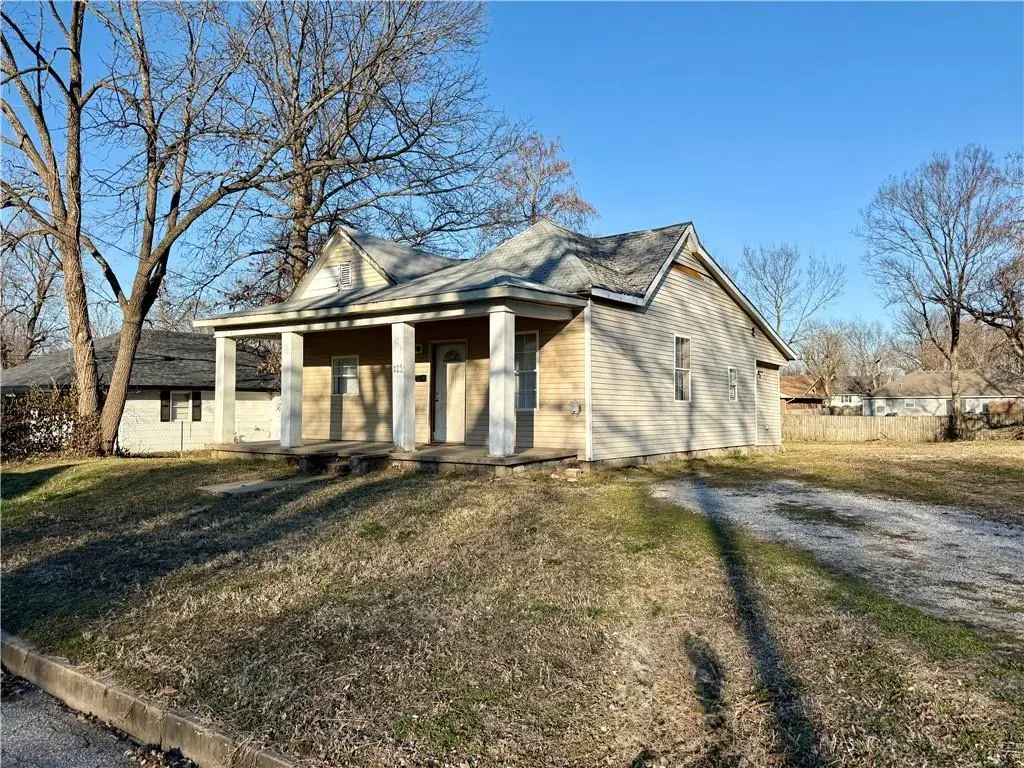
221 N Clay St · Nevada, MO
Flood risk 1/10 · Minimal
- FEMA flood zone
- X (unshaded)
- Chance of flooding over 30 yrs
- 0.0%
- Est. flood insurance / yr
- $507 – $1,088
Fire risk 3/10 · Minor
- Est. fire insurance / yr
- $1,054 – $1,958
Heat risk 5/10 · Moderate
- Hot days now (above 108°F)
- 7 days/yr
- Hot days in 30 yrs
- 19 days/yr
Wind risk 2/10 · Minimal
- Chance of severe wind over 30 yrs
- 1.0%
Air-quality risk 2/10 · Minimal
- Unhealthy air days now
- 0 days/yr
- Unhealthy air days in 30 yrs
- 1 days/yr
Risk factors via First Street. Map © Google.
Why this score? — see what drove the B grade
The composite is a weighted blend of 9 inputs, each scored 0–100. Each bar is that input's sub-score; the figure is the points it added to the 100-point composite (weight × sub-score).
- Cash flow +30.0/30.0
- ARV discount +15.0/15.0
- DSCR +10.0/10.0
- 1% rule +7.6/10.0
- Schools +3.2/10.0
- Livability +3.0/5.0
- Rent growth +2.5/5.0
- Condition / age +2.5/5.0
- Appreciation +0.0/10.0
$75,000
🖨 Deal sheet 📄 Offer letter ✓ Due diligence
Listing remarks MLS
2 bedroom, 1 bathroom home with a large yard and covered front porch in Nevada, MO. This property offers spacious living and dining areas, a functional kitchen layout, dedicated laundry space, and comfortably sized bedrooms. Large windows provide natural light throughout. The covered front porch and generous yard add usable outdoor space with room for future improvements. Exterior features include vinyl siding and vinyl windows. Interior is ready for occupancy, with exterior cosmetic improvements allowing room for equity growth. Established $800 per month rental rate with month-to-month tenancy, providing flexibility for portfolio or personal occupancy. Historically used as a rental property, this home presents opportunity for investors seeking a manageable addition to their holdings. Cash or conventional financing only. Property is being sold as-is. Positioned to offer investors value-add opportunity at today’s price point.
Key facts
- Covered front porch
- Large windows
- Large yard
Tags
Neighborhood map
What this means for you Summary
Snapshot
- This is a 2-bed/1.0-bath single-family listed at $75k.
Deal economics
- At list price, monthly cash flow is $299 ($4k/yr) — positive.
- The deal already cash-flows at list — no discount required.
- Meets the 1% rule at list price ($942 rent vs $75k).
- Recommended offer: $68k (9.0% below list) — sets the bar for market timing.
- Cap rate 11.1% vs local median 4.9% in Nevada — top-decile yield for the area; either an underpriced asset or a hidden risk that comps aren't pricing in. Stress-test before assuming the spread holds.
Location & tenants
- Location reads 59/100 on livability (#519 in MO) — a working-class tenant base; expect higher turnover. Strengths: cost of living A+, housing A; Watch: schools C-, crime F, amenities F.
- Nevada R-V (town): math 33% / reading 44% proficiency, ranked #180 of 324 in MO (top 56%) — families likely to look elsewhere, expect single-tenant / working-renter base with shorter leases.
- Market conditions: 104 active listings in the ZIP; 4 comparable units currently listed for rent nearby; rentals lingering (median 44d on market — plan ~5-8 weeks vacancy on turnover, expect pricing pressure); 100% of comp listings sitting > 30 days — soft ceiling on asking rent; 57 units permitted in Vernon County in 2024 (38 in 5+ unit buildings).
Forward outlook
- Local home prices are declining (-3.0%/yr); year-one equity from $519 of loan paydown is wiped out by about $2k of value loss. Plan a longer hold.
- Vernon County population projected at -13% by 2050 — secular population decline; favor cash flow + early exit over multi-decade hold.
- At projected returns (-3.0% appreciation + 3.0% rent growth), your $21k cash investment doubles in ~8 years — after that, you're playing with house money.
Negotiation context
- It's been on market 111 days — a 9% lower offer ($68k) is reasonable based on typical stale-listing flexibility.
- 2 sale attempts since 15y ago with the ask held roughly flat each time — persistent listings suggest the price (not the market) is what's stuck; bring a comps-based counter.
- Current owner paid $12k; list at $75k implies a 500% gain — meaningful room to come down on a strong offer.
Risks & watch-outs
- Watch-outs: built in 1900 — expect roof / HVAC / electrical / plumbing capex.
- Climate carrying-cost: extreme-heat days projected 7→19/yr by 2055 (HVAC capex compounding) — expect insurance premiums to compound above CPI over the hold.
Questions for the listing agent
- It's been on market 111 days. Have you received any prior offers? Is the seller open to a 9% concession, seller financing, or rate buy-down credit?
- Built in 1900 — when were the roof, HVAC, electrical panel, plumbing, and water heater last replaced?
- Why hasn't it sold? Are there any deal-killer items the seller is aware of (foundation, flood, title, zoning, code violations)?
- Is there a deadline driving the sale (1031 exchange, divorce, estate, relocation)? That informs how much negotiation room exists.
- Crime grade is F in this area — have there been break-ins, vandalism, or insurance claims at this property in the last 3 years? What carrier currently insures it and at what premium?
- What's the average days-on-market for RENTAL listings here right now (not sales)? A rising rental-DOM trend means longer vacancies and softer asking-rent achievability than the comps imply.
- What's the recent tenant-quality profile in this submarket — average credit score on applications, eviction rate, late-payment / NSF rate, and stable-employment percentage? A property-management company in the area should have these aggregated.
- How much new for-sale + rental construction is in the pipeline within 1–3 miles? Heavy new supply typically softens prices + rents 12–24 months out; constrained supply supports both.
Investment metrics
- 1% rule
- 1.26% ✓
- Cap rate
- 11.08%
- Cash-on-cash
- 17.09%
- DSCR
- 1.76
- GRM
- 6.6
CMA / ARV
- ARV (median comp)
- $118,326
- List price
- $75,000
- Delta
- -36.62%
- Verdict
- UNDERPRICED
- Comps
- 20 within 1.0 mi
Show comp detail 12 sales within ~0.75 mi
| Address | Dist | Beds/Ba | Sqft | Sold | Price | $/sf | Match |
|---|---|---|---|---|---|---|---|
| 627 W Cherry St | 0.19mi | 2/1.0 | 1,142 (+2%) | 1mo | $89,900 | $79 | 87 |
| 718 N Main St | 0.43mi | 2/1.0 | 1,098 (-2%) | 1mo | $105,000 | $96 | 76 |
| 419 W Cherry St | 0.13mi | 3/1.0 (+1) | 1,224 (+9%) | 0mo | $149,900 | $122 | 73 |
| 524 W Cherry St | 0.13mi | 2/1.0 | 1,260 (+12%) | 0mo | $144,999 | $115 | 73 |
| 610 W Ashland St | 0.35mi | 2/2.0 | 1,211 (+8%) | 2mo | $163,900 | $135 | 64 |
| 520 W Hunter St | 0.07mi | 3/2.0 (+1) | 1,265 (+13%) | 3mo | $199,000 | $157 | 64 |
| 426 N Elizabeth St | 0.29mi | 2/2.0 | 960 (-14%) | 2mo | $167,900 | $175 | 57 |
| 1128 N Clay St | 0.67mi | 2/1.0 | 1,020 (-9%) | 5mo | $129,900 | $127 | 50 |
| 918 W Walnut St | 0.38mi | 3/2.0 (+1) | 1,276 (+14%) | 2mo | $139,900 | $110 | 48 |
| 254 N Elm St | 0.57mi | 3/1.5 (+1) | 1,000 (-11%) | 5mo | $110,000 | $110 | 45 |
| 1239 N Main St | 0.71mi | 2/1.0 | 996 (-11%) | 5mo | $107,900 | $108 | 44 |
| 505 E Lee St | 0.63mi | 3/2.0 (+1) | 1,288 (+15%) | 3mo | $169,900 | $132 | 34 |
Match score weights: distance 35% · size 25% · config 20% · recency 20%. Top-matched comps best support the ARV.
Projected returns pro-forma
-3.0% appreciation · 3.0% rent growth · sell at horizon
- IRR
- 8.3%
- Equity multiple
- 1.33×
- Total profit
- $6,865
- Equity at exit
- $11,183
- IRR
- 17.5%
- Equity multiple
- 2.45×
- Total profit
- $30,381
- Equity at exit
- $6,485
Cash invested: $21,000 (down + closing). Projections, not guarantees.
Landlord ↔ Tenant lean methodology
- Overall (STATE)
- 81 Strongly Landlord-Friendly
- State Missouri
- 81 Strongly Landlord-Friendly · R+10
- County
- — inherits STATE
- City
- — inherits STATE
ZIP-level market 64772
- Active inventory
- 104
- Price-to-rent
- 6.6×
Monthly cashflow live
- Estimated rent
- $942 medium interval (Pro) →
- Mortgage (P&I)
- −$393
- Tax from tax record
- −$21 /mo · $247/yr
- Insurance
- −$31
- HOA
- −$0
- Vacancy / Maint / Mgmt
- −$198
- Net cashflow
- $299
Break-even live
UW: 25.0% down · 7.5% · 30yr · 1.5% tax · 5.0% vac · 8.0% maint · 8.0% mgmt
Financing live
Cash to close
- Down payment
- $18,750
- Closing costs
- $2,250
- Reserves months
- —
- Total cash needed
- —
Loan-product check · same deal, 3 products live
Conventional
25% down · 7.5% · 30yr
- Down + closing
- —
- Monthly P&I
- —
- Monthly cashflow
- —
- DSCR
- —
- Eligible?
- —
Personal DTI + credit; lowest rate.
DSCR
20% down · 8.5% · 30yr
- Down + closing
- —
- Monthly P&I
- —
- Monthly cashflow
- —
- DSCR
- —
- Eligible?
- —
No personal income docs; deal must DSCR.
Hard money
10% down · 12.0% · 12mo
- Down + closing
- —
- Monthly P&I
- —
- Monthly cashflow
- —
- DSCR
- —
- Eligible?
- —
Short-term bridge; refi at stabilization.
Rent comps 4 comps
| Address | Beds | Baths | Sqft | Rent | $/sqft | DOM | Units | Dist |
|---|---|---|---|---|---|---|---|---|
| 926 W Sycamore St Nevada, MO | 3.0 | 1.0 | 1100 | $850 | $0.77 | 43d | 1 | 0.48mi |
| 317 E Hickory St Nevada, MO | 3.0 | 1.0 | 1296 | $1,050 | $0.81 | 43d | 1 | 0.51mi |
| 404 E Ashland St Nevada, MO | 2.0 | 1.0 | 1041 | $875 | $0.84 | 43d | 1 | 0.60mi |
| 515 N Tower St Nevada, MO | 3.0 | 1.0 | 1305 | $1,025 | $0.79 | 43d | 1 | 0.65mi |
Listing history 19 events
-
2026-06-18days on market $75,000 Active 111 DOM
-
2026-06-17days on market $75,000 Active 110 DOM
-
2026-06-16days on market $75,000 Active 109 DOM
-
2026-06-15days on market $75,000 Active 108 DOM
-
2026-06-13days on market $75,000 Active 106 DOM
-
2026-06-12days on market $75,000 Active 105 DOM
-
2026-06-09days on market $75,000 Active 102 DOM
-
2026-06-08days on market $75,000 Active 101 DOM
-
2026-06-07days on market $75,000 Active 100 DOM
-
2026-06-07days on market $75,000 Active 99 DOM
-
2026-06-04days on market $75,000 Active 96 DOM
-
2026-06-02days on market $75,000 Active 95 DOM
-
2026-06-01days on market $75,000 Active 94 DOM
-
2026-05-31days on market $75,000 Active 93 DOM
-
2026-02-27$75,000 Active 944-char remark
Show marketing remark (944 chars)
2 bedroom, 1 bathroom home with a large yard and covered front porch in Nevada, MO. This property offers spacious living and dining areas, a functional kitchen layout, dedicated laundry space, and comfortably sized bedrooms. Large windows provide natural light throughout. The covered front porch and generous yard add usable outdoor space with room for future improvements. Exterior features include vinyl siding and vinyl windows. Interior is ready for occupancy, with exterior cosmetic improvements allowing room for equity growth. Established $800 per month rental rate with month-to-month tenancy, providing flexibility for portfolio or personal occupancy. Historically used as a rental property, this home presents opportunity for investors seeking a manageable addition to their holdings. Cash or conventional financing only. Property is being sold as-is. Positioned to offer investors value-add opportunity at today’s price point.
-
2011-08-12soldstatus 216-char remark
Show marketing remark (216 chars)
To be sold "as is/where is" with no warranties or exceptions. All offers to include letters of pre-approval/proof of funds. Addendums will eventually apply. First look period should be over on July 29, 2011
-
2011-07-14$5,100 216-char remark
Show marketing remark (216 chars)
To be sold "as is/where is" with no warranties or exceptions. All offers to include letters of pre-approval/proof of funds. Addendums will eventually apply. First look period should be over on July 29, 2011
-
1999-06-02soldstatus $12,500
-
1998-03-01soldstatus
ⓘ Source: listings_history table (triggers on properties + properties_extension) + one-shot
backfill from property_details.listing_events for pre-trigger history.
Tax reassessment forecast MO · Resets to sale price
- Current annual tax
- $247 · $21/mo
- Projected year-2 tax
- $728 · $61/mo
- Expected delta
- +$481/yr (+$40/mo · 195.1%)
ⓘ Screening estimate from a state-policy table — verify with the county assessor before closing.
Climate risk First Street
- Flood 1/10 Low FEMA zone X (unshaded) · 0% chance over 30 yrs
- Wildfire 3/10 Moderate
- Heat 5/10 Major 7 d/yr ≥108°F today · 19 d/yr by 30 yrs out
- Wind 2/10 Low 100% chance of damaging wind over 30 yrs
- Air quality 2/10 Low 0 unhealthy d/yr today · 1 by 30 yrs out
Nearby sold comps map
Loading sold comps map…
Walkable amenities ~0.75 mi
Loading nearby amenities…
Taxation est. · year 1
- Rental income
- $11,304
- − Mortgage interest
- −$4,201
- − Property taxes
- −$247
- − Insurance
- −$375
- − Repairs & maintenance
- −$904
- − Management
- −$904
- − Depreciation
- −$2,182
- Taxable income
- $2,491
- Est. tax owed @ 24.0%
- −$598
- After-tax cash flow
- $2,991/yr
For passive investors: Depreciation is non-cash, so a rental often shows a tax loss while cash-flowing — sheltering income. Rental losses are passive: they offset passive income freely, and up to $25,000/yr can offset ordinary (W-2) income if you actively participate and your MAGI is under $100k (phasing out to $0 by $150k); unused losses carry forward. On sale, claimed depreciation is recaptured at up to 25%, and gains may owe capital-gains tax (a 1031 exchange can defer both). Figures are a year-1 estimate at your 24.0% rate — not tax advice; consult a CPA.
Schools (NCES district)
- District
- Nevada R-V
- NCES district ID
- 2921840
- Math proficiency
- 33% ▼ -1.00%
- Reading proficiency
- 44% ▼ -1.00%
- Median HH income
- $38,804
- Composite
- 32.14/100
- National rank
- #5792
- State rank
- #180 of 324 in MO
Livability — Nevada
- Score
- 59/100
- State rank
- #519
- US rank
- #19644
Category grades
Schools grade is shown separately in the Schools card above.
Census & demographics
- Census place
- Nevada, MO
- Population (ZIP)
- 12,930
Population outlook (Vernon County) Hauer SSP2
- Today (2025)
- 20,169 people
- By 2030
- 19,639 · -2.6%
- By 2040
- 18,551 · -8.0%
- By 2050
- 17,549 · -13.0%
- By 2075
- 15,314 · -24.1%
- By 2100
- 13,132 · -34.9%
Race, ethnicity, and origin ACS 2023
- Neighborhood character
- Predominantly White (92%)
- Race & ethnicity
- White 92% Two or more races 4% Hispanic / Latino 3% Black 1% Asian 1%
- Common ancestry
- Italian 3% Portuguese 2% Romanian 2%
- Foreign-born
- 1%
- Languages at home
- 98% English-only · German/W. Germanic 1%
Political lean MEDSL · Vernon
- 2024 margin
- Solid R (+59.5) · D 19.8% · R 79.3%
- 2008→2024 swing
- -37.5pp toward R · 2008: -22.0pp · 2024: -59.5pp
- All cycles
- 2024: R+59.5 2020: R+57.2 2016: R+56.2 2012: R+37.3 2008: R+22.0
Not yet ingested
- Civics
- —
Market trends
- HPI YoY
- ▼ -84.21%
- Current HPI
- 150.7283
- Rent YoY
- —
- Metro
- —
- State GDP YoY
- ▲ 1.84%
- F500 in state
- 20
Industry mix (Fortune 500 HQ in MO)
| Industry | F500 HQs | Revenue |
|---|---|---|
| Healthcare | 1 | $163B |
|
||
| Insurance | 1 | $21B |
|
||
| Industrial Technology | 1 | $17B |
|
||
| Retail | 1 | $16B |
|
||
| Industrial Distribution | 1 | $10B |
|
||
| Utilities | 1 | $9B |
|
||
Price history
+500.0% since first listed5 events — show timeline
- 2026-02-27 Listed $75,000 Heartland MLS as Distributed by MLS Grid
- 2011-08-12 Sold (MLS) — Heartland MLS as Distributed by MLS Grid
- 2011-07-14 Listed $5,100 Heartland MLS as Distributed by MLS Grid
- 1999-06-02 Sold (Public Records) $12,500 Public Records
- 1998-03-01 Sold (Public Records) — Public Records
Property tax history
-1.6%/yrLatest (2025): $247 · +13.6% YoY. Source: county tax records.
Cash-flow waterfall
monthlySold comps — $/sqft
last 12 mo · ≤1 miLoading sold comps…