 🏗️ New Construction
7751 Sea Level Dr Lot 16G · East Milton, FL
Flood risk No data
- FEMA flood zone
- —
- Chance of flooding over 30 yrs
- —
- Est. flood insurance / yr
- —
Fire risk No data
- Est. fire insurance / yr
- —
Heat risk No data
- Hot days now (above threshold)
- —
- Hot days in 30 yrs
- —
Wind risk No data
- Chance of severe wind over 30 yrs
- —
Air-quality risk No data
- Unhealthy air days now
- —
- Unhealthy air days in 30 yrs
- —
Risk factors via First Street. Map © Google.
Why this score? — see what drove the D- grade
The composite is a weighted blend of 9 inputs, each scored 0–100. Each bar is that input's sub-score; the figure is the points it added to the 100-point composite (weight × sub-score).
- Cash flow +7.9/30.0
- ARV discount +7.5/15.0
- Schools +5.3/10.0
- Condition / age +4.0/5.0
- Livability +3.9/5.0
- Rent growth +3.2/5.0
- 1% rule +2.6/10.0
- DSCR +1.9/10.0
- Appreciation +0.0/10.0
$283,490
🖨 Deal sheet 📄 Offer letter ✓ Due diligence
Listing remarks
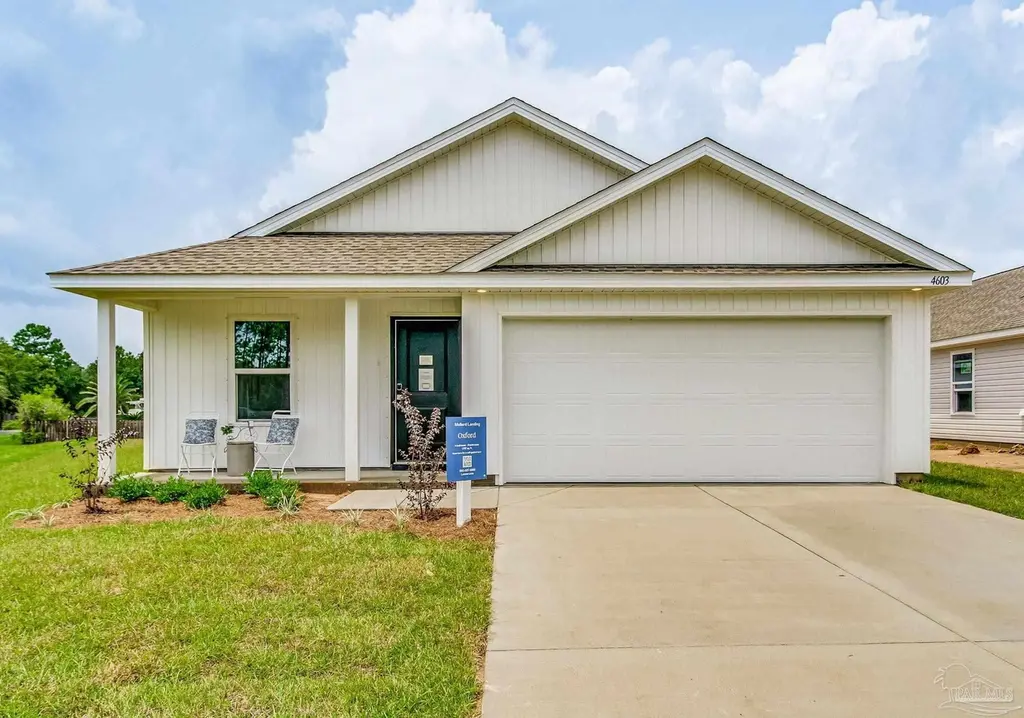
New construction in Horizon's Edge, Milton's newest community - features cottage style homes in a convenient location. Shopping just minutes away and easy commutes as this community has quick interstate access. The Oxford floorplan offers 4 bedrooms and 2 baths with a HUGE walk-in closet in Owner's Suite and large Dining area at a very spacious 1,707 square feet. Features in the home include (but are not limited to) 2 car garage, beautiful open kitchen with upgraded quartz countertops, white shaker style cabinets, and stainless steel appliances. This spacious kitchen also features a pantry and large area for dining. Owner's Bath includes large walk-in shower and HUGE walk-in closet. Please
Key facts
- Huge walk-in closet
- Convenient location
- Large dining area
Tags
Property features AI
Finance
- Other: Located on a county-maintained road
- HOA & community: Homeowners association with annual fee of $750 (fee covers association)
Exterior
- Parking: Attached 2-car garage (2 covered parking spaces, total 2 parking spaces)
- Utilities: Public sewer; Public water; Electric power (electric water heater)
- Home design: Single-story (one level); New construction, currently under construction; Not attached to another property; Homestead eligible
- Construction: Frame construction; Slab foundation
- Exterior features: Interior lot; Shingle roof; Public water
Interior
- Kitchen: Electric water heater
- Bedrooms: Master bedroom on the first floor (approx. 15 x 15); Bedroom on the first floor (approx. 10 x 10); Bedroom on the first floor (approx. 10 x 10); Bedroom on the first floor (approx. 11 x 10)
- Flooring: Carpet
- Bathrooms: Two full bathrooms
- Heating & cooling: Heat pump for heating and cooling
- Interior features: Carpet flooring
- Laundry & utility: Electric water heater
Neighborhood map
What this means for you Summary
Snapshot
- This is a 4-bed/2.0-bath single-family listed at $283k. Condition is rated good.
Deal economics
- At list price, monthly cash flow is $-334 ($-4k/yr) — negative.
- To cash-flow at today's rent, offer at most $259k (8.6% below list).
- To meet the 1% rule (rent ≥ 1% of price), the offer needs to be $235k (17.3% below list).
- Recommended offer: $235k (17.3% below list) — sets the bar for 1% rule.
Location & tenants
- Location reads 77/100 on livability (#199 in FL, #3,139 nationally) — a middle-class / working-renter tenant base. Strengths: cost of living A+, housing A+, health & safety A+; Watch: crime C-, amenities C-, commute F.
- Santa Rosa (suburban): math 63% / reading 60% proficiency, ranked #8 of 73 in FL (top 11%) — acceptable for families but not a draw, mixed tenant base, ~2y average lease.
- Market conditions: Rents rising (+2.7%/yr); 360 active listings in the ZIP; 1 comparable units currently listed for rent nearby; solid renter incomes; 1,983 units permitted in Santa Rosa County in 2024 (128 in 5+ unit buildings).
- This rent runs 36% of the median local income ($77k/yr) — at the standard rent-burdened threshold; future hikes will face affordability resistance.
Forward outlook
- Local home prices are declining (-3.0%/yr); year-one equity from $2k of loan paydown is wiped out by about $9k of value loss. Plan a longer hold.
- Santa Rosa County population projected at +31% by 2050 — long-run rental-demand tailwind backs the buy-and-hold thesis.
Negotiation context
- It's been on market 30 days — a 2% lower offer ($279k) is reasonable based on typical stale-listing flexibility.
Questions for the listing agent
- What do current leases actually rent for vs. the listed asking? Can we see a recent rent roll and the last 12 months of T-12 income?
- What does the HOA fee cover, when was the last increase, and are there any pending special assessments or reserve-fund shortfalls?
- Is there a deadline driving the sale (1031 exchange, divorce, estate, relocation)? That informs how much negotiation room exists.
- Schools are B-rated — typically a magnet for longer-tenancy family renters. What's the average tenant stay here, and is there a school-zone premium baked into asking?
- The area grade is low — what's the realistic commute time and amenity access for the typical tenant pool here? Any planned neighborhood developments (good or bad) we should know about?
- What's the average days-on-market for RENTAL listings here right now (not sales)? A rising rental-DOM trend means longer vacancies and softer asking-rent achievability than the comps imply.
- What's the recent tenant-quality profile in this submarket — average credit score on applications, eviction rate, late-payment / NSF rate, and stable-employment percentage? A property-management company in the area should have these aggregated.
- How much new for-sale + rental construction is in the pipeline within 1–3 miles? Heavy new supply typically softens prices + rents 12–24 months out; constrained supply supports both.
Investment metrics
- 1% rule
- 0.76% ✗
- Cap rate
- 4.99%
- Cash-on-cash
- -4.65%
- DSCR
- 0.79
- GRM
- 10.9
CMA / ARV
- ARV (on-the-fly)
- $307,260
- Comps found
- 12
Show comp detail 12 sales within ~0.75 mi
| Address | Dist | Beds/Ba | Sqft | Sold | Price | $/sf | Match |
|---|---|---|---|---|---|---|---|
| 5341 Horizons Edge Ln Lot 5G | 0.05mi | 4/2.0 | 1,707 (0%) | 0mo | $292,509 | $171 | 97 |
| 7752 Sea Level Dr Lot 8F | 0.03mi | 4/2.0 | 1,707 (0%) | 2mo | $279,990 | $164 | 97 |
| 5315 Hidden Pines Cir | 0.27mi | 3/2.0 (-1) | 1,634 (-4%) | 1mo | $331,900 | $203 | 74 |
| 5327 Hidden Pines Cir | 0.29mi | 4/2.0 | 1,820 (+7%) | 1mo | $321,707 | $177 | 74 |
| 7633 Small Pines St | 0.33mi | 4/2.0 | 1,810 (+6%) | 1mo | $327,231 | $181 | 74 |
| 5338 Hidden Pines Cir | 0.33mi | 4/2.0 | 1,820 (+7%) | 0mo | $326,707 | $180 | 73 |
| 7768 Three Mile View Dr Lot 6G | 0.04mi | 3/2.0 (-1) | 1,474 (-14%) | 2mo | $264,990 | $180 | 69 |
| 5368 Horizons Edge Ln Lot 21A | 0.04mi | 3/2.0 (-1) | 1,474 (-14%) | 3mo | $265,190 | $180 | 68 |
| 5307 Hidden Pines Cir | 0.25mi | 3/2.0 (-1) | 1,530 (-10%) | 2mo | $312,000 | $204 | 64 |
| 7651 Small Pines St | 0.31mi | 4/2.0 | 1,920 (+12%) | 1mo | $341,131 | $178 | 64 |
| 5369 Hidden Pines Cir | 0.37mi | 4/2.0 | 1,920 (+12%) | 2mo | $337,231 | $176 | 61 |
| 7684 Pine Bark St | 0.31mi | 3/2.0 (-1) | 1,901 (+11%) | 2mo | $385,648 | $203 | 60 |
Match score weights: distance 35% · size 25% · config 20% · recency 20%. Top-matched comps best support the ARV.
Projected returns pro-forma
-3.0% appreciation · 2.7% rent growth · sell at horizon
- IRR
- -24.5%
- Equity multiple
- 0.17×
- Total profit
- $-71,670
- Equity at exit
- $45,813
- IRR
- -20.8%
- Equity multiple
- -0.07×
- Total profit
- $-92,348
- Equity at exit
- $26,566
Cash invested: $86,033 (down + closing). Projections, not guarantees.
Landlord ↔ Tenant lean methodology
- Overall (STATE)
- 87 Strongly Landlord-Friendly
- State Florida
- 87 Strongly Landlord-Friendly · R+3
- County
- — inherits STATE
- City
- — inherits STATE
ZIP-level market 32570
- Home prices YoY
- -15.1%
- Rents YoY
- 2.7%
- Active inventory
- 360
- Price-to-rent
- 10.1×
Monthly cashflow live
- Estimated rent
- $2,345 medium interval (Pro) →
- Mortgage (P&I)
- −$1,611
- Tax est. 1.5%
- −$384 /mo · $4,609/yr
- Insurance
- −$128
- HOA
- −$63
- Vacancy / Maint / Mgmt
- −$493
- Net cashflow
- $-334
Break-even live
UW: 25.0% down · 7.5% · 30yr · 1.5% tax · 5.0% vac · 8.0% maint · 8.0% mgmt
Financing live
Cash to close
- Down payment
- $76,815
- Closing costs
- $9,218
- Reserves months
- —
- Total cash needed
- —
Loan-product check · same deal, 3 products live
Conventional
25% down · 7.5% · 30yr
- Down + closing
- —
- Monthly P&I
- —
- Monthly cashflow
- —
- DSCR
- —
- Eligible?
- —
Personal DTI + credit; lowest rate.
DSCR
20% down · 8.5% · 30yr
- Down + closing
- —
- Monthly P&I
- —
- Monthly cashflow
- —
- DSCR
- —
- Eligible?
- —
No personal income docs; deal must DSCR.
Hard money
10% down · 12.0% · 12mo
- Down + closing
- —
- Monthly P&I
- —
- Monthly cashflow
- —
- DSCR
- —
- Eligible?
- —
Short-term bridge; refi at stabilization.
Rent comps 1 comps
| Address | Beds | Baths | Sqft | Rent | $/sqft | DOM | Units | Dist |
|---|---|---|---|---|---|---|---|---|
| 8057 Fir Tree Dr Milton, FL | 5.0 | 3.0 | 2107 | $2,400 | $1.14 | 23d | 1 | 0.79mi |
HOA detail
- Monthly dues
- $63 · $756/yr
Listing history 17 events
-
2026-06-18days on market $283,490 Active 30 DOM
-
2026-06-17price $283,490 Active 29 DOM
-
2026-06-17days on market $285,490 Active 29 DOM
-
2026-06-16days on market $285,490 Active 28 DOM
-
2026-06-15days on market $285,490 Active 27 DOM
-
2026-06-14days on market $285,490 Active 25 DOM
-
2026-06-10days on market $285,490 Active 22 DOM
-
2026-06-09days on market $285,490 Active 21 DOM
-
2026-06-08days on market $285,490 Active 20 DOM
-
2026-06-07pricedays on market $285,490 Active 19 DOM
-
2026-06-05days on market $287,490 Active 16 DOM
-
2026-06-03days on market $287,490 Active 15 DOM
-
2026-06-02days on market $287,490 Active 14 DOM
-
2026-06-01days on market $287,490 Active 13 DOM
-
2026-05-31days on market $287,490 Active 12 DOM
-
2026-05-31pricedays on market $287,490 Active 11 DOM
-
2026-05-19$291,490 Active
ⓘ Source: listings_history table (triggers on properties + properties_extension) + one-shot
backfill from property_details.listing_events for pre-trigger history.
Nearby sold comps map
Loading sold comps map…
Walkable amenities ~0.75 mi
Loading nearby amenities…
Taxation est. · year 1
- Rental income
- $28,143
- − Mortgage interest
- −$17,211
- − Property taxes
- −$4,609
- − Insurance
- −$1,536
- − Repairs & maintenance
- −$2,251
- − Management
- −$2,251
- − HOA
- −$756
- − Depreciation
- −$8,938
- Taxable loss
- −$9,410
- Est. tax savings @ 24.0%
- +$2,259
- After-tax cash flow
- $-1,745/yr
For passive investors: Depreciation is non-cash, so a rental often shows a tax loss while cash-flowing — sheltering income. Rental losses are passive: they offset passive income freely, and up to $25,000/yr can offset ordinary (W-2) income if you actively participate and your MAGI is under $100k (phasing out to $0 by $150k); unused losses carry forward. On sale, claimed depreciation is recaptured at up to 25%, and gains may owe capital-gains tax (a 1031 exchange can defer both). Figures are a year-1 estimate at your 24.0% rate — not tax advice; consult a CPA.
Condition & rehab AI · 13 photos
This home is in excellent condition with a good condition score of 80. It is move-in ready with no visible repairs or maintenance needed. The highest-ROI updates would be painting the exterior siding, landscaping, adding a smart home system, and upgrading the HVAC system.
Value-add opportunities
- Both Painting exterior siding — Enhances curb appeal and value
- Both Landscaping around the house — Improves curb appeal and enhances property value
- Both Adding a smart home system — Enhances convenience and adds value
- Both Upgrading the HVAC system — Improves comfort and energy efficiency
Renovation cost estimate screening
Value-add ROI direction
- Both Painting exterior siding — Enhances curb appeal and value ↑
- Both Landscaping around the house — Improves curb appeal and enhances property value ↑
- Both Adding a smart home system — Enhances convenience and adds value ↑
- Both Upgrading the HVAC system — Improves comfort and energy efficiency ↑
ⓘ Cost ranges are severity-bucket heuristics (US national rule-of-thumb). Get contractor quotes + a written scope before underwriting a rehab budget.
Schools (NCES district)
- District
- Santa Rosa
- NCES district ID
- 1201650
- Math proficiency
- 63% ▼ -6.00%
- Reading proficiency
- 60% ▼ -5.00%
- Median HH income
- $58,161
- Composite
- 53.12/100
- National rank
- #1511
- State rank
- #8 of 73 in FL
Livability — East Milton
- Score
- 77/100
- State rank
- #199
- US rank
- #3139
Category grades
Schools grade is shown separately in the Schools card above.
Census & demographics
- Census place
- East Milton, FL
- County
- Santa Rosa County · 194,764 people
- City population
- 31,415
- Metro
- Pensacola-Ferry Pass-Brent, FL
- Population (ZIP)
- 37,197
- Household income
- $77,222
- Rent vs Own
- Severe rent burden
- 590.0
Population outlook (Santa Rosa County) Hauer SSP2
- Today (2025)
- 195,978 people
- By 2030
- 209,782 · +7.0%
- By 2040
- 235,293 · +20.1%
- By 2050
- 256,408 · +30.8%
- By 2075
- 298,074 · +52.1%
- By 2100
- 303,216 · +54.7%
Race, ethnicity, and origin ACS 2023
- Neighborhood character
- Predominantly White (80%)
- Race & ethnicity
- White 80% Two or more races 7% Black 6% Hispanic / Latino 6% Asian 1%
- Hispanic origin (detail)
- Mexican 2% Puerto Rican 2%
- Common ancestry
- Italian 4% Lithuanian 3% Portuguese 2%
- Foreign-born
- 4% · Canada
- Languages at home
- 94% English-only · Spanish 4% Other Asian/Pacific 1%
Political lean MEDSL · Santa Rosa
- 2024 margin
- Solid R (+51.0) · D 24.1% · R 75.0%
- 2008→2024 swing
- -3.0pp toward R · 2008: -47.9pp · 2024: -51.0pp
- All cycles
- 2024: R+51.0 2020: R+46.5 2016: R+53.5 2012: R+52.6 2008: R+47.9
Not yet ingested
- Civics
- —
Market trends
- HPI YoY
- ▼ -51.06%
- Current HPI
- 287.7469
- Rent YoY
- ▲ 2.70%
- Metro
- Pensacola-Ferry Pass-Brent, FL
- State GDP YoY
- ▲ 3.28%
- F500 in state
- 36
Industry mix (Fortune 500 HQ in FL)
| Industry | F500 HQs | Revenue |
|---|---|---|
| Industrial Technology | 2 | $29B |
|
||
| Insurance | 2 | $17B |
|
||
| Retail | 1 | $60B |
|
||
| Technology Distribution | 1 | $58B |
|
||
| Homebuilding | 1 | $35B |
|
||
| Technology Manufacturing | 1 | $35B |
|
||
Price history
1 event — show timeline
- 2026-05-19 Listed $291,490 PARMLS
Cash-flow waterfall
monthlySold comps — $/sqft
last 12 mo · ≤1 miLoading sold comps…