 🌊 Lakefront
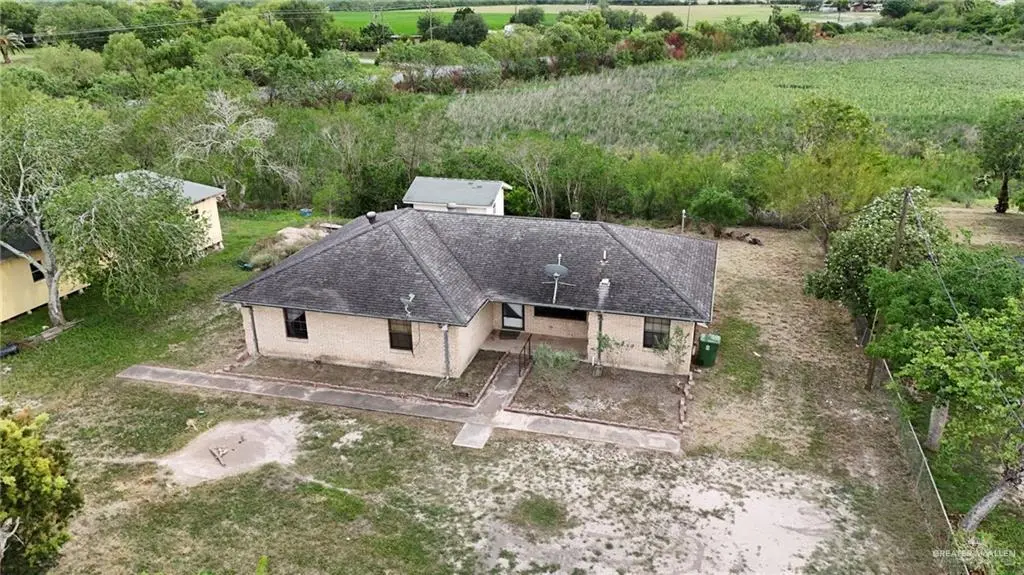
17022 Jimenez Rd · Rangerville, TX
Flood risk 1/10 · Minimal
- FEMA flood zone
- X (unshaded)
- Chance of flooding over 30 yrs
- 0.0%
- Est. flood insurance / yr
- $507 – $1,088
Fire risk 3/10 · Minor
- Est. fire insurance / yr
- $1,222 – $2,270
Heat risk 8/10 · Major
- Hot days now (above 110°F)
- 7 days/yr
- Hot days in 30 yrs
- 23 days/yr
Wind risk 9/10 · Severe
- Chance of severe wind over 30 yrs
- 99.0%
Air-quality risk 1/10 · Minimal
- Unhealthy air days now
- 0 days/yr
- Unhealthy air days in 30 yrs
- 0 days/yr
Risk factors via First Street. Map © Google.
Why this score? — see what drove the D grade
The composite is a weighted blend of 9 inputs, each scored 0–100. Each bar is that input's sub-score; the figure is the points it added to the 100-point composite (weight × sub-score).
- Cash flow +18.7/30.0
- DSCR +5.9/10.0
- 1% rule +5.0/10.0
- Appreciation +4.4/10.0
- Condition / age +2.2/5.0
- Livability +2.1/5.0
- Rent growth +1.8/5.0
- Schools +1.6/10.0
- ARV discount +0.0/15.0
$209,900
🖨 Deal sheet (PDF) 📄 Offer letter ✓ Due diligence
Listing remarks
Welcome to your own slice of the country. Nestled in a serene, quiet setting with no rear neighbors, this home offers a rare sense of space and privacy the moment you step outside. Inside, you'll find oversized bedrooms that stand out from the competition, giving anyone their own great sized room. This home simply awaits a buyer with the vision to refresh and modernize. Whether you're looking to build equity or create your forever home exactly the way you want it, this is a rare opportunity at an amazing value. Come see the potential for yourself!
Key facts
- 0.27 acre lot
- Built 1995
- Listed 40 days
Property features AI
Finance
- HOA & community: No homeowners association
Exterior
- Parking: No carport; No garage or covered parking
- Utilities: City sewer
- Home design: Not new construction
- Construction: Brick construction; Slab foundation; Composition shingle roof
- Exterior features: Gutters and spouting; Mature trees; Resaca on the property; Paved road access; Storage structure on site
Interior
- Kitchen: Electric water heater; Electric stove/range with coil burners
- Flooring: Vinyl
- Bathrooms: 2 full bathrooms
- Heating & cooling: Central heating; Central air conditioning
- Interior features: Laminate countertops; Ceiling fans; Washer included; Partial window coverings; Vinyl flooring
- Laundry & utility: Laundry room; Washer/dryer connections
Neighborhood map
What this means for you Summary
Snapshot
- This is a 3-bed/2.0-bath single-family listed at $210k. Condition is rated fair.
Deal economics
- At list price, monthly cash flow is $207 ($2k/yr) — positive.
- The deal already cash-flows at list — no discount required.
- To meet the 1% rule (rent ≥ 1% of price), the offer needs to be $210k (0.0% below list).
- Recommended offer: $204k (3.0% below list) — sets the bar for market timing.
Location & tenants
- Location reads 41/100 on livability (#1,592 in TX) — a working-class tenant base; expect higher turnover. Strengths: cost of living A+, crime A; Watch: amenities F, commute F, employment F.
- San Benito CISD (suburban): math 14% / reading 27% proficiency, ranked #782 of 826 in TX (top 95%) — low school quality limits family demand, transient renter base, plan for 1-2y turnover; 78% free/reduced lunch — lower-income household profile, screen leases tightly.
- Zoned schools: Rangerville El (math 22% / reading 17%, grade F, #3,583 of 4,322 statewide, top 86%, 217 students, 94% FRL); San Benito Riverside Middle (math 13% / reading 28%, grade F, #1,407 of 1,662 statewide, top 86%, 529 students, 90% FRL); San Benito H S (math 32% / reading 2%, grade F, #1,460 of 1,632 statewide, top 91%, 2,012 students, 80% FRL).
- Market conditions: Rents soft (-2.9%/yr); 763 active listings in the ZIP; solid renter incomes; 2,326 units permitted in Cameron County in 2024 (503 in 5+ unit buildings).
Forward outlook
- Local home prices are declining (-1.3%/yr); year-one equity from $1k of loan paydown is wiped out by about $3k of value loss. Plan a longer hold.
- Cameron County population projected at +3% by 2050 — modest demand growth; plan on rents tracking national, not racing it.
Negotiation context
- It's been on market 40 days — a 3% lower offer ($204k) is reasonable based on typical stale-listing flexibility.
Risks & watch-outs
- Climate carrying-cost: severe wind risk, 99% chance of damaging wind over 30y; extreme-heat days projected 7→23/yr by 2055 (HVAC capex compounding) — expect insurance premiums to compound above CPI over the hold.
Questions for the listing agent
- It's been on market 40 days. Have you received any prior offers? Is the seller open to a 3% concession, seller financing, or rate buy-down credit?
- Have any recent inspections been done? Can we get a copy of the seller's disclosures and any deferred-maintenance estimates?
- Is there a deadline driving the sale (1031 exchange, divorce, estate, relocation)? That informs how much negotiation room exists.
- Schools are F-rated, which usually means shorter tenancies and higher turnover. Who's the typical renter profile here, and what's been the actual vacancy rate?
- The area grade is low — what's the realistic commute time and amenity access for the typical tenant pool here? Any planned neighborhood developments (good or bad) we should know about?
- This sits on a lake — are riparian / water-frontage rights deeded with the parcel? Any dock permits, shoreline easements, or HOA water-use restrictions?
- What's the documented flood / surge / shoreline-erosion history here (FEMA AND non-FEMA — e.g., storm surge, creek backup, septic-field saturation)?
- Any water-quality or seasonal algae-bloom issues that affect tenant satisfaction or short-term-rental demand?
- What's the average days-on-market for RENTAL listings here right now (not sales)? A rising rental-DOM trend means longer vacancies and softer asking-rent achievability than the comps imply.
- What's the recent tenant-quality profile in this submarket — average credit score on applications, eviction rate, late-payment / NSF rate, and stable-employment percentage? A property-management company in the area should have these aggregated.
- How much new for-sale + rental construction is in the pipeline within 1–3 miles? Heavy new supply typically softens prices + rents 12–24 months out; constrained supply supports both.
Investment metrics
- 1% rule
- 1.00% ✗
- Cap rate
- 7.48%
- Cash-on-cash
- 4.24%
- DSCR
- 1.19
- GRM
- 8.3
CMA / ARV
- ARV (median comp)
- $150,387
- List price
- $209,900
- Delta
- 39.57%
- Verdict
- OVERPRICED
- Comps
- 2 within 2.0 mi
Show comp detail 1 sale within ~0.75 mi
| Address | Dist | Beds/Ba | Sqft | Sold | Price | $/sf | Match |
|---|---|---|---|---|---|---|---|
| 32745 W Parmer Dr | 1.37mi | 2/1.5 (-1) | 1,488 (-4%) | 2mo | $168,000 | $113 | 50 |
Match score weights: distance 35% · size 25% · config 20% · recency 20%. Top-matched comps best support the ARV.
Projected returns pro-forma
-1.27% appreciation · 0.0% rent growth · sell at horizon
- IRR
- -4.6%
- Equity multiple
- 0.81×
- Total profit
- $-11,261
- Equity at exit
- $47,952
- IRR
- -0.4%
- Equity multiple
- 0.97×
- Total profit
- $-1,934
- Equity at exit
- $48,075
Cash invested: $58,772 (down + closing). Projections, not guarantees.
Landlord ↔ Tenant lean methodology
- Overall (STATE)
- 87 Strongly Landlord-Friendly
- State Texas
- 87 Strongly Landlord-Friendly · R+5
- County
- — inherits STATE
- City
- — inherits STATE
ZIP-level market 77449
- Home prices YoY
- -0.5%
- Rents YoY
- -2.9%
- Active inventory
- 763
- Price-to-rent
- 8.3×
Monthly cashflow live
- Estimated rent
- $2,099 medium interval (Pro) →
- Mortgage (P&I)
- −$1,101
- Tax est. 1.5%
- −$262 /mo · $3,148/yr
- Insurance
- −$87
- HOA
- −$0
- Vacancy / Maint / Mgmt
- −$441
- Net cashflow
- $207
Break-even live
Sensitivity live
| Price | -10% $353 | -5% $280 | +0% $207 | +5% $135 | +10% $62 |
|---|---|---|---|---|---|
| Rent | -10% $42 | -5% $125 | +0% $207 | +5% $290 | +10% $373 |
| Rate | -1.0pp $313 | -0.5pp $261 | base $207 | +0.5pp $153 | +1.0pp $98 |
UW: 25.0% down · 7.5% · 30yr · 1.5% tax · 5.0% vac · 8.0% maint · 8.0% mgmt
Financing live
Cash to close
- Down payment
- $52,475
- Closing costs
- $6,297
- Reserves months
- —
- Total cash needed
- —
Loan-product check · same deal, 3 products live
Conventional
25% down · 7.5% · 30yr
- Down + closing
- —
- Monthly P&I
- —
- Monthly cashflow
- —
- DSCR
- —
- Eligible?
- —
Personal DTI + credit; lowest rate.
DSCR
20% down · 8.5% · 30yr
- Down + closing
- —
- Monthly P&I
- —
- Monthly cashflow
- —
- DSCR
- —
- Eligible?
- —
No personal income docs; deal must DSCR.
Hard money
10% down · 12.0% · 12mo
- Down + closing
- —
- Monthly P&I
- —
- Monthly cashflow
- —
- DSCR
- —
- Eligible?
- —
Short-term bridge; refi at stabilization.
Listing history 16 events
-
2026-06-22days on market $209,900 Active 40 DOM
-
2026-06-18days on market $209,900 Active 37 DOM
-
2026-06-17days on market $209,900 Active 36 DOM
-
2026-06-16days on market $209,900 Active 35 DOM
-
2026-06-15days on market $209,900 Active 34 DOM
-
2026-06-14days on market $209,900 Active 32 DOM
-
2026-06-10days on market $209,900 Active 29 DOM
-
2026-06-09days on market $209,900 Active 28 DOM
-
2026-06-08days on market $209,900 Active 27 DOM
-
2026-06-07days on market $209,900 Active 26 DOM
-
2026-06-03days on market $209,900 Active 22 DOM
-
2026-06-02days on market $209,900 Active 21 DOM
-
2026-06-01days on market $209,900 Active 20 DOM
-
2026-05-31days on market $209,900 Active 19 DOM
-
2026-05-30days on market $209,900 Active 18 DOM
-
2026-05-12$209,900 Active 553-char remark
ⓘ Source: listings_history table (triggers on properties + properties_extension) + one-shot
backfill from property_details.listing_events for pre-trigger history.
Climate risk First Street
- Flood 1/10 Low FEMA zone X (unshaded) · 0% chance over 30 yrs
- Wildfire 3/10 Moderate
- Heat 8/10 Severe 7 d/yr ≥110°F today · 23 d/yr by 30 yrs out
- Wind 9/10 Extreme 99% chance of damaging wind over 30 yrs
- Air quality 1/10 Low 0 unhealthy d/yr today · 0 by 30 yrs out
Nearby sold comps map
Loading sold comps map…
Walkable amenities ~0.75 mi
Loading nearby amenities…
Taxation est. · year 1
- Rental income
- $25,186
- − Mortgage interest
- −$11,758
- − Property taxes
- −$3,148
- − Insurance
- −$1,050
- − Repairs & maintenance
- −$2,015
- − Management
- −$2,015
- − Depreciation
- −$6,106
- Taxable loss
- −$906
- Est. tax savings @ 24.0%
- +$217
- After-tax cash flow
- $2,707/yr
For passive investors: Depreciation is non-cash, so a rental often shows a tax loss while cash-flowing — sheltering income. Rental losses are passive: they offset passive income freely, and up to $25,000/yr can offset ordinary (W-2) income if you actively participate and your MAGI is under $100k (phasing out to $0 by $150k); unused losses carry forward. On sale, claimed depreciation is recaptured at up to 25%, and gains may owe capital-gains tax (a 1031 exchange can defer both). Figures are a year-1 estimate at your 24.0% rate — not tax advice; consult a CPA.
Condition & rehab AI · 14 photos
This property requires moderate renovations to modernize the kitchen and bathrooms, and improve the landscaping. It has potential for significant value increase.
Repairs flagged
- Moderate kitchen cabinets — dated and in need of replacement
- Moderate bathroom cabinets — dated and in need of replacement
- Major landscaping — overgrown vegetation needs trimming and landscaping
Value-add opportunities
- Both kitchen renovation — modernizing the kitchen would increase both resale and rental value
- Both bathroom renovation — modernizing the bathrooms would increase both resale and rental value
- Both landscaping — trimming and landscaping would improve curb appeal and increase both resale and rental value
Renovation cost estimate screening
| Repair item | Severity | Est. cost |
|---|---|---|
| kitchen cabinets · dated and in need of replacement | Moderate | $3,000–15,000 |
| bathroom cabinets · dated and in need of replacement | Moderate | $3,000–15,000 |
| landscaping · overgrown vegetation needs trimming and landscaping | Major | $15,000–50,000 |
| Total estimated repair cost · 3 items | $21,000–80,000 |
Value-add ROI direction
- Both kitchen renovation — modernizing the kitchen would increase both resale and rental value ↑
- Both bathroom renovation — modernizing the bathrooms would increase both resale and rental value ↑
- Both landscaping — trimming and landscaping would improve curb appeal and increase both resale and rental value ↑
ⓘ Cost ranges are severity-bucket heuristics (US national rule-of-thumb). Get contractor quotes + a written scope before underwriting a rehab budget.
Schools (NCES district)
- District
- San Benito CISD
- NCES district ID
- 4838790
- Math proficiency
- 14% ▼ -31.00%
- Reading proficiency
- 27% ▼ -10.00%
- Median HH income
- $29,403
- Composite
- 16.31/100
- National rank
- #9212
- State rank
- #782 of 826 in TX
Livability — Rangerville
- Score
- 41/100
- State rank
- #1592
- US rank
- #27164
Category grades
Schools grade is shown separately in the Schools card above.
Census & demographics
- County
- Harris County · 4,702,590 people
- City population
- 3,226,434
- Metro
- Houston-The Woodlands-Sugar Land, TX
- Population (ZIP)
- 130,028
- Household income
- $87,808
- Rent vs Own
- Severe rent burden
- 3088.0
Population outlook (Cameron County) Hauer SSP2
- Today (2025)
- 441,603 people
- By 2030
- 448,113 · +1.5%
- By 2040
- 456,385 · +3.3%
- By 2050
- 456,294 · +3.3%
- By 2075
- 423,851 · -4.0%
- By 2100
- 342,787 · -22.4%
Race, ethnicity, and origin ACS 2023
- Neighborhood character
- Diverse neighborhood (Simpson 0.68)
- Race & ethnicity
- Hispanic / Latino 49% Two or more races 22% Black 20% White 19% Asian 6%
- Hispanic origin (detail)
- Mexican 26% Puerto Rican 1% Cuban 4%
- Common ancestry
- Lithuanian 1% Italian 1%
- Foreign-born
- 32% · Canada, Jamaica, Vietnam
- Languages at home
- 48% English-only · Spanish 40% Other Indo-European 3% Vietnamese 1%
Political lean MEDSL · Cameron
- 2024 margin
- Lean R (+5.8) · D 46.7% · R 52.5%
- 2008→2024 swing
- -34.6pp toward R · 2008: 28.8pp · 2024: -5.8pp
- All cycles
- 2024: R+5.8 2020: D+13.2 2016: D+32.5 2012: D+32.4 2008: D+28.8
Not yet ingested
- Civics
- —
Market trends
- HPI YoY
- ▼ -1.27%
- Current HPI
- 254.6622
- Rent YoY
- ▼ -2.86%
- Metro
- Houston-The Woodlands-Sugar Land, TX
- State GDP YoY
- ▲ 3.95%
- F500 in state
- 110
Industry mix (Fortune 500 HQ in TX)
| Industry | F500 HQs | Revenue |
|---|---|---|
| Energy | 16 | $1,198B |
|
||
| Technology | 5 | $198B |
|
||
| Engineering / Construction | 4 | $72B |
|
||
| Energy Services | 3 | $60B |
|
||
| Utilities | 3 | $41B |
|
||
| Healthcare | 2 | $330B |
|
||
Price history
1 event — show timeline
- 2026-05-12 Listed $209,900 MCALLENMLS
Cash-flow waterfall
monthlySold comps — $/sqft
last 12 mo · ≤1 miLoading sold comps…