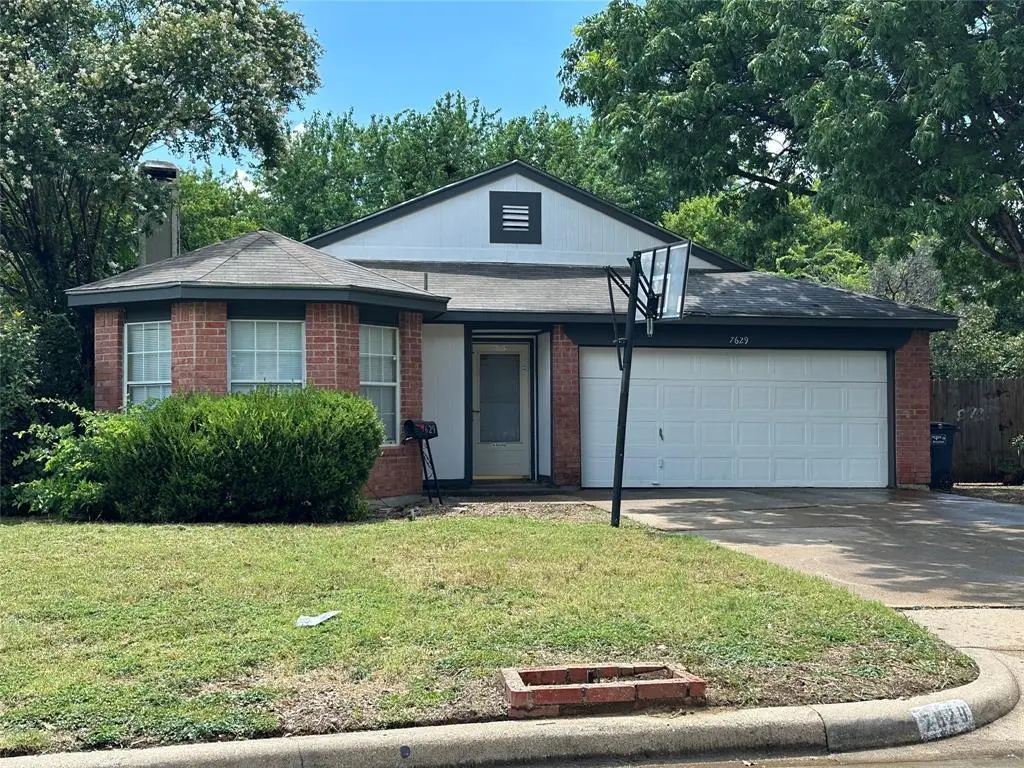
7629 Misty Ridge Dr N · Fort Worth, TX
Flood risk 1/10 · Minimal
- FEMA flood zone
- X (unshaded)
- Chance of flooding over 30 yrs
- 0.0%
- Est. flood insurance / yr
- $507 – $1,088
Fire risk 3/10 · Minor
- Est. fire insurance / yr
- $1,222 – $2,270
Heat risk 7/10 · Major
- Hot days now (above 109°F)
- 7 days/yr
- Hot days in 30 yrs
- 23 days/yr
Wind risk 4/10 · Minor
- Chance of severe wind over 30 yrs
- 19.0%
Air-quality risk 4/10 · Minor
- Unhealthy air days now
- 4 days/yr
- Unhealthy air days in 30 yrs
- 5 days/yr
Risk factors via First Street. Map © Google.
Why this score? — see what drove the D grade
The composite is a weighted blend of 9 inputs, each scored 0–100. Each bar is that input's sub-score; the figure is the points it added to the 100-point composite (weight × sub-score).
- Cash flow +10.9/30.0
- ARV discount +10.0/15.0
- Schools +4.8/10.0
- Livability +4.0/5.0
- DSCR +3.2/10.0
- 1% rule +2.6/10.0
- Condition / age +2.5/5.0
- Rent growth +2.2/5.0
- Appreciation +0.0/10.0
$259,900
🖨 Deal sheet 📄 Offer letter ✓ Due diligence
Listing remarks MLS
Welcome to this spacious 3-bedroom, 2-bath home located in the desirable Huntington Village addition in Keller ISD. Offering 1,471 sq ft of living space, this property is being sold as is, providing a great opportunity for buyers to add their personal touch. Please note, the owner has never lived in the home.The heart of the home is the generous living room, featuring a striking rock fireplace — perfect for cozy evenings or entertaining guests. The large primary bedroom measures an impressive 15’ x 18’ and boasts its own inviting fireplace, creating a private and comfortable retreat. Whether you’re a first-time buyer, investor, or someone looking to customize a home to your tastes, this property has tons of potential. Don’t miss your chance to own in a well-established neighborhood with convenient access to local amenities. Buyers and Buyers Agents to verify all information.
Key facts
- Convenient access
- Rock fireplace
- Generous living room
Tags
Neighborhood map
What this means for you Summary
Snapshot
- This is a 3-bed/2.0-bath single-family listed at $260k.
Deal economics
- At list price, monthly cash flow is $-112 ($-1k/yr) — negative.
- To cash-flow at today's rent, offer at most $240k (7.6% below list).
- To meet the 1% rule (rent ≥ 1% of price), the offer needs to be $197k (24.1% below list).
- Recommended offer: $197k (24.1% below list) — sets the bar for 1% rule.
- Cap rate 5.8% vs local median 3.9% in Fort Worth — top-decile yield for the area; either an underpriced asset or a hidden risk that comps aren't pricing in. Stress-test before assuming the spread holds.
Location & tenants
- Location reads 80/100 on livability (#49 in TX, #1,954 nationally) — a professional / high-income tenant draw. Strengths: amenities A+, cost of living A+, housing A+; Watch: schools D+, crime F.
- Keller ISD (urban): math 50% / reading 54% proficiency, ranked #91 of 826 in TX (top 11%) — acceptable for families but not a draw, mixed tenant base, ~2y average lease; only 19% free/reduced lunch — higher-income household profile.
- Market conditions: Rents soft (-1.4%/yr); 213 active listings in the ZIP; 40 comparable units currently listed for rent nearby; rentals at typical pace (median 17d on market — plan ~3-4 weeks tenant-placement turnaround); solid renter incomes; 18,938 units permitted in Tarrant County in 2024 (8,336 in 5+ unit buildings).
Forward outlook
- Local home prices are declining (-3.0%/yr); year-one equity from $2k of loan paydown is wiped out by about $8k of value loss. Plan a longer hold.
- Tarrant County population projected at +41% by 2050 — long-run rental-demand tailwind backs the buy-and-hold thesis.
Negotiation context
- It's been on market 123 days — a 12% lower offer ($229k) is reasonable based on typical stale-listing flexibility.
- 3 sale attempts since 22y ago with the ask held roughly flat each time — persistent listings suggest the price (not the market) is what's stuck; bring a comps-based counter.
Risks & watch-outs
- Climate carrying-cost: extreme-heat days projected 7→23/yr by 2055 (HVAC capex compounding) — expect insurance premiums to compound above CPI over the hold.
Questions for the listing agent
- What do current leases actually rent for vs. the listed asking? Can we see a recent rent roll and the last 12 months of T-12 income?
- It's been on market 123 days. Have you received any prior offers? Is the seller open to a 24% concession, seller financing, or rate buy-down credit?
- Why hasn't it sold? Are there any deal-killer items the seller is aware of (foundation, flood, title, zoning, code violations)?
- Is there a deadline driving the sale (1031 exchange, divorce, estate, relocation)? That informs how much negotiation room exists.
- Schools are D-rated, which usually means shorter tenancies and higher turnover. Who's the typical renter profile here, and what's been the actual vacancy rate?
- Crime grade is F in this area — have there been break-ins, vandalism, or insurance claims at this property in the last 3 years? What carrier currently insures it and at what premium?
- The area grade is low — what's the realistic commute time and amenity access for the typical tenant pool here? Any planned neighborhood developments (good or bad) we should know about?
- What's the average days-on-market for RENTAL listings here right now (not sales)? A rising rental-DOM trend means longer vacancies and softer asking-rent achievability than the comps imply.
- What's the recent tenant-quality profile in this submarket — average credit score on applications, eviction rate, late-payment / NSF rate, and stable-employment percentage? A property-management company in the area should have these aggregated.
- How much new for-sale + rental construction is in the pipeline within 1–3 miles? Heavy new supply typically softens prices + rents 12–24 months out; constrained supply supports both.
Investment metrics
- 1% rule
- 0.76% ✗
- Cap rate
- 5.77%
- Cash-on-cash
- -1.85%
- DSCR
- 0.92
- GRM
- 11.0
CMA / ARV
- ARV (median comp)
- $275,062
- List price
- $259,900
- Delta
- -5.51%
- Verdict
- FAIR
- Comps
- 20 within 1.0 mi
Show comp detail 12 sales within ~0.75 mi
| Address | Dist | Beds/Ba | Sqft | Sold | Price | $/sf | Match |
|---|---|---|---|---|---|---|---|
| 4232 Staghorn Cir N | 0.64mi | 3/2.0 | 1,470 (-0%) | 2mo | $284,900 | $194 | 69 |
| 4637 Feathercrest Dr | 0.17mi | 3/2.0 | 1,272 (-14%) | 3mo | $270,000 | $212 | 67 |
| 4617 Bracken Dr | 0.17mi | 3/2.0 | 1,263 (-14%) | 2mo | $280,000 | $222 | 67 |
| 4804 Davy Crockett Trl | 0.57mi | 3/2.0 | 1,512 (+3%) | 3mo | $315,000 | $208 | 66 |
| 4657 Misty Ridge Dr | 0.21mi | 3/2.0 | 1,681 (+14%) | 1mo | $310,000 | $184 | 66 |
| 4016 Bristlecone Ln | 0.53mi | 3/2.0 | 1,583 (+8%) | 1mo | $295,000 | $186 | 62 |
| 4104 Huckleberry Dr | 0.68mi | 3/2.0 | 1,528 (+4%) | 1mo | $310,000 | $203 | 61 |
| 4748 Moss Rose Dr | 0.70mi | 3/2.0 | 1,416 (-4%) | 1mo | $260,000 | $184 | 60 |
| 4673 Rincon Way | 0.69mi | 3/2.0 | 1,581 (+8%) | 2mo | $325,000 | $206 | 54 |
| 7958 Crystal Creek Cir | 0.71mi | 3/2.0 | 1,614 (+10%) | 1mo | $335,000 | $208 | 49 |
| 4124 Buckwheat St | 0.64mi | 3/2.0 | 1,677 (+14%) | 2mo | $299,900 | $179 | 45 |
| 8001 Berkshire Dr | 0.75mi | 3/2.0 | 1,659 (+13%) | 2mo | $325,000 | $196 | 43 |
Match score weights: distance 35% · size 25% · config 20% · recency 20%. Top-matched comps best support the ARV.
Projected returns pro-forma
-3.0% appreciation · 0.0% rent growth · sell at horizon
- IRR
- -22.5%
- Equity multiple
- 0.24×
- Total profit
- $-55,092
- Equity at exit
- $38,752
- IRR
- -26.0%
- Equity multiple
- -0.10×
- Total profit
- $-79,706
- Equity at exit
- $22,471
Cash invested: $72,772 (down + closing). Projections, not guarantees.
Landlord ↔ Tenant lean methodology
- Overall (STATE)
- 87 Strongly Landlord-Friendly
- State Texas
- 87 Strongly Landlord-Friendly · R+5
- County
- — inherits STATE
- City
- — inherits STATE
ZIP-level market 76137
- Home prices YoY
- -28.8%
- Rents YoY
- -1.4%
- Active inventory
- 213
- Price-to-rent
- 11.0×
Monthly cashflow live
- Estimated rent
- $1,972 high interval (Pro) →
- Mortgage (P&I)
- −$1,363
- Tax from tax record
- −$199 /mo · $2,384/yr
- Insurance
- −$108
- HOA
- −$0
- Vacancy / Maint / Mgmt
- −$414
- Net cashflow
- $-112
Break-even live
UW: 25.0% down · 7.5% · 30yr · 1.5% tax · 5.0% vac · 8.0% maint · 8.0% mgmt
Financing live
Cash to close
- Down payment
- $64,975
- Closing costs
- $7,797
- Reserves months
- —
- Total cash needed
- —
Loan-product check · same deal, 3 products live
Conventional
25% down · 7.5% · 30yr
- Down + closing
- —
- Monthly P&I
- —
- Monthly cashflow
- —
- DSCR
- —
- Eligible?
- —
Personal DTI + credit; lowest rate.
DSCR
20% down · 8.5% · 30yr
- Down + closing
- —
- Monthly P&I
- —
- Monthly cashflow
- —
- DSCR
- —
- Eligible?
- —
No personal income docs; deal must DSCR.
Hard money
10% down · 12.0% · 12mo
- Down + closing
- —
- Monthly P&I
- —
- Monthly cashflow
- —
- DSCR
- —
- Eligible?
- —
Short-term bridge; refi at stabilization.
Rent comps 40 comps
| Address | Beds | Baths | Sqft | Rent | $/sqft | DOM | Units | Dist |
|---|---|---|---|---|---|---|---|---|
| 4625 Goldrock Dr Fort Worth, TX | 3.0 | 2.5 | 1712 | $2,050 | $1.20 | 43d | 1 | 0.09mi |
| 4653 Feathercrest Dr Fort Worth, TX | 3.0 | 2.0 | 1272 | $1,925 | $1.51 | 18d | 1 | 0.17mi |
| 4652 Misty Ridge Dr Fort Worth, TX | 3.0 | 2.0 | 1659 | $1,900 | $1.15 | 43d | 1 | 0.22mi |
| 4648 Birchbend Ln Fort Worth, TX | 3.0 | 2.0 | 1322 | $1,850 | $1.40 | 21d | 1 | 0.23mi |
| 4300 Campion Ln Fort Worth, TX | 3.0 | 2.0 | 1740 | $2,250 | $1.29 | 17d | 1 | 0.27mi |
| 4621 Riverpark Dr Fort Worth, TX | 3.0 | 2.0 | 1238 | $1,800 | $1.45 | 10d | 1 | 0.36mi |
| 4612 Parkmount Dr Fort Worth, TX | 4.0 | 2.0 | 1870 | $2,215 | $1.18 | 1d | 1 | 0.39mi |
| 4741 Birchbend Ln Fort Worth, TX | 3.0 | 2.0 | 1313 | $1,850 | $1.41 | 13d | 1 | 0.40mi |
| 4208 Staghorn Cir S Fort Worth, TX | 3.0 | 2.0 | 1470 | $2,075 | $1.41 | 7d | 1 | 0.43mi |
| 4105 Shagbark St Fort Worth, TX | 3.0 | 2.0 | 1552 | $1,895 | $1.22 | 20d | 1 | 0.46mi |
| 7432 Blackthorn Dr Fort Worth, TX | 3.0 | 2.0 | 1444 | $1,995 | $1.38 | 3d | 1 | 0.51mi |
| 7308 Bristlecone Ct Fort Worth, TX | 3.0 | 2.0 | 1677 | $2,061 | $1.23 | 24d | 1 | 0.52mi |
| 4779 Wineberry Dr Fort Worth, TX | 3.0 | 2.0 | 1188 | $2,050 | $1.73 | 43d | 1 | 0.56mi |
| 7916 Salmon Run Way Fort Worth, TX | 3.0 | 2.0 | 1819 | $2,500 | $1.37 | 43d | 1 | 0.56mi |
| 7000 N Beach St Unit 7057 Fort Worth, TX | 2.0 | 2.0 | 879 | $1,504 | $1.71 | 12d | 1 | 0.59mi |
| 7000 N Beach St Unit 7037 Fort Worth, TX | 2.0 | 2.0 | 1050 | $1,684 | $1.60 | 43d | 1 | 0.59mi |
| 7000 N Beach St Unit 7023 Fort Worth, TX | 2.0 | 2.0 | 1050 | $1,741 | $1.66 | 2d | 1 | 0.59mi |
| 7000 N Beach St Unit 7037 Fort Worth, TX | 2.0 | 2.0 | 879 | $1,504 | $1.71 | 13d | 1 | 0.59mi |
| 7000 N Beach St Fort Worth, TX | 2.0 | 2.0 | 971 | $1,659 | $1.71 | 43d | 1 | 0.60mi |
| 4020 Blue Flag Ln Fort Worth, TX | 3.0 | 2.0 | 1454 | $2,025 | $1.39 | 14d | 1 | 0.60mi |
| 7321 Indiana Ave Fort Worth, TX | 3.0 | 2.0 | 1805 | $1,989 | $1.10 | 43d | 1 | 0.62mi |
| 4017 Dogwood Ln Fort Worth, TX | 3.0 | 2.0 | 1677 | $2,000 | $1.19 | 43d | 1 | 0.63mi |
| 4113 Pepperbush Dr Fort Worth, TX | 3.0 | 2.0 | 1162 | $1,795 | $1.54 | 4d | 1 | 0.63mi |
| 4208 Staghorn Cir N Fort Worth, TX | 3.0 | 2.0 | 1470 | $2,075 | $1.41 | 7d | 1 | 0.65mi |
| 4621 Rose of Sharon Ln Fort Worth, TX | 3.0 | 2.0 | 1118 | $1,800 | $1.61 | 17d | 1 | 0.69mi |
| 7305 Shadow Bend Dr Fort Worth, TX | 3.0 | 2.0 | 1362 | $1,870 | $1.37 | 43d | 1 | 0.73mi |
| 7204 Shadow Bend Dr Fort Worth, TX | 3.0 | 2.0 | 1013 | $1,940 | $1.92 | 43d | 1 | 0.74mi |
| 7204 Shadow Bend Dr Fort Worth, TX | 3.0 | 2.0 | 1013 | $1,650 | $1.63 | 13d | 1 | 0.74mi |
| 4716 Rose of Sharon Ln Fort Worth, TX | 3.0 | 2.0 | 1176 | $2,095 | $1.78 | 14d | 1 | 0.75mi |
| 6960 N Beach St Fort Worth, TX | 1.0–3.0 | 1.0–2.0 | 908 | $1,929 | $2.12 | 1d | 33 | 0.76mi |
| 3728 Flintwood Trl Fort Worth, TX | 2.0 | 1.0 | 1048 | $1,850 | $1.77 | 4d | 1 | 0.77mi |
| 6901 N Beach St Fort Worth, TX | 1.0–3.0 | 1.0–2.0 | 855 | $1,596 | $1.87 | 43d | 1 | 0.79mi |
| 3728 Staghorn Cir S Fort Worth, TX | 3.0 | 2.0 | 1104 | $1,700 | $1.54 | 3d | 1 | 0.79mi |
| 7009 Shadow Bend Dr Fort Worth, TX | 3.0 | 2.0 | 1044 | $1,900 | $1.82 | 14d | 1 | 0.80mi |
| 7116 Wayfarer Trl Fort Worth, TX | 3.0 | 2.0 | 1295 | $1,796 | $1.39 | 18d | 1 | 0.82mi |
| 6921 Black Wing Dr Fort Worth, TX | 3.0 | 2.0 | 1508 | $2,025 | $1.34 | 2d | 1 | 0.83mi |
| 4066 Tulip Tree Dr Fort Worth, TX | 3.0 | 2.0 | 1722 | $2,045 | $1.19 | 7d | 1 | 0.83mi |
| 4066 Tulip Tree Dr Fort Worth, TX | 3.0 | 2.0 | 1722 | $2,045 | $1.19 | 3d | 1 | 0.83mi |
| 4241 Iris Ave Fort Worth, TX | 3.0 | 2.0 | 1421 | $1,975 | $1.39 | 24d | 1 | 0.84mi |
| 6806 Silver Sage Dr Fort Worth, TX | 3.0 | 2.0 | 1500 | $2,100 | $1.40 | 43d | 1 | 0.84mi |
Listing history 21 events
-
2026-06-18days on market $259,900 Active 123 DOM
-
2026-06-17days on market $259,900 Active 122 DOM
-
2026-06-16days on market $259,900 Active 121 DOM
-
2026-06-15days on market $259,900 Active 120 DOM
-
2026-06-13days on market $259,900 Active 118 DOM
-
2026-06-09days on market $259,900 Active 114 DOM
-
2026-06-08days on market $259,900 Active 113 DOM
-
2026-06-07days on market $259,900 Active 112 DOM
-
2026-06-04days on market $259,900 Active 109 DOM
-
2026-06-03days on market $259,900 Active 108 DOM
-
2026-06-02days on market $259,900 Active 107 DOM
-
2026-06-01days on market $259,900 Active 106 DOM
-
2026-05-31days on market $259,900 Active 105 DOM
-
2026-02-05$259,900 Active 919-char remark
Show marketing remark (919 chars)
Welcome to this spacious 3-bedroom, 2-bath home located in the desirable Huntington Village addition in Keller ISD. Offering 1,471 sq ft of living space, this property is being sold as is, providing a great opportunity for buyers to add their personal touch. Please note, the owner has never lived in the home.The heart of the home is the generous living room, featuring a striking rock fireplace — perfect for cozy evenings or entertaining guests. The large primary bedroom measures an impressive 15’ x 18’ and boasts its own inviting fireplace, creating a private and comfortable retreat. Whether you’re a first-time buyer, investor, or someone looking to customize a home to your tastes, this property has tons of potential. Don’t miss your chance to own in a well-established neighborhood with convenient access to local amenities. Buyers and Buyers Agents to verify all information.
-
2025-12-18historical
-
2025-07-18$279,900 Active
-
2004-12-30soldstatus
-
2004-12-27soldstatus
-
2004-11-29historical
-
2004-11-29$109,000
-
1990-11-02soldstatus
ⓘ Source: listings_history table (triggers on properties + properties_extension) + one-shot
backfill from property_details.listing_events for pre-trigger history.
Tax reassessment forecast TX · Resets to sale price
- Current annual tax
- $2,384 · $199/mo
- Projected year-2 tax
- $4,756 · $396/mo
- Expected delta
- +$2,372/yr (+$198/mo · 99.5%)
ⓘ Screening estimate from a state-policy table — verify with the county assessor before closing.
Climate risk First Street
- Flood 1/10 Low FEMA zone X (unshaded) · 0% chance over 30 yrs
- Wildfire 3/10 Moderate
- Heat 7/10 Severe 7 d/yr ≥109°F today · 23 d/yr by 30 yrs out
- Wind 4/10 Moderate 19% chance of damaging wind over 30 yrs
- Air quality 4/10 Moderate 4 unhealthy d/yr today · 5 by 30 yrs out
Nearby sold comps map
Loading sold comps map…
Walkable amenities ~0.75 mi
Loading nearby amenities…
Taxation est. · year 1
- Rental income
- $23,661
- − Mortgage interest
- −$14,558
- − Property taxes
- −$2,384
- − Insurance
- −$1,300
- − Repairs & maintenance
- −$1,893
- − Management
- −$1,893
- − Depreciation
- −$7,561
- Taxable loss
- −$5,928
- Est. tax savings @ 24.0%
- +$1,423
- After-tax cash flow
- $75/yr
For passive investors: Depreciation is non-cash, so a rental often shows a tax loss while cash-flowing — sheltering income. Rental losses are passive: they offset passive income freely, and up to $25,000/yr can offset ordinary (W-2) income if you actively participate and your MAGI is under $100k (phasing out to $0 by $150k); unused losses carry forward. On sale, claimed depreciation is recaptured at up to 25%, and gains may owe capital-gains tax (a 1031 exchange can defer both). Figures are a year-1 estimate at your 24.0% rate — not tax advice; consult a CPA.
Schools (NCES district)
- District
- Keller ISD
- NCES district ID
- 4825260
- Math proficiency
- 50% ▼ -14.00%
- Reading proficiency
- 54% ▼ -9.00%
- Median HH income
- $92,106
- Composite
- 48.46/100
- National rank
- #2131
- State rank
- #91 of 826 in TX
Livability — Fort Worth
- Score
- 80/100
- State rank
- #49
- US rank
- #1954
Category grades
Schools grade is shown separately in the Schools card above.
Census & demographics
- Census place
- Fort Worth, TX
- County
- Tarrant County · 2,033,669 people
- City population
- 911,619
- Metro
- Dallas-Fort Worth-Arlington, TX
- Population (ZIP)
- 60,352
- Household income
- $90,718
- Rent vs Own
- Severe rent burden
- 1857.0
Population outlook (Tarrant County) Hauer SSP2
- Today (2025)
- 2,380,417 people
- By 2030
- 2,578,900 · +8.3%
- By 2040
- 2,974,995 · +25.0%
- By 2050
- 3,350,489 · +40.8%
- By 2075
- 4,216,909 · +77.2%
- By 2100
- 4,741,527 · +99.2%
Race, ethnicity, and origin ACS 2023
- Neighborhood character
- Highly diverse neighborhood (Simpson 0.70)
- Race & ethnicity
- White 46% Hispanic / Latino 24% Black 15% Two or more races 13% Asian 10%
- Hispanic origin (detail)
- Mexican 18% Puerto Rican 1%
- Common ancestry
- Italian 2% Lithuanian 1% Slovak 1%
- Foreign-born
- 16% · Canada, Vietnam, South Korea
- Languages at home
- 74% English-only · Spanish 15% Other Indo-European 4% Vietnamese 2%
Political lean MEDSL · Tarrant
- 2024 margin
- Lean R (+5.1) · D 46.7% · R 51.9% · Other 1.4%
- 2008→2024 swing
- +6.6pp toward D · 2008: -11.7pp · 2024: -5.1pp
- All cycles
- 2024: R+5.1 2020: D+0.2 2016: R+8.7 2012: R+15.7 2008: R+11.7
Not yet ingested
- Civics
- —
Market trends
- HPI YoY
- ▼ -108.62%
- Current HPI
- 268.8753
- Rent YoY
- ▼ -1.37%
- Metro
- Dallas-Fort Worth-Arlington, TX
- State GDP YoY
- ▲ 3.95%
- F500 in state
- 110
Industry mix (Fortune 500 HQ in TX)
| Industry | F500 HQs | Revenue |
|---|---|---|
| Energy | 16 | $1,198B |
|
||
| Technology | 5 | $198B |
|
||
| Engineering / Construction | 4 | $72B |
|
||
| Energy Services | 3 | $60B |
|
||
| Utilities | 3 | $41B |
|
||
| Healthcare | 2 | $330B |
|
||
Price history
+138.4% since first listed8 events — show timeline
- 2026-02-05 Listed $259,900 NTREIS
- 2025-12-18 Listing Removed — NTREIS
- 2025-07-18 Listed $279,900 NTREIS
- 2004-12-30 Sold (Public Records) — Public Records
- 2004-12-27 Sold (MLS) — NTREIS
- 2004-11-29 Listed $109,000 NTREIS
- 2004-11-29 Listing Removed — NTREIS
- 1990-11-02 Sold (Public Records) — Public Records
Property tax history
+0.4%/yrLatest (2025): $2,384 · -59.1% YoY. Source: county tax records.
Cash-flow waterfall
monthlySold comps — $/sqft
last 12 mo · ≤1 miLoading sold comps…