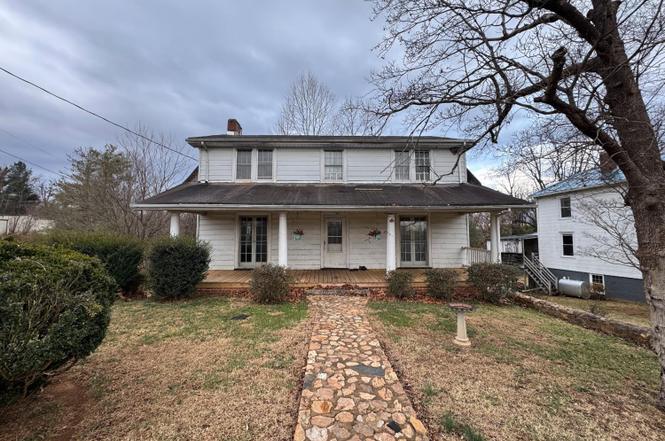
109 Cedar Gate Rd · Madison Heights, VA
Flood risk No data
- FEMA flood zone
- —
- Chance of flooding over 30 yrs
- —
- Est. flood insurance / yr
- —
Fire risk No data
- Est. fire insurance / yr
- —
Heat risk No data
- Hot days now (above threshold)
- —
- Hot days in 30 yrs
- —
Wind risk No data
- Chance of severe wind over 30 yrs
- —
Air-quality risk No data
- Unhealthy air days now
- —
- Unhealthy air days in 30 yrs
- —
Risk factors via First Street. Map © Google.
Why this score? — see what drove the B- grade
The composite is a weighted blend of 9 inputs, each scored 0–100. Each bar is that input's sub-score; the figure is the points it added to the 100-point composite (weight × sub-score).
- Cash flow +30.0/30.0
- DSCR +10.0/10.0
- 1% rule +8.7/10.0
- ARV discount +7.5/15.0
- Schools +4.4/10.0
- Livability +3.7/5.0
- Rent growth +2.5/5.0
- Condition / age +2.5/5.0
- Appreciation +0.0/10.0
$95,000
🖨 Deal sheet 📄 Offer letter ✓ Due diligence
Listing remarks
Built in 1931, this Amherst County home is ready for a full renovation and a fresh vision. Featuring charming porches on the first and second stories. This home is an ideal opportunity for investors or buyers looking to restore a classic home to its former glory. Great location only minutes from shopping and dining. This home is being sold as-is where-is.
Key facts
- Great location
- Full renovation
- 0.51 acre lot
Tags
Neighborhood map
What this means for you Summary
Snapshot
- This is a 3-bed/1.0-bath single-family listed at $95k.
Deal economics
- At list price, monthly cash flow is $453 ($5k/yr) — positive.
- The deal already cash-flows at list — no discount required.
- Meets the 1% rule at list price ($1k rent vs $95k).
- Recommended offer: $89k (6.0% below list) — sets the bar for market timing.
- Cap rate 12.0% vs local median 3.4% in Madison Heights — top-decile yield for the area; either an underpriced asset or a hidden risk that comps aren't pricing in. Stress-test before assuming the spread holds.
Location & tenants
- Location reads 73/100 on livability (#166 in VA) — a middle-class / working-renter tenant base. Strengths: cost of living A+, housing A+, commute B; Watch: health & safety C-, employment D, amenities F.
- Amherst County Public School District (rural): math 40% / reading 64% proficiency, ranked #94 of 131 in VA (top 72%) — acceptable for families but not a draw, mixed tenant base, ~2y average lease.
- Zoned schools: Amelon Elementary (math 42% / reading 57%, grade D, #742 of 1,108 statewide, top 70%, 438 students, 78% FRL); Monelison Middle (math 25% / reading 59%, grade D-, #295 of 342 statewide, top 87%, 513 students, 77% FRL); Amherst County High (math 57% / reading 81%, grade B, #170 of 319 statewide, top 55%, 1,260 students, 75% FRL) — zoned schools average 77% FRL vs 42% district-wide (34 pts higher); higher-poverty schools than district average — tighter screening recommended.
- Market conditions: 51 active listings in the ZIP; 228 units permitted in Amherst County in 2024 (108 in 5+ unit buildings).
Forward outlook
- Local home prices are declining (-3.0%/yr); year-one equity from $657 of loan paydown is wiped out by about $3k of value loss. Plan a longer hold.
- Amherst County population projected at -28% by 2050 — secular population decline; favor cash flow + early exit over multi-decade hold.
- At projected returns (-3.0% appreciation + 3.0% rent growth), your $27k cash investment doubles in ~6 years — after that, you're playing with house money.
Negotiation context
- It's been on market 75 days — a 6% lower offer ($89k) is reasonable based on typical stale-listing flexibility.
- 2 sale attempts; this cycle's ask has dropped $15k (14%) from the opening price — seller is motivated, your offer sets the floor, not the list.
- Current owner paid $44k; list at $95k implies a 116% gain — meaningful room to come down on a strong offer.
Risks & watch-outs
- Watch-outs: built in 1931 — expect roof / HVAC / electrical / plumbing capex.
Questions for the listing agent
- It's been on market 75 days. Have you received any prior offers? Is the seller open to a 6% concession, seller financing, or rate buy-down credit?
- Built in 1931 — when were the roof, HVAC, electrical panel, plumbing, and water heater last replaced?
- Why hasn't it sold? Are there any deal-killer items the seller is aware of (foundation, flood, title, zoning, code violations)?
- Is there a deadline driving the sale (1031 exchange, divorce, estate, relocation)? That informs how much negotiation room exists.
- Schools are B-rated — typically a magnet for longer-tenancy family renters. What's the average tenant stay here, and is there a school-zone premium baked into asking?
- What's the average days-on-market for RENTAL listings here right now (not sales)? A rising rental-DOM trend means longer vacancies and softer asking-rent achievability than the comps imply.
- What's the recent tenant-quality profile in this submarket — average credit score on applications, eviction rate, late-payment / NSF rate, and stable-employment percentage? A property-management company in the area should have these aggregated.
- How much new for-sale + rental construction is in the pipeline within 1–3 miles? Heavy new supply typically softens prices + rents 12–24 months out; constrained supply supports both.
Investment metrics
- 1% rule
- 1.37% ✓
- Cap rate
- 12.02%
- Cash-on-cash
- 20.44%
- DSCR
- 1.91
- GRM
- 6.1
CMA / ARV
- ARV (on-the-fly)
- $313,250
- Comps found
- 2
Show comp detail 2 sales within ~0.75 mi
| Address | Dist | Beds/Ba | Sqft | Sold | Price | $/sf | Match |
|---|---|---|---|---|---|---|---|
| 105 Crescent Ln | 0.46mi | 4/2.0 (+1) | 1,938 (+11%) | 16mo | $120,000 | $62 | 39 |
| 195 Crescent Lane Ln | 0.63mi | 2/2.0 (-1) | 1,680 (-4%) | 22mo | $299,900 | $179 | 36 |
Match score weights: distance 35% · size 25% · config 20% · recency 20%. Top-matched comps best support the ARV.
Projected returns pro-forma
-3.0% appreciation · 3.0% rent growth · sell at horizon
- IRR
- 12.7%
- Equity multiple
- 1.51×
- Total profit
- $13,438
- Equity at exit
- $14,165
- IRR
- 21.6%
- Equity multiple
- 2.83×
- Total profit
- $48,747
- Equity at exit
- $8,214
Cash invested: $26,600 (down + closing). Projections, not guarantees.
Landlord ↔ Tenant lean methodology
- Overall (STATE)
- 55 Moderately Landlord-Leaning
- State Virginia
- 55 Moderately Landlord-Leaning · D+2
- County
- — inherits STATE
- City
- — inherits STATE
ZIP-level market 24574
- Home prices YoY
- -15.4%
- Active inventory
- 51
- Price-to-rent
- 6.1×
Monthly cashflow live
- Estimated rent
- $1,305 medium interval (Pro) →
- Mortgage (P&I)
- −$498
- Tax from tax record
- −$40 /mo · $476/yr
- Insurance
- −$40
- HOA
- −$0
- Vacancy / Maint / Mgmt
- −$274
- Net cashflow
- $453
Break-even live
UW: 25.0% down · 7.5% · 30yr · 1.5% tax · 5.0% vac · 8.0% maint · 8.0% mgmt
Financing live
Cash to close
- Down payment
- $23,750
- Closing costs
- $2,850
- Reserves months
- —
- Total cash needed
- —
Loan-product check · same deal, 3 products live
Conventional
25% down · 7.5% · 30yr
- Down + closing
- —
- Monthly P&I
- —
- Monthly cashflow
- —
- DSCR
- —
- Eligible?
- —
Personal DTI + credit; lowest rate.
DSCR
20% down · 8.5% · 30yr
- Down + closing
- —
- Monthly P&I
- —
- Monthly cashflow
- —
- DSCR
- —
- Eligible?
- —
No personal income docs; deal must DSCR.
Hard money
10% down · 12.0% · 12mo
- Down + closing
- —
- Monthly P&I
- —
- Monthly cashflow
- —
- DSCR
- —
- Eligible?
- —
Short-term bridge; refi at stabilization.
Listing history 6 events
-
2026-03-25status Pending
-
2026-03-09price $95,000
-
2026-02-27status Active
-
2026-02-11status Pending
-
2025-12-23$110,000 Active
-
1995-10-31soldstatus $44,000
ⓘ Source: listings_history table (triggers on properties + properties_extension) + one-shot
backfill from property_details.listing_events for pre-trigger history.
Tax reassessment forecast VA · Resets to sale price
- Current annual tax
- $476 · $40/mo
- Projected year-2 tax
- $779 · $65/mo
- Expected delta
- +$303/yr (+$25/mo · 63.7%)
ⓘ Screening estimate from a state-policy table — verify with the county assessor before closing.
Nearby sold comps map
Loading sold comps map…
Walkable amenities ~0.75 mi
Loading nearby amenities…
Taxation est. · year 1
- Rental income
- $15,654
- − Mortgage interest
- −$5,321
- − Property taxes
- −$476
- − Insurance
- −$475
- − Repairs & maintenance
- −$1,252
- − Management
- −$1,252
- − Depreciation
- −$2,764
- Taxable income
- $4,114
- Est. tax owed @ 24.0%
- −$987
- After-tax cash flow
- $4,450/yr
For passive investors: Depreciation is non-cash, so a rental often shows a tax loss while cash-flowing — sheltering income. Rental losses are passive: they offset passive income freely, and up to $25,000/yr can offset ordinary (W-2) income if you actively participate and your MAGI is under $100k (phasing out to $0 by $150k); unused losses carry forward. On sale, claimed depreciation is recaptured at up to 25%, and gains may owe capital-gains tax (a 1031 exchange can defer both). Figures are a year-1 estimate at your 24.0% rate — not tax advice; consult a CPA.
Schools (NCES district)
- District
- Amherst County Public School District
- NCES district ID
- 5100210
- Math proficiency
- 40% ▼ -42.00%
- Reading proficiency
- 64% ▼ -14.00%
- Median HH income
- $45,945
- Composite
- 43.96/100
- National rank
- #2900
- State rank
- #94 of 131 in VA
Livability — Madison Heights
- Score
- 73/100
- State rank
- #166
- US rank
- #5166
Category grades
Schools grade is shown separately in the Schools card above.
Census & demographics
- City population
- 15,744
- Population (ZIP)
- 4,071
Population outlook (Amherst County) Hauer SSP2
- Today (2025)
- 29,790 people
- By 2030
- 28,332 · -4.9%
- By 2040
- 24,963 · -16.2%
- By 2050
- 21,468 · -27.9%
- By 2075
- 14,111 · -52.6%
- By 2100
- 9,344 · -68.6%
Race, ethnicity, and origin ACS 2023
- Neighborhood character
- Predominantly White (77%)
- Race & ethnicity
- White 77% Black 17% Two or more races 3% Hispanic / Latino 2%
- Common ancestry
- Slovak 2% Iranian 1% Romanian 1%
- Foreign-born
- 4% · Canada, Philippines, Guatemala
- Languages at home
- 96% English-only · Spanish 1% Other Asian/Pacific 1%
Political lean MEDSL · Amherst
- 2024 margin
- Solid R (+36.5) · D 31.4% · R 67.9%
- 2008→2024 swing
- -20.3pp toward R · 2008: -16.2pp · 2024: -36.5pp
- All cycles
- 2024: R+36.5 2020: R+31.6 2016: R+30.7 2012: R+19.9 2008: R+16.2
Not yet ingested
- Civics
- —
Market trends
- HPI YoY
- ▼ -32.52%
- Current HPI
- 178.6127
- Rent YoY
- —
- Metro
- —
- State GDP YoY
- ▲ 2.40%
- F500 in state
- 50
Industry mix (Fortune 500 HQ in VA)
| Industry | F500 HQs | Revenue |
|---|---|---|
| Aerospace / Defense | 4 | $236B |
|
||
| Technology / Defense | 3 | $32B |
|
||
| Financial Services | 2 | $176B |
|
||
| Utilities | 2 | $27B |
|
||
| Insurance | 2 | $25B |
|
||
| Technology | 2 | $15B |
|
||
Price history
+115.9% since first listed6 events — show timeline
- 2026-03-25 Pending — LMLS
- 2026-03-09 Price Changed $95,000 LMLS
- 2026-02-27 Relisted — LMLS
- 2026-02-11 Pending — LMLS
- 2025-12-23 Listed $110,000 LMLS
- 1995-10-31 Sold (Public Records) $44,000 Public Records
Property tax history
-0.4%/yrLatest (2025): $476 · +0.0% YoY. Source: county tax records.
Cash-flow waterfall
monthlySold comps — $/sqft
last 12 mo · ≤1 miLoading sold comps…