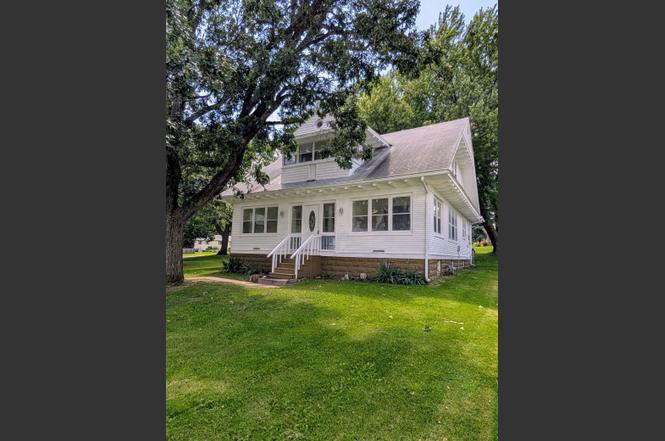
714 Main St · Emmons, MN
Flood risk 1/10 · Minimal
- FEMA flood zone
- X (unshaded)
- Chance of flooding over 30 yrs
- 0.0%
- Est. flood insurance / yr
- $507 – $1,088
Fire risk 2/10 · Minimal
- Est. fire insurance / yr
- $888 – $1,650
Heat risk 2/10 · Minimal
- Hot days now (above 98°F)
- 7 days/yr
- Hot days in 30 yrs
- 16 days/yr
Wind risk 2/10 · Minimal
- Chance of severe wind over 30 yrs
- —
Air-quality risk 1/10 · Minimal
- Unhealthy air days now
- 0 days/yr
- Unhealthy air days in 30 yrs
- 0 days/yr
Risk factors via First Street. Map © Google.
Why this score? — see what drove the D grade
The composite is a weighted blend of 9 inputs, each scored 0–100. Each bar is that input's sub-score; the figure is the points it added to the 100-point composite (weight × sub-score).
- Cash flow +12.9/30.0
- ARV discount +7.5/15.0
- Appreciation +5.0/10.0
- Schools +4.3/10.0
- DSCR +3.8/10.0
- Livability +3.4/5.0
- 1% rule +3.0/10.0
- Rent growth +2.5/5.0
- Condition / age +2.5/5.0
$155,000
🖨 Deal sheet (PDF) 📄 Offer letter ✓ Due diligence
Listing remarks
Discover your ideal home with this charming 4-bedroom residence featuring original woodwork that adds timeless character. Enjoy the convenience of a main floor bath and an upper-level bath, perfect for family living. Relax on the inviting front porch or take advantage of the spacious large lot, ideal for outdoor activities and gardening. This beautifully maintained property combines classic elegance with modern comfort—don’t miss your chance to make it yours!
Key facts
- Front porch
- Large lot
- Original woodwork
Tags
Property features AI
Exterior
- Parking: Concrete parking surface (no garage)
- Utilities: City water; City sewer; Natural gas; Electric with circuit breakers
- Home design: Residential property; Two levels; Entry faces the front (front porch)
- Construction: Asphalt roof; Block foundation; Built area includes 1,754 above-grade finished living area and 952 below-grade area
- Exterior features: Front porch; Wood exterior; City street frontage; Publicly maintained road; Lot approximately 0.366 acres (130 x 122)
Interior
- Kitchen: Range; Refrigerator; Kitchen window
- Bedrooms: 4 bedrooms total; Main floor bedroom; Upper level bedrooms
- Flooring: Hardwood floors
- Bathrooms: 1 full bath (upper level); 1 three-quarter bath (main floor)
- Heating & cooling: Hot water heating; No central air
- Interior features: Ceiling fans; Hardwood floors; Kitchen window; Natural woodwork; Porch; Separate/formal dining room; Main floor bedroom; Main floor laundry; Full, unfinished basement
- Laundry & utility: Washer; Dryer; Main floor laundry
Neighborhood map
What this means for you Summary
Snapshot
- This is a 4-bed/1.5-bath single-family listed at $155k.
Deal economics
- At list price, monthly cash flow is $-12 ($-149/yr) — negative.
- To cash-flow at today's rent, offer at most $153k (1.4% below list).
- To meet the 1% rule (rent ≥ 1% of price), the offer needs to be $124k (20.0% below list).
- Recommended offer: $124k (20.0% below list) — sets the bar for 1% rule.
Location & tenants
- Location reads 67/100 on livability (#432 in MN) — a middle-class / working-renter tenant base. Strengths: cost of living A+, housing A+; Watch: health & safety C-, crime D+, amenities F.
- Glenville-Emmons School District (rural): math 50% / reading 45% proficiency, ranked #305 of 467 in MN (top 65%) — families likely to look elsewhere, expect single-tenant / working-renter base with shorter leases.
- Zoned schools: Glenville Emmons Elementary (math 27% / reading 42%, grade F, #655 of 857 statewide, top 78%, 116 students, 48% FRL); Glenville-Emmons Secondary (math 24% / reading 24%, grade F, #383 of 471 statewide, top 88%, 98 students, 34% FRL) — zoned schools average 41% FRL vs 26% district-wide (16 pts higher); higher-poverty schools than district average — tighter screening recommended.
- Zoned-school proficiency averages 30% at this address vs 48% district-wide (-18 pts) — the specific schools serving this property underperform the Glenville-Emmons School District average; the district grade overstates school quality for this exact location.
- Market conditions: 3 active listings in the ZIP; 16 units permitted in Freeborn County in 2024 (0 in 5+ unit buildings).
Forward outlook
- In year one you build about $6k of equity ($1k loan paydown + $5k appreciation (3.0% local appreciation)).
- Freeborn County population projected at -11% by 2050 — secular population decline; favor cash flow + early exit over multi-decade hold.
- At projected returns (3.0% appreciation + 3.0% rent growth), your $43k cash investment doubles in ~7 years — after that, you're playing with house money.
- By year 6, paydown + projected appreciation supports a ~$30k cash-out refi (75% LTV) — recoverable capital for the next deal without selling this one.
Negotiation context
- It's been on market 277 days — a 12% lower offer ($136k) is reasonable based on typical stale-listing flexibility.
- 11 sale attempts since 18y ago; this cycle's ask has dropped $25k (14%) from the opening price — seller is motivated, your offer sets the floor, not the list.
- Current owner paid $50k; list at $155k implies a 210% gain — meaningful room to come down on a strong offer.
Risks & watch-outs
- Watch-outs: built in 1924 — expect roof / HVAC / electrical / plumbing capex.
Questions for the listing agent
- What do current leases actually rent for vs. the listed asking? Can we see a recent rent roll and the last 12 months of T-12 income?
- It's been on market 277 days. Have you received any prior offers? Is the seller open to a 20% concession, seller financing, or rate buy-down credit?
- Built in 1924 — when were the roof, HVAC, electrical panel, plumbing, and water heater last replaced?
- Why hasn't it sold? Are there any deal-killer items the seller is aware of (foundation, flood, title, zoning, code violations)?
- Is there a deadline driving the sale (1031 exchange, divorce, estate, relocation)? That informs how much negotiation room exists.
- Schools are F-rated, which usually means shorter tenancies and higher turnover. Who's the typical renter profile here, and what's been the actual vacancy rate?
- Crime grade is D in this area — have there been break-ins, vandalism, or insurance claims at this property in the last 3 years? What carrier currently insures it and at what premium?
- The area grade is low — what's the realistic commute time and amenity access for the typical tenant pool here? Any planned neighborhood developments (good or bad) we should know about?
- What's the average days-on-market for RENTAL listings here right now (not sales)? A rising rental-DOM trend means longer vacancies and softer asking-rent achievability than the comps imply.
- What's the recent tenant-quality profile in this submarket — average credit score on applications, eviction rate, late-payment / NSF rate, and stable-employment percentage? A property-management company in the area should have these aggregated.
- How much new for-sale + rental construction is in the pipeline within 1–3 miles? Heavy new supply typically softens prices + rents 12–24 months out; constrained supply supports both.
Investment metrics
- 1% rule
- 0.80% ✗
- Cap rate
- 6.20%
- Cash-on-cash
- -0.34%
- DSCR
- 0.98
- GRM
- 10.4
CMA / ARV
No comps found within radius.
Projected returns pro-forma
3.0% appreciation · 3.0% rent growth · sell at horizon
- IRR
- 7.2%
- Equity multiple
- 1.41×
- Total profit
- $17,852
- Equity at exit
- $69,695
- IRR
- 9.9%
- Equity multiple
- 2.49×
- Total profit
- $64,643
- Equity at exit
- $107,408
Cash invested: $43,400 (down + closing). Projections, not guarantees.
Landlord ↔ Tenant lean methodology
- Overall (STATE)
- 46 Balanced
- State Minnesota
- 46 Balanced · D+2
- County
- — inherits STATE
- City
- — inherits STATE
ZIP-level market 56029
- Active inventory
- 3
- Price-to-rent
- 10.4×
Monthly cashflow live
- Estimated rent
- $1,241 medium interval (Pro) →
- Mortgage (P&I)
- −$813
- Tax from tax record
- −$115 /mo · $1,382/yr
- Insurance
- −$65
- HOA
- −$0
- Vacancy / Maint / Mgmt
- −$261
- Net cashflow
- $-12
Break-even live
Sensitivity live
| Price | -10% $75 | -5% $31 | +0% $-12 | +5% $-56 | +10% $-100 |
|---|---|---|---|---|---|
| Rent | -10% $-110 | -5% $-61 | +0% $-12 | +5% $37 | +10% $86 |
| Rate | -1.0pp $66 | -0.5pp $27 | base $-12 | +0.5pp $-53 | +1.0pp $-93 |
UW: 25.0% down · 7.5% · 30yr · 1.5% tax · 5.0% vac · 8.0% maint · 8.0% mgmt
Financing live
Cash to close
- Down payment
- $38,750
- Closing costs
- $4,650
- Reserves months
- —
- Total cash needed
- —
Loan-product check · same deal, 3 products live
Conventional
25% down · 7.5% · 30yr
- Down + closing
- —
- Monthly P&I
- —
- Monthly cashflow
- —
- DSCR
- —
- Eligible?
- —
Personal DTI + credit; lowest rate.
DSCR
20% down · 8.5% · 30yr
- Down + closing
- —
- Monthly P&I
- —
- Monthly cashflow
- —
- DSCR
- —
- Eligible?
- —
No personal income docs; deal must DSCR.
Hard money
10% down · 12.0% · 12mo
- Down + closing
- —
- Monthly P&I
- —
- Monthly cashflow
- —
- DSCR
- —
- Eligible?
- —
Short-term bridge; refi at stabilization.
Listing history 26 events
-
2026-05-11status Pending
-
2026-05-01historical Contingent - Inspection
-
2026-03-03status Active
-
2026-03-03price $155,000
-
2026-02-23historical Contingent - Inspection
-
2025-12-19price $165,000
-
2025-10-02price $170,000
-
2025-08-07$180,000 Active
-
2018-12-10historical
-
2018-12-10historical
-
2018-12-10historical
-
2018-12-10historical
-
2015-04-14$65,000
-
2014-08-29historical
-
2014-02-28$70,000 Active
-
2014-02-28$70,000
-
2012-07-16$70,000
-
2012-07-16$70,000
-
2011-04-19$89,000
-
2011-04-19$89,000
-
2008-09-17soldstatus $50,000
-
2008-09-17soldstatus $50,000
-
2008-09-15soldstatus $50,000
-
2008-08-12historical
-
2008-07-24$59,900
-
2008-07-23$59,900
ⓘ Source: listings_history table (triggers on properties + properties_extension) + one-shot
backfill from property_details.listing_events for pre-trigger history.
Tax reassessment forecast MN · Partial reset (capped growth)
- Current annual tax
- $1,382 · $115/mo
- Projected year-2 tax
- $1,559 · $130/mo
- Expected delta
- +$177/yr (+$15/mo · 12.8%)
ⓘ Screening estimate from a state-policy table — verify with the county assessor before closing.
Climate risk First Street
- Flood 1/10 Low FEMA zone X (unshaded) · 0% chance over 30 yrs
- Wildfire 2/10 Low
- Heat 2/10 Low 7 d/yr ≥98°F today · 16 d/yr by 30 yrs out
- Wind 2/10 Low
- Air quality 1/10 Low 0 unhealthy d/yr today · 0 by 30 yrs out
Nearby sold comps map
Loading sold comps map…
Walkable amenities ~0.75 mi
Loading nearby amenities…
Taxation est. · year 1
- Rental income
- $14,889
- − Mortgage interest
- −$8,682
- − Property taxes
- −$1,382
- − Insurance
- −$775
- − Repairs & maintenance
- −$1,191
- − Management
- −$1,191
- − Depreciation
- −$4,509
- Taxable loss
- −$2,842
- Est. tax savings @ 24.0%
- +$682
- After-tax cash flow
- $533/yr
For passive investors: Depreciation is non-cash, so a rental often shows a tax loss while cash-flowing — sheltering income. Rental losses are passive: they offset passive income freely, and up to $25,000/yr can offset ordinary (W-2) income if you actively participate and your MAGI is under $100k (phasing out to $0 by $150k); unused losses carry forward. On sale, claimed depreciation is recaptured at up to 25%, and gains may owe capital-gains tax (a 1031 exchange can defer both). Figures are a year-1 estimate at your 24.0% rate — not tax advice; consult a CPA.
Schools (NCES district)
- District
- Glenville-Emmons School District
- NCES district ID
- 2700148
- Math proficiency
- 50% ▲ 20.00%
- Reading proficiency
- 45% ▲ 15.00%
- Median HH income
- $49,815
- Composite
- 42.83/100
- National rank
- #6740
- State rank
- #305 of 467 in MN
Livability — Emmons
- Score
- 67/100
- State rank
- #432
- US rank
- #10255
Category grades
Schools grade is shown separately in the Schools card above.
Census & demographics
- Census place
- Emmons, MN
- Population (ZIP)
- 583
Population outlook (Freeborn County) Hauer SSP2
- Today (2025)
- 29,680 people
- By 2030
- 29,038 · -2.2%
- By 2040
- 27,650 · -6.8%
- By 2050
- 26,387 · -11.1%
- By 2075
- 25,224 · -15.0%
- By 2100
- 23,842 · -19.7%
Race, ethnicity, and origin ACS 2023
- Neighborhood character
- Predominantly White (89%)
- Race & ethnicity
- White 89% Two or more races 8% Hispanic / Latino 7%
- Hispanic origin (detail)
- Mexican 5% Puerto Rican 1%
- Common ancestry
- Portuguese 43% Scottish 2% Iranian 2%
- Foreign-born
- 1% · Canada
- Languages at home
- 97% English-only · Spanish 3%
Political lean MEDSL · Freeborn
- 2024 margin
- Strong R (+21.3) · D 38.7% · R 60.0% · Other 1.3%
- 2008→2024 swing
- -38.5pp toward R · 2008: 17.1pp · 2024: -21.3pp
- All cycles
- 2024: R+21.3 2020: R+16.0 2016: R+17.4 2012: D+14.2 2008: D+17.1
Not yet ingested
- Civics
- —
Market trends
- HPI YoY
- —
- Current HPI
- —
- Rent YoY
- —
- Metro
- —
- State GDP YoY
- ▲ 2.41%
- F500 in state
- 34
Industry mix (Fortune 500 HQ in MN)
| Industry | F500 HQs | Revenue |
|---|---|---|
| Healthcare | 2 | $407B |
|
||
| Retail | 2 | $150B |
|
||
| Consumer Goods | 2 | $32B |
|
||
| Industrial Machinery | 2 | $6B |
|
||
| Agriculture | 1 | $40B |
|
||
| Healthcare / Medical Devices | 1 | $32B |
|
||
Price history
+158.8% since first listed26 events — show timeline
- 2026-05-11 Pending — NORTHSTARMLS as Distributed by MLS Grid
- 2026-05-01 Contingent — NORTHSTARMLS as Distributed by MLS Grid
- 2026-03-03 Relisted — NORTHSTARMLS as Distributed by MLS Grid
- 2026-03-03 Price Changed $155,000 NORTHSTARMLS as Distributed by MLS Grid
- 2026-02-23 Contingent — NORTHSTARMLS as Distributed by MLS Grid
- 2025-12-19 Price Changed $165,000 NORTHSTARMLS as Distributed by MLS Grid
- 2025-10-02 Price Changed $170,000 NORTHSTARMLS as Distributed by MLS Grid
- 2025-08-07 Listed $180,000 NORTHSTARMLS as Distributed by MLS Grid
- 2018-12-10 Listing Removed — NORTHSTARMLS as Distributed by MLS Grid
- 2018-12-10 Listing Removed — NORTHSTARMLS as Distributed by MLS Grid
- 2018-12-10 Listing Removed — NORTHSTARMLS as Distributed by MLS Grid
- 2018-12-10 Listing Removed — NORTHSTARMLS as Distributed by MLS Grid
- 2015-04-14 Listed $65,000 NORTHSTARMLS as Distributed by MLS Grid
- 2014-08-29 Listing Removed — NORTHSTARMLS as Distributed by MLS Grid
- 2014-02-28 Listed $70,000 NORTHSTARMLS as Distributed by MLS Grid
- 2014-02-28 Listed $70,000 NORTHSTARMLS as Distributed by MLS Grid
- 2012-07-16 Listed $70,000 NORTHSTARMLS as Distributed by MLS Grid
- 2012-07-16 Listed $70,000 NORTHSTARMLS as Distributed by MLS Grid
- 2011-04-19 Listed $89,000 NORTHSTARMLS as Distributed by MLS Grid
- 2011-04-19 Listed $89,000 NORTHSTARMLS as Distributed by MLS Grid
- 2008-09-17 Sold (MLS) $50,000 NORTHSTARMLS as Distributed by MLS Grid
- 2008-09-17 Sold (MLS) $50,000 NORTHSTARMLS as Distributed by MLS Grid
- 2008-09-15 Sold (Public Records) $50,000 Public Records
- 2008-08-12 Listing Removed — NORTHSTARMLS as Distributed by MLS Grid
- 2008-07-24 Listed $59,900 NORTHSTARMLS as Distributed by MLS Grid
- 2008-07-23 Listed $59,900 NORTHSTARMLS as Distributed by MLS Grid
Property tax history
+5.0%/yrLatest (2025): $1,382 · -26.6% YoY. Source: county tax records.
Cash-flow waterfall
monthlySold comps — $/sqft
last 12 mo · ≤1 miLoading sold comps…