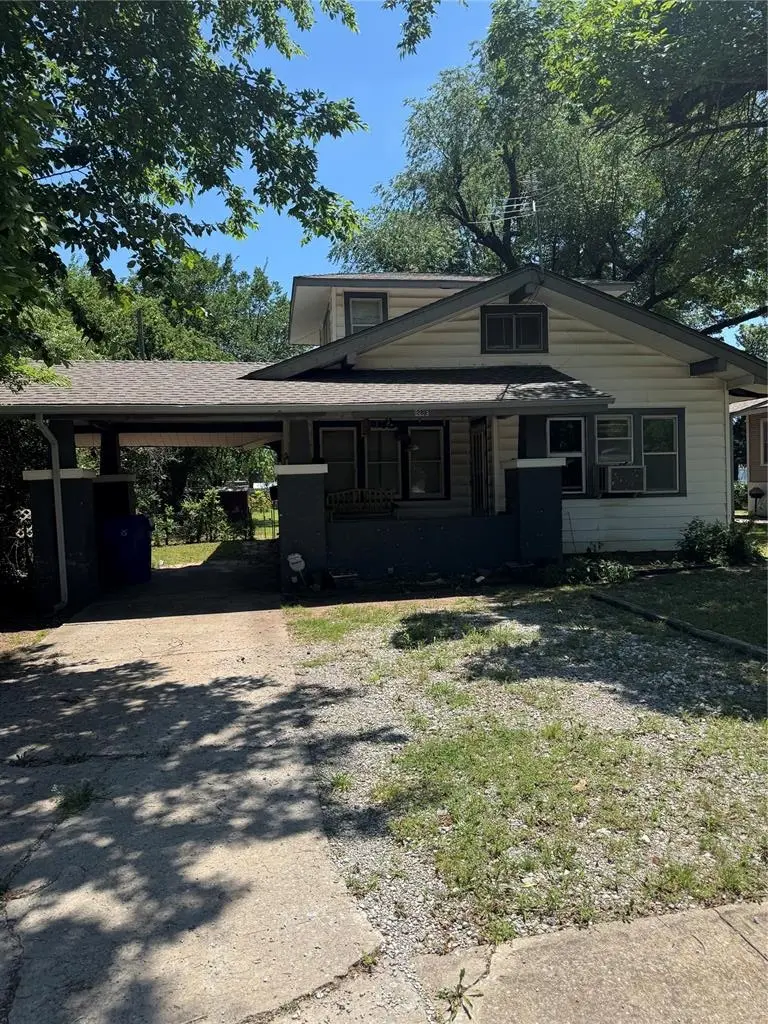
128 E Johnson St · Norman, OK
Flood risk 1/10 · Minimal
- FEMA flood zone
- X (unshaded)
- Chance of flooding over 30 yrs
- 0.0%
- Est. flood insurance / yr
- $507 – $1,088
Fire risk 1/10 · Minimal
- Est. fire insurance / yr
- $2,463 – $4,575
Heat risk 6/10 · Moderate
- Hot days now (above 108°F)
- 7 days/yr
- Hot days in 30 yrs
- 19 days/yr
Wind risk 2/10 · Minimal
- Chance of severe wind over 30 yrs
- 4.0%
Air-quality risk 2/10 · Minimal
- Unhealthy air days now
- 1 days/yr
- Unhealthy air days in 30 yrs
- 1 days/yr
Risk factors via First Street. Map © Google.
Why this score? — see what drove the B grade
The composite is a weighted blend of 9 inputs, each scored 0–100. Each bar is that input's sub-score; the figure is the points it added to the 100-point composite (weight × sub-score).
- Cash flow +28.8/30.0
- ARV discount +15.0/15.0
- DSCR +10.0/10.0
- 1% rule +7.3/10.0
- Rent growth +4.4/5.0
- Livability +4.2/5.0
- Schools +2.6/10.0
- Condition / age +2.5/5.0
- Appreciation +0.0/10.0
$105,000
🖨 Deal sheet (PDF) 📄 Offer letter ✓ Due diligence
Listing remarks MLS
Great original homeplace, lots of charm, home to be sold as is,
Key facts
- 6,098 sq ft lot
- Garage
- Built 1930
Tags
Property features AI
Finance
- Other: Located in Highland Norman addition; Homestead not claimed; Not historically designated
- Financial info: Sold as-is; Not assumable
- HOA & community: No mandatory association dues
Exterior
- Parking: 1-car garage
- Home design: One-and-a-half level residential single-family home; Existing property
- Construction: Frame construction; Shingle roof; Conventional foundation; Built prior to or by assessor records
- Exterior features: Covered porch; Interior lot
Interior
- Bedrooms: 3 bedrooms
- Bathrooms: 1 full bathroom
- Interior features: One living area; No fireplace
Neighborhood map
What this means for you Summary
Snapshot
- This is a 3-bed/1.0-bath single-family listed at $105k.
Deal economics
- At list price, monthly cash flow is $352 ($4k/yr) — positive.
- The deal already cash-flows at list — no discount required.
- Meets the 1% rule at list price ($1k rent vs $105k).
- Cap rate 10.3% vs local median 3.6% in Norman — top-decile yield for the area; either an underpriced asset or a hidden risk that comps aren't pricing in. Stress-test before assuming the spread holds.
Location & tenants
- Location reads 85/100 on livability (#1 in OK, #557 nationally) — a professional / high-income tenant draw. Strengths: amenities A+, commute A+, cost of living A+.
- Norman (suburban): math 27% / reading 32% proficiency, ranked #61 of 270 in OK (top 23%) — low school quality limits family demand, transient renter base, plan for 1-2y turnover.
- Zoned schools: Wilson Es (math 32% / reading 37%, grade F, #168 of 845 statewide, top 24%, 285 students, 0% FRL); Norman North Hs (math 45% / reading 57%, grade D+, #2 of 447 statewide, top 0%, 2,401 students, 0% FRL) — zoned schools average 0% FRL vs 39% district-wide (39 pts lower); this property's tenant base skews higher-income than the district average.
- Zoned-school proficiency averages 43% at this address vs 30% district-wide (+13 pts) — the actual schools serving this property are materially stronger than the Norman average implies; a family-tenant draw the district grade alone would hide.
- Market conditions: Rents rising fast (+7.7%/yr); 253 active listings in the ZIP; 22 comparable units currently listed for rent nearby; rentals at typical pace (median 15d on market — plan ~3-4 weeks tenant-placement turnaround); 592 units permitted in Cleveland County in 2024 (12 in 5+ unit buildings).
Forward outlook
- Local home prices are declining (-3.0%/yr); year-one equity from $726 of loan paydown is wiped out by about $3k of value loss. Plan a longer hold.
- Cleveland County population projected at +40% by 2050 — long-run rental-demand tailwind backs the buy-and-hold thesis.
- At projected returns (-3.0% appreciation + 7.7% rent growth), your $29k cash investment doubles in ~7 years — after that, you're playing with house money.
Negotiation context
- Only 4 days on market — expect competitive offers; lowballing is unlikely to land.
- 2 sale attempts since 11y ago with the ask held roughly flat each time — persistent listings suggest the price (not the market) is what's stuck; bring a comps-based counter.
- Current owner paid $52k; list at $105k implies a 102% gain — meaningful room to come down on a strong offer.
Risks & watch-outs
- Watch-outs: built in 1930 — expect roof / HVAC / electrical / plumbing capex.
- Climate carrying-cost: extreme-heat days projected 7→19/yr by 2055 (HVAC capex compounding) — expect insurance premiums to compound above CPI over the hold.
Questions for the listing agent
- Built in 1930 — when were the roof, HVAC, electrical panel, plumbing, and water heater last replaced?
- Is there a deadline driving the sale (1031 exchange, divorce, estate, relocation)? That informs how much negotiation room exists.
- What's the average days-on-market for RENTAL listings here right now (not sales)? A rising rental-DOM trend means longer vacancies and softer asking-rent achievability than the comps imply.
- What's the recent tenant-quality profile in this submarket — average credit score on applications, eviction rate, late-payment / NSF rate, and stable-employment percentage? A property-management company in the area should have these aggregated.
- How much new for-sale + rental construction is in the pipeline within 1–3 miles? Heavy new supply typically softens prices + rents 12–24 months out; constrained supply supports both.
Investment metrics
- 1% rule
- 1.23% ✓
- Cap rate
- 10.32%
- Cash-on-cash
- 14.38%
- DSCR
- 1.64
- GRM
- 6.8
CMA / ARV
- ARV (on-the-fly)
- $163,710
- Comps found
- 12
Show comp detail 12 sales within ~0.75 mi
| Address | Dist | Beds/Ba | Sqft | Sold | Price | $/sf | Match |
|---|---|---|---|---|---|---|---|
| 223 W Mosier St | 0.26mi | 2/1.0 (-1) | 947 (-2%) | 1mo | $118,000 | $125 | 79 |
| 324 Mimosa Dr | 0.51mi | 3/1.0 | 940 (-2%) | 1mo | $160,000 | $170 | 71 |
| 109 E Hayes St | 0.22mi | 3/1.0 | 1,091 (+13%) | 1mo | $162,000 | $148 | 67 |
| 415 E Frank St | 0.29mi | 3/1.0 | 1,088 (+13%) | 1mo | $180,500 | $166 | 64 |
| 808 N Cockrel Ave | 0.59mi | 3/1.0 | 1,015 (+5%) | 2mo | $153,000 | $151 | 62 |
| 208 Mimosa Dr | 0.52mi | 2/1.0 (-1) | 923 (-4%) | 2mo | $185,000 | $200 | 62 |
| 819 E Mosier St | 0.71mi | 3/1.0 | 884 (-8%) | 1mo | $150,000 | $170 | 52 |
| 425 E Eufaula St | 0.71mi | 2/1.0 (-1) | 910 (-6%) | 1mo | $95,000 | $104 | 52 |
| 700 Iowa St | 0.67mi | 2/2.0 (-1) | 1,008 (+5%) | 0mo | $210,000 | $208 | 52 |
| 617 E Comanche St | 0.70mi | 2/1.0 (-1) | 894 (-7%) | 3mo | $157,000 | $176 | 48 |
| 715 W Hughbert St | 0.59mi | 3/1.5 | 1,103 (+14%) | 3mo | $172,500 | $156 | 44 |
| 1325 Regent St | 0.72mi | 2/1.0 (-1) | 836 (-13%) | 2mo | $158,500 | $190 | 38 |
Match score weights: distance 35% · size 25% · config 20% · recency 20%. Top-matched comps best support the ARV.
Projected returns pro-forma
-3.0% appreciation · 7.66% rent growth · sell at horizon
- IRR
- 9.6%
- Equity multiple
- 1.40×
- Total profit
- $11,750
- Equity at exit
- $15,656
- IRR
- 22.2%
- Equity multiple
- 3.30×
- Total profit
- $67,708
- Equity at exit
- $9,078
Cash invested: $29,400 (down + closing). Projections, not guarantees.
Landlord ↔ Tenant lean methodology
- Overall (STATE)
- 83 Strongly Landlord-Friendly
- State Oklahoma
- 83 Strongly Landlord-Friendly · R+20
- County
- — inherits STATE
- City
- — inherits STATE
ZIP-level market 73069
- Rents YoY
- 7.7%
- Active inventory
- 253
- Price-to-rent
- 6.8×
Monthly cashflow live
- Estimated rent
- $1,291 high interval (Pro) →
- Mortgage (P&I)
- −$551
- Tax from tax record
- −$73 /mo · $880/yr
- Insurance
- −$44
- HOA
- −$0
- Vacancy / Maint / Mgmt
- −$271
- Net cashflow
- $352
Break-even live
Sensitivity live
| Price | -10% $412 | -5% $382 | +0% $352 | +5% $323 | +10% $293 |
|---|---|---|---|---|---|
| Rent | -10% $250 | -5% $301 | +0% $352 | +5% $403 | +10% $454 |
| Rate | -1.0pp $405 | -0.5pp $379 | base $352 | +0.5pp $325 | +1.0pp $297 |
UW: 25.0% down · 7.5% · 30yr · 1.5% tax · 5.0% vac · 8.0% maint · 8.0% mgmt
Financing live
Cash to close
- Down payment
- $26,250
- Closing costs
- $3,150
- Reserves months
- —
- Total cash needed
- —
Loan-product check · same deal, 3 products live
Conventional
25% down · 7.5% · 30yr
- Down + closing
- —
- Monthly P&I
- —
- Monthly cashflow
- —
- DSCR
- —
- Eligible?
- —
Personal DTI + credit; lowest rate.
DSCR
20% down · 8.5% · 30yr
- Down + closing
- —
- Monthly P&I
- —
- Monthly cashflow
- —
- DSCR
- —
- Eligible?
- —
No personal income docs; deal must DSCR.
Hard money
10% down · 12.0% · 12mo
- Down + closing
- —
- Monthly P&I
- —
- Monthly cashflow
- —
- DSCR
- —
- Eligible?
- —
Short-term bridge; refi at stabilization.
Rent comps 22 comps
| Address | Beds | Baths | Sqft | Rent | $/sqft | DOM | Units | Dist |
|---|---|---|---|---|---|---|---|---|
| 303 E Himes St Unit 2 Norman, OK | 2.0 | 1.0 | 671 | $1,045 | $1.56 | 24d | 1 | 0.18mi |
| 110 E Dale St Norman, OK | 2.0 | 1.0 | 792 | $950 | $1.20 | 12d | 1 | 0.29mi |
| 203 W Dale St Norman, OK | 3.0 | 2.0 | 997 | $1,395 | $1.40 | 24d | 1 | 0.37mi |
| 602 Tiffin Ave Norman, OK | 2.0 | 1.0 | 720 | $1,249 | $1.73 | 11d | 1 | 0.65mi |
| 820 Iowa St Norman, OK | 2.0 | 1.0 | 752 | $1,350 | $1.80 | 24d | 1 | 0.74mi |
| 316 Falcon Ct Unit 2 Norman, OK | 2.0 | 1.0 | 975 | $875 | $0.90 | 24d | 1 | 0.75mi |
| 1104 W Robinson St Norman, OK | 3.0 | 1.0 | 995 | $1,250 | $1.26 | 12d | 1 | 0.75mi |
| 800 Lexington St Norman, OK | 3.0 | 2.0 | 1056 | $1,259 | $1.19 | 2d | 1 | 0.82mi |
| 222 S University Blvd Norman, OK | 2.0 | 2.0 | 775 | $2,875 | $3.71 | 15d | 1 | 0.83mi |
| 222 S University Blvd Unit 2 Norman, OK | 2.0 | 2.0 | 685 | $2,055 | $3.00 | 15d | 1 | 0.83mi |
| 911 Nebraska St Norman, OK | 2.0 | 1.0 | 750 | $1,095 | $1.46 | 15d | 1 | 0.83mi |
| 213 Skylark Ct Norman, OK | 2.0 | 1.5 | 1000 | $1,050 | $1.05 | 21d | 1 | 0.87mi |
| 211 Skylark Ct #213 Norman, OK | 2.0 | 1.5 | 1050 | $1,050 | $1.00 | 21d | 1 | 0.87mi |
| 1238 Iowa St Norman, OK | 2.0 | 1.0 | 720 | $1,150 | $1.60 | 24d | 1 | 1.04mi |
| 1506 Dakota St Norman, OK | 3.0 | 1.0 | 832 | $1,050 | $1.26 | 4d | 1 | 1.11mi |
| 1005 W Eufaula St Norman, OK | 2.0 | 2.0 | 1100 | $1,350 | $1.23 | 4d | 1 | 1.13mi |
| 414 Ferrill St #416 Norman, OK | 2.0 | 1.0 | 800 | $875 | $1.09 | 4d | 1 | 1.15mi |
| 471 Elm Ave Norman, OK | 2.0 | 2.0 | 976 | $1,500 | $1.54 | 24d | 1 | 1.15mi |
| 930 Miller Ave Norman, OK | 2.0 | 2.0 | 1050 | $1,545 | $1.47 | 4d | 1 | 1.16mi |
| 241 Emelyn St Norman, OK | 3.0 | 2.0 | 910 | $1,500 | $1.65 | 4d | 1 | 1.18mi |
| 1713 Iowa St Norman, OK | 3.0 | 1.5 | 1030 | $1,400 | $1.36 | 12d | 1 | 1.30mi |
| 1505 Huntington Way Norman, OK | 3.0 | 1.0 | 1035 | $1,300 | $1.26 | 15d | 1 | 1.43mi |
Listing history 4 events
-
2026-06-07statusdays on market $105,000 Pending 4 DOM
-
2026-06-05days on market $105,000 Active 2 DOM
-
2026-06-03remarks 281-char remark
-
2026-06-03$105,000 Active 1 DOM
ⓘ Source: listings_history table (triggers on properties + properties_extension) + one-shot
backfill from property_details.listing_events for pre-trigger history.
Tax reassessment forecast OK · Resets to sale price
- Current annual tax
- $880 · $73/mo
- Projected year-2 tax
- $945 · $79/mo
- Expected delta
- +$65/yr (+$5/mo · 7.4%)
ⓘ Screening estimate from a state-policy table — verify with the county assessor before closing.
Climate risk First Street
- Flood 1/10 Low FEMA zone X (unshaded) · 0% chance over 30 yrs
- Wildfire 1/10 Low
- Heat 6/10 Major 7 d/yr ≥108°F today · 19 d/yr by 30 yrs out
- Wind 2/10 Low 4% chance of damaging wind over 30 yrs
- Air quality 2/10 Low 1 unhealthy d/yr today · 1 by 30 yrs out
Nearby sold comps map
Loading sold comps map…
Walkable amenities ~0.75 mi
Loading nearby amenities…
Taxation est. · year 1
- Rental income
- $15,495
- − Mortgage interest
- −$5,882
- − Property taxes
- −$880
- − Insurance
- −$525
- − Repairs & maintenance
- −$1,240
- − Management
- −$1,240
- − Depreciation
- −$3,055
- Taxable income
- $2,675
- Est. tax owed @ 24.0%
- −$642
- After-tax cash flow
- $3,586/yr
For passive investors: Depreciation is non-cash, so a rental often shows a tax loss while cash-flowing — sheltering income. Rental losses are passive: they offset passive income freely, and up to $25,000/yr can offset ordinary (W-2) income if you actively participate and your MAGI is under $100k (phasing out to $0 by $150k); unused losses carry forward. On sale, claimed depreciation is recaptured at up to 25%, and gains may owe capital-gains tax (a 1031 exchange can defer both). Figures are a year-1 estimate at your 24.0% rate — not tax advice; consult a CPA.
Schools (NCES district)
- District
- Norman
- NCES district ID
- 4021720
- Math proficiency
- 27% ▼ -9.00%
- Reading proficiency
- 32% ▼ -8.00%
- Median HH income
- $48,940
- Composite
- 25.67/100
- National rank
- #7395
- State rank
- #61 of 270 in OK
Livability — Norman
- Score
- 85/100
- State rank
- #1
- US rank
- #557
Category grades
Schools grade is shown separately in the Schools card above.
Census & demographics
- Census place
- Norman, OK
- County
- Cleveland County · 239,547 people
- City population
- 123,141
- Metro
- Oklahoma City, OK
- Population (ZIP)
- 28,462
- Household income
- $58,888
- Rent vs Own
- Severe rent burden
- 1704.0
Population outlook (Cleveland County) Hauer SSP2
- Today (2025)
- 323,621 people
- By 2030
- 349,070 · +7.9%
- By 2040
- 400,168 · +23.7%
- By 2050
- 454,101 · +40.3%
- By 2075
- 602,926 · +86.3%
- By 2100
- 734,485 · +127.0%
Race, ethnicity, and origin ACS 2023
- Neighborhood character
- Diverse neighborhood (Simpson 0.56)
- Race & ethnicity
- White 64% Two or more races 15% Hispanic / Latino 14% Native American 4% Black 4% Asian 3% Pacific Islander 1%
- Hispanic origin (detail)
- Mexican 9%
- Common ancestry
- Lithuanian 3% Italian 3% Slovak 2%
- Foreign-born
- 9% · Canada, China
- Languages at home
- 84% English-only · Spanish 10% Other Indo-European 1% Chinese 1%
Political lean MEDSL · Cleveland
- 2024 margin
- R (+14.9) · D 41.4% · R 56.4% · Other 2.2%
- 2008→2024 swing
- +9.1pp toward D · 2008: -24.0pp · 2024: -14.9pp
- All cycles
- 2024: R+14.9 2020: R+14.1 2016: R+21.7 2012: R+25.9 2008: R+24.0
Not yet ingested
- Civics
- —
Market trends
- HPI YoY
- ▼ -252.79%
- Current HPI
- 272.4754
- Rent YoY
- ▲ 7.66%
- Metro
- Oklahoma City, OK
- State GDP YoY
- ▲ 1.55%
- F500 in state
- 6
Industry mix (Fortune 500 HQ in OK)
| Industry | F500 HQs | Revenue |
|---|---|---|
| Energy | 3 | $48B |
|
||
Price history
+27.3% since first listed7 events — show timeline
- 2026-06-02 Listed $105,000 MLSOK
- 2015-11-23 Sold (Public Records) $52,000 Public Records
- 2015-11-19 Sold (MLS) $62,000 MLSOK
- 2015-10-07 Pending — MLSOK
- 2015-09-15 Price Changed $64,500 MLSOK
- 2015-08-09 Price Changed $69,500 MLSOK
- 2015-07-14 Listed $82,500 MLSOK
Property tax history
+5.1%/yrLatest (2024): $880 · +4.8% YoY. Source: county tax records.
Cash-flow waterfall
monthlySold comps — $/sqft
last 12 mo · ≤1 miLoading sold comps…