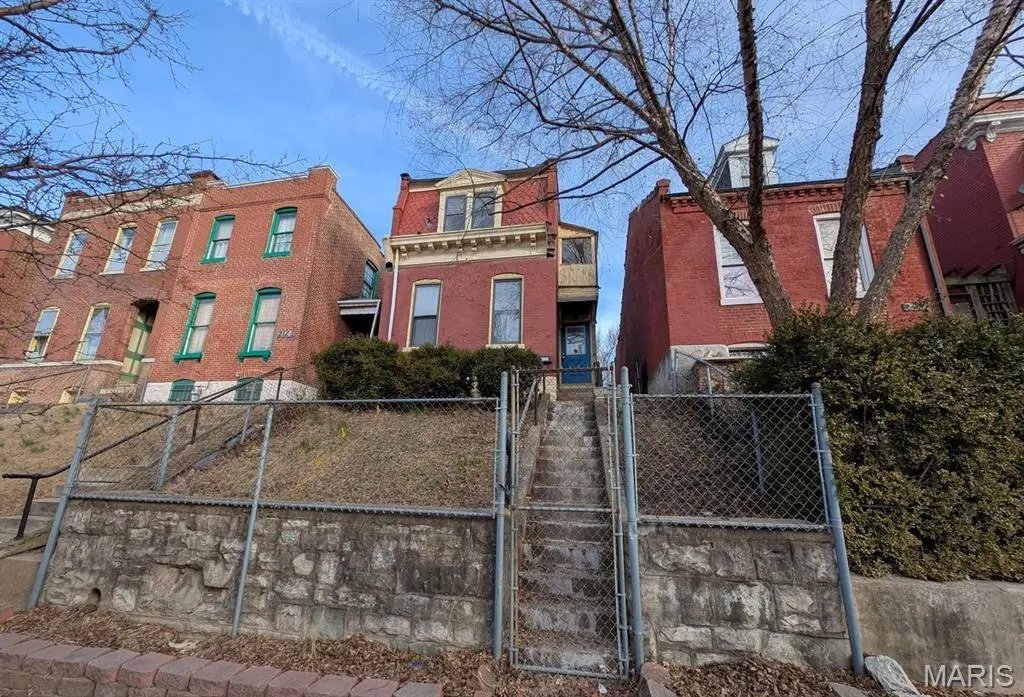
2121 Chippewa St · St. Louis, MO
Flood risk 1/10 · Minimal
- FEMA flood zone
- X (unshaded)
- Chance of flooding over 30 yrs
- 0.0%
- Est. flood insurance / yr
- $473 – $860
Fire risk 1/10 · Minimal
- Est. fire insurance / yr
- $1,054 – $1,958
Heat risk 5/10 · Moderate
- Hot days now (above 109°F)
- 7 days/yr
- Hot days in 30 yrs
- 21 days/yr
Wind risk 2/10 · Minimal
- Chance of severe wind over 30 yrs
- 1.0%
Air-quality risk 3/10 · Minor
- Unhealthy air days now
- 3 days/yr
- Unhealthy air days in 30 yrs
- 4 days/yr
Risk factors via First Street. Map © Google.
Why this score? — see what drove the D grade
The composite is a weighted blend of 9 inputs, each scored 0–100. Each bar is that input's sub-score; the figure is the points it added to the 100-point composite (weight × sub-score).
- Cash flow +15.0/30.0
- ARV discount +7.5/15.0
- 1% rule +5.0/10.0
- DSCR +5.0/10.0
- Rent growth +3.7/5.0
- Livability +2.5/5.0
- Condition / age +2.5/5.0
- Schools +1.2/10.0
- Appreciation +0.0/10.0
$22,900
🖨 Deal sheet 📄 Offer letter ✓ Due diligence
Listing remarks MLS
Outstanding renovation potential! Located at 2121 Chippewa in St. Louis, this 2-bedroom, 1 and a half-bathroom home offers a great opportunity for investors or buyers looking to restore and customize a classic city property. The front entry opens into a small foyer that leads to the living room, dining room, kitchen, and a convenient half bathroom on the main floor. Upstairs, you’ll find two bedrooms and a full bathroom, providing a functional layout ready for your vision and updates. Situated along the Chippewa corridor in South St. Louis, this property is surrounded by historic brick homes, established neighborhoods, and convenient city amenities. The area offers easy access to local restaurants, shops, and everyday conveniences, as well as nearby parks, walking trails, and community spaces. With close proximity to major roadways, downtown St. Louis, and popular entertainment districts, this location provides strong appeal for homeowners and investors alike. Bring your ideas and transform this property into a great investment or future residence! ALL information is deemed reliable but is not guaranteed and should be verified by the buyer and/or buyers agent before making an offer.
Key facts
- Historic brick homes
- Local restaurants
- Renovation potential
Tags
Neighborhood map
What this means for you Summary
Snapshot
- This is a 2-bed/1.0-bath single-family listed at $23k.
Deal economics
- At list price, monthly cash flow is $731 ($9k/yr) — positive.
- The deal already cash-flows at list — no discount required.
- Meets the 1% rule at list price ($1k rent vs $23k).
- Recommended offer: $21k (9.0% below list) — sets the bar for market timing.
- Cap rate 44.6% vs local median 5.0% in St. Louis — top-decile yield for the area; either an underpriced asset or a hidden risk that comps aren't pricing in. Stress-test before assuming the spread holds.
Location & tenants
- Location reads: area grade D — affects rentability + tenant quality, not the cash-flow math above.
- St. Louis City (urban): math 10% / reading 18% proficiency, ranked #312 of 324 in MO (top 96%) — low school quality limits family demand, transient renter base, plan for 1-2y turnover; 80% free/reduced lunch — lower-income household profile, screen leases tightly.
- Market conditions: Rents rising fast (+4.9%/yr); 240 active listings in the ZIP; 40 comparable units currently listed for rent nearby; rentals at typical pace (median 24d on market — plan ~3-4 weeks tenant-placement turnaround); 42% of comp listings sitting > 30 days — soft ceiling on asking rent; 294 units permitted in St. Louis city in 2024 (227 in 5+ unit buildings).
Forward outlook
- Local home prices are declining (-3.0%/yr); year-one equity from $158 of loan paydown is wiped out by about $687 of value loss. Plan a longer hold.
- St. Louis County population projected to shrink 6% by 2050 — rents likely to lag national; underwrite the cash flow, not the appreciation.
- At projected returns (-3.0% appreciation + 4.9% rent growth), your $6k cash investment doubles in ~1 year — after that, you're playing with house money.
Negotiation context
- It's been on market 114 days — a 9% lower offer ($21k) is reasonable based on typical stale-listing flexibility.
Risks & watch-outs
- Watch-outs: built in 1886 — expect roof / HVAC / electrical / plumbing capex.
- Climate carrying-cost: extreme-heat days projected 7→21/yr by 2055 (HVAC capex compounding) — expect insurance premiums to compound above CPI over the hold.
Questions for the listing agent
- It's been on market 114 days. Have you received any prior offers? Is the seller open to a 9% concession, seller financing, or rate buy-down credit?
- Built in 1886 — when were the roof, HVAC, electrical panel, plumbing, and water heater last replaced?
- Why hasn't it sold? Are there any deal-killer items the seller is aware of (foundation, flood, title, zoning, code violations)?
- Is there a deadline driving the sale (1031 exchange, divorce, estate, relocation)? That informs how much negotiation room exists.
- The area grade is low — what's the realistic commute time and amenity access for the typical tenant pool here? Any planned neighborhood developments (good or bad) we should know about?
- What's the average days-on-market for RENTAL listings here right now (not sales)? A rising rental-DOM trend means longer vacancies and softer asking-rent achievability than the comps imply.
- What's the recent tenant-quality profile in this submarket — average credit score on applications, eviction rate, late-payment / NSF rate, and stable-employment percentage? A property-management company in the area should have these aggregated.
- How much new for-sale + rental construction is in the pipeline within 1–3 miles? Heavy new supply typically softens prices + rents 12–24 months out; constrained supply supports both.
Investment metrics
- 1% rule
- 4.93% ✓
- Cap rate
- 44.57%
- Cash-on-cash
- 136.72%
- DSCR
- 7.08
- GRM
- 1.7
CMA / ARV
- ARV (median comp)
- $129,565
- List price
- $22,900
- Delta
- -82.33%
- Verdict
- UNDERPRICED
- Comps
- 20 within 1.0 mi
Show comp detail 12 sales within ~0.75 mi
| Address | Dist | Beds/Ba | Sqft | Sold | Price | $/sf | Match |
|---|---|---|---|---|---|---|---|
| 2119 Chippewa St | 0.01mi | 2/1.0 | 1,372 (-4%) | 2mo | $160,000 | $117 | 90 |
| 3431 Indiana Ave | 0.43mi | 2/2.0 | 1,340 (-7%) | 0mo | $279,900 | $209 | 65 |
| 3434 Illinois Ave | 0.42mi | 3/2.5 (+1) | 1,438 (+0%) | 7mo | $300,000 | $209 | 64 |
| 3647 Wisconsin Ave | 0.17mi | 3/1.5 (+1) | 1,632 (+14%) | 3mo | $49,900 | $31 | 60 |
| 3523 Illinois Ave | 0.31mi | 2/2.0 | 1,636 (+14%) | 6mo | $229,900 | $141 | 53 |
| 3231 Ohio Ave | 0.73mi | 2/2.0 | 1,510 (+5%) | 1mo | $239,900 | $159 | 53 |
| 2845 Chippewa St | 0.49mi | 3/1.5 (+1) | 1,598 (+11%) | 0mo | $205,000 | $128 | 51 |
| 3615 Nebraska Ave | 0.57mi | 3/1.5 (+1) | 1,546 (+8%) | 6mo | $175,900 | $114 | 48 |
| 3428 Indiana Ave | 0.42mi | 3/2.0 (+1) | 1,642 (+14%) | 4mo | $224,900 | $137 | 44 |
| 3253 Texas Ave | 0.67mi | 3/2.5 (+1) | 1,536 (+7%) | 5mo | $160,000 | $104 | 42 |
| 3831 Oregon Ave | 0.47mi | 3/2.5 (+1) | 1,636 (+14%) | 3mo | $249,900 | $153 | 41 |
| 3030 Chippewa St | 0.63mi | 3/2.0 (+1) | 1,588 (+11%) | 6mo | $79,900 | $50 | 39 |
Match score weights: distance 35% · size 25% · config 20% · recency 20%. Top-matched comps best support the ARV.
Projected returns pro-forma
-3.0% appreciation · 4.89% rent growth · sell at horizon
- IRR
- —
- Equity multiple
- 8.02×
- Total profit
- $45,023
- Equity at exit
- $3,414
- IRR
- —
- Equity multiple
- 17.93×
- Total profit
- $108,526
- Equity at exit
- $1,980
Cash invested: $6,412 (down + closing). Projections, not guarantees.
Landlord ↔ Tenant lean methodology
- Overall (STATE)
- 81 Strongly Landlord-Friendly
- State Missouri
- 81 Strongly Landlord-Friendly · R+10
- County
- — inherits STATE
- City
- — inherits STATE
ZIP-level market 63118
- Rents YoY
- 4.9%
- Active inventory
- 240
- Price-to-rent
- 1.7×
Monthly cashflow live
- Estimated rent
- $1,129 high interval (Pro) →
- Mortgage (P&I)
- −$120
- Tax from tax record
- −$32 /mo · $384/yr
- Insurance
- −$10
- HOA
- −$0
- Vacancy / Maint / Mgmt
- −$237
- Net cashflow
- $731
Break-even live
UW: 25.0% down · 7.5% · 30yr · 1.5% tax · 5.0% vac · 8.0% maint · 8.0% mgmt
Financing live
Cash to close
- Down payment
- $5,725
- Closing costs
- $687
- Reserves months
- —
- Total cash needed
- —
Loan-product check · same deal, 3 products live
Conventional
25% down · 7.5% · 30yr
- Down + closing
- —
- Monthly P&I
- —
- Monthly cashflow
- —
- DSCR
- —
- Eligible?
- —
Personal DTI + credit; lowest rate.
DSCR
20% down · 8.5% · 30yr
- Down + closing
- —
- Monthly P&I
- —
- Monthly cashflow
- —
- DSCR
- —
- Eligible?
- —
No personal income docs; deal must DSCR.
Hard money
10% down · 12.0% · 12mo
- Down + closing
- —
- Monthly P&I
- —
- Monthly cashflow
- —
- DSCR
- —
- Eligible?
- —
Short-term bridge; refi at stabilization.
Rent comps 40 comps
| Address | Beds | Baths | Sqft | Rent | $/sqft | DOM | Units | Dist |
|---|---|---|---|---|---|---|---|---|
| 3700 S Broadway St Unit 2N St. Louis, MO | 2.0 | 1.0 | 975 | $925 | $0.95 | 23d | 1 | 0.11mi |
| 3627 Missouri Ave Unit A St. Louis, MO | 1.0 | 1.0 | 1470 | $1,195 | $0.81 | 23d | 1 | 0.18mi |
| 3739 Ohio Ave Unit A St. Louis, MO | 2.0 | 1.0 | 900 | $1,000 | $1.11 | 4d | 1 | 0.30mi |
| 3739 Ohio Ave Unit B St. Louis, MO | 1.0 | 1.0 | 897 | $900 | $1.00 | 4d | 1 | 0.30mi |
| 3450 Wisconsin Ave Saint Louis, MO | 1.0–3.0 | 1.0–2.0 | 1219 | $1,788 | $1.47 | 1d | 15 | 0.42mi |
| 2214-2216 Cherokee St Unit Cherokee 2214-2nd Floor St. Louis, MO | 1.0 | 1.0 | 1000 | $1,100 | $1.10 | 23d | 1 | 0.47mi |
| 2806 Osage St Apt 2E St. Louis, MO | 1.0 | 1.0 | 992 | $750 | $0.76 | 43d | 1 | 0.51mi |
| 3510 California Ave Saint Louis, MO | 3.0 | 2.0 | 1800 | $1,200 | $0.67 | 43d | 1 | 0.52mi |
| 3828 Nebraska Ave St. Louis, MO | 1.0 | 1.0 | 1000 | $750 | $0.75 | 23d | 1 | 0.52mi |
| 3530 Oregon Ave Unit 3532 St. Louis, MO | 2.0 | 1.0 | 1035 | $825 | $0.80 | 43d | 1 | 0.54mi |
| 3331 Salena St Unit 33332-F St. Louis, MO | 1.0 | 1.0 | 875 | $999 | $1.14 | 43d | 1 | 0.56mi |
| 3534 Nebraska Ave Saint Louis, MO | 2.0 | 1.0 | 1100 | $1,100 | $1.00 | 43d | 1 | 0.59mi |
| 3319 S 18th St Saint Louis, MO | 2.0 | 1.5 | 1368 | $1,600 | $1.17 | 43d | 1 | 0.62mi |
| 1907 Utah St Unit 2 St. Louis, MO | 1.0 | 1.0 | 1000 | $1,450 | $1.45 | 43d | 1 | 0.65mi |
| 4127 Oregon Ave Unit 2F St. Louis, MO | 2.0 | 1.0 | 1000 | $1,203 | $1.20 | 23d | 1 | 0.66mi |
| 3922 Minnesota Ave Saint Louis, MO | 2.0 | 1.0 | 1000 | $925 | $0.93 | 43d | 1 | 0.67mi |
| 3855 Minnesota Ave Unit B St. Louis, MO | 2.0 | 1.0 | 900 | $850 | $0.94 | 43d | 1 | 0.68mi |
| 2839 Cherokee St Saint Louis, MO | 1.0 | 1.0 | 900 | $1,195 | $1.33 | 43d | 1 | 0.70mi |
| 3116 Keokuk St Saint Louis, MO | 2.0 | 1.0 | 900 | $850 | $0.94 | 2d | 1 | 0.71mi |
| 3116 Keokuk St Unit 1F St. Louis, MO | 2.0 | 1.0 | 900 | $850 | $0.94 | 1d | 1 | 0.71mi |
| 2902 Cherokee St Unit 2906-2F St. Louis, MO | 1.0 | 1.0 | 918 | $1,150 | $1.25 | 43d | 1 | 0.72mi |
| 4238 California Ave St. Louis, MO | 2.0 | 1.0 | 1000 | $1,300 | $1.30 | 43d | 1 | 0.72mi |
| 3914 Michigan Ave Saint Louis, MO | 2.0 | 1.0 | 1376 | $1,150 | $0.84 | 43d | 1 | 0.73mi |
| 3131 Keokuk St #3131 Saint Louis, MO | 3.0 | 2.0 | 1500 | $1,475 | $0.98 | 14d | 1 | 0.74mi |
| 3146 Keokuk St Saint Louis, MO | 3.0 | 1.0 | 1528 | $1,500 | $0.98 | 23d | 1 | 0.77mi |
| 4126 Minnesota Ave Unit 2f St. Louis, MO | 2.0 | 1.0 | 1150 | $1,028 | $0.89 | 23d | 1 | 0.78mi |
| 3259 Oregon Ave St. Louis, MO | 2.0 | 1.0 | 1200 | $1,000 | $0.83 | 43d | 1 | 0.78mi |
| 4130 Minnesota Ave Saint Louis, MO | 2.0 | 1.0 | 1234 | $975 | $0.79 | 14d | 1 | 0.78mi |
| 3829 S Compton Ave Unit B St. Louis, MO | 2.0 | 1.0 | 1040 | $1,050 | $1.01 | 23d | 1 | 0.80mi |
| 3829 S Compton Ave Unit A St. Louis, MO | 2.0 | 1.0 | 1040 | $1,000 | $0.96 | 16d | 1 | 0.80mi |
| 4127 Minnesota Ave Unit 1F St. Louis, MO | 3.0 | 1.0 | 1155 | $1,200 | $1.04 | 43d | 1 | 0.81mi |
| 4127 Minnesota Ave Unit 2F St. Louis, MO | 3.0 | 1.0 | 1155 | $1,200 | $1.04 | 43d | 1 | 0.81mi |
| 3233 Oregon Ave Unit 2 St. Louis, MO | 2.0 | 1.0 | 1215 | $995 | $0.82 | 23d | 1 | 0.82mi |
| 3506 S Compton Ave Saint Louis, MO | 2.0 | 2.0 | 1100 | $1,300 | $1.18 | 10d | 1 | 0.84mi |
| 1917 Arsenal St Saint Louis, MO | 2.0 | 1.0 | 1239 | $1,250 | $1.01 | 19d | 1 | 0.85mi |
| 4308 Nebraska Ave Unit A St. Louis, MO | 1.0 | 1.0 | 1012 | $1,148 | $1.13 | 7d | 1 | 0.85mi |
| 4308 Nebraska Ave Unit B St. Louis, MO | 2.0 | 2.0 | 1012 | $1,148 | $1.13 | 7d | 1 | 0.85mi |
| 3636 Virginia Ave St. Louis, MO | 1.0 | 1.0 | 902 | $795 | $0.88 | 43d | 1 | 0.85mi |
| 3215 Oregon Ave Unit 1F St. Louis, MO | 2.0 | 1.0 | 1373 | $1,150 | $0.84 | 17d | 1 | 0.85mi |
| 3138 Gasconade St Unit 3138 2W St. Louis, MO | 1.0 | 1.0 | 950 | $850 | $0.89 | 17d | 1 | 0.85mi |
Listing history 16 events
-
2026-06-17status $22,900 Pending 114 DOM
-
2026-06-16days on market $22,900 Active 114 DOM
-
2026-06-15days on market $22,900 Active 113 DOM
-
2026-06-13days on market $22,900 Active 111 DOM
-
2026-06-09days on market $22,900 Active 107 DOM
-
2026-06-08days on market $22,900 Active 106 DOM
-
2026-06-08days on market $22,900 Active 105 DOM
-
2026-06-05days on market $22,900 Active 102 DOM
-
2026-06-03days on market $22,900 Active 101 DOM
-
2026-06-02days on market $22,900 Active 100 DOM
-
2026-06-01days on market $22,900 Active 99 DOM
-
2026-05-31days on market $22,900 Active 98 DOM
-
2026-04-23price $29,900 1207-char remark
Show marketing remark (1207 chars)
Outstanding renovation potential! Located at 2121 Chippewa in St. Louis, this 2-bedroom, 1 and a half-bathroom home offers a great opportunity for investors or buyers looking to restore and customize a classic city property. The front entry opens into a small foyer that leads to the living room, dining room, kitchen, and a convenient half bathroom on the main floor. Upstairs, you’ll find two bedrooms and a full bathroom, providing a functional layout ready for your vision and updates. Situated along the Chippewa corridor in South St. Louis, this property is surrounded by historic brick homes, established neighborhoods, and convenient city amenities. The area offers easy access to local restaurants, shops, and everyday conveniences, as well as nearby parks, walking trails, and community spaces. With close proximity to major roadways, downtown St. Louis, and popular entertainment districts, this location provides strong appeal for homeowners and investors alike. Bring your ideas and transform this property into a great investment or future residence! ALL information is deemed reliable but is not guaranteed and should be verified by the buyer and/or buyers agent before making an offer.
-
2026-03-23price $34,900 1207-char remark
Show marketing remark (1207 chars)
Outstanding renovation potential! Located at 2121 Chippewa in St. Louis, this 2-bedroom, 1 and a half-bathroom home offers a great opportunity for investors or buyers looking to restore and customize a classic city property. The front entry opens into a small foyer that leads to the living room, dining room, kitchen, and a convenient half bathroom on the main floor. Upstairs, you’ll find two bedrooms and a full bathroom, providing a functional layout ready for your vision and updates. Situated along the Chippewa corridor in South St. Louis, this property is surrounded by historic brick homes, established neighborhoods, and convenient city amenities. The area offers easy access to local restaurants, shops, and everyday conveniences, as well as nearby parks, walking trails, and community spaces. With close proximity to major roadways, downtown St. Louis, and popular entertainment districts, this location provides strong appeal for homeowners and investors alike. Bring your ideas and transform this property into a great investment or future residence! ALL information is deemed reliable but is not guaranteed and should be verified by the buyer and/or buyers agent before making an offer.
-
2026-02-23$39,900 Active 1207-char remark
Show marketing remark (1207 chars)
Outstanding renovation potential! Located at 2121 Chippewa in St. Louis, this 2-bedroom, 1 and a half-bathroom home offers a great opportunity for investors or buyers looking to restore and customize a classic city property. The front entry opens into a small foyer that leads to the living room, dining room, kitchen, and a convenient half bathroom on the main floor. Upstairs, you’ll find two bedrooms and a full bathroom, providing a functional layout ready for your vision and updates. Situated along the Chippewa corridor in South St. Louis, this property is surrounded by historic brick homes, established neighborhoods, and convenient city amenities. The area offers easy access to local restaurants, shops, and everyday conveniences, as well as nearby parks, walking trails, and community spaces. With close proximity to major roadways, downtown St. Louis, and popular entertainment districts, this location provides strong appeal for homeowners and investors alike. Bring your ideas and transform this property into a great investment or future residence! ALL information is deemed reliable but is not guaranteed and should be verified by the buyer and/or buyers agent before making an offer.
-
2026-02-23historical $39,900 1207-char remark
Show marketing remark (1207 chars)
Outstanding renovation potential! Located at 2121 Chippewa in St. Louis, this 2-bedroom, 1 and a half-bathroom home offers a great opportunity for investors or buyers looking to restore and customize a classic city property. The front entry opens into a small foyer that leads to the living room, dining room, kitchen, and a convenient half bathroom on the main floor. Upstairs, you’ll find two bedrooms and a full bathroom, providing a functional layout ready for your vision and updates. Situated along the Chippewa corridor in South St. Louis, this property is surrounded by historic brick homes, established neighborhoods, and convenient city amenities. The area offers easy access to local restaurants, shops, and everyday conveniences, as well as nearby parks, walking trails, and community spaces. With close proximity to major roadways, downtown St. Louis, and popular entertainment districts, this location provides strong appeal for homeowners and investors alike. Bring your ideas and transform this property into a great investment or future residence! ALL information is deemed reliable but is not guaranteed and should be verified by the buyer and/or buyers agent before making an offer.
ⓘ Source: listings_history table (triggers on properties + properties_extension) + one-shot
backfill from property_details.listing_events for pre-trigger history.
Tax reassessment forecast MO · Resets to sale price
- Current annual tax
- $384 · $32/mo
- Projected year-2 tax
- $384 · $32/mo
- Expected delta
- $0/yr ($0/mo · 0.0%)
ⓘ Screening estimate from a state-policy table — verify with the county assessor before closing.
Climate risk First Street
- Flood 1/10 Low FEMA zone X (unshaded) · 0% chance over 30 yrs
- Wildfire 1/10 Low
- Heat 5/10 Major 7 d/yr ≥109°F today · 21 d/yr by 30 yrs out
- Wind 2/10 Low 100% chance of damaging wind over 30 yrs
- Air quality 3/10 Moderate 3 unhealthy d/yr today · 4 by 30 yrs out
Nearby sold comps map
Loading sold comps map…
Walkable amenities ~0.75 mi
Loading nearby amenities…
Taxation est. · year 1
- Rental income
- $13,551
- − Mortgage interest
- −$1,283
- − Property taxes
- −$384
- − Insurance
- −$114
- − Repairs & maintenance
- −$1,084
- − Management
- −$1,084
- − Depreciation
- −$666
- Taxable income
- $8,936
- Est. tax owed @ 24.0%
- −$2,145
- After-tax cash flow
- $6,622/yr
For passive investors: Depreciation is non-cash, so a rental often shows a tax loss while cash-flowing — sheltering income. Rental losses are passive: they offset passive income freely, and up to $25,000/yr can offset ordinary (W-2) income if you actively participate and your MAGI is under $100k (phasing out to $0 by $150k); unused losses carry forward. On sale, claimed depreciation is recaptured at up to 25%, and gains may owe capital-gains tax (a 1031 exchange can defer both). Figures are a year-1 estimate at your 24.0% rate — not tax advice; consult a CPA.
Schools (NCES district)
- District
- St. Louis City
- NCES district ID
- 2929280
- Math proficiency
- 10% ▼ -6.00%
- Reading proficiency
- 18% ▼ -3.00%
- Median HH income
- $35,685
- Composite
- 11.54/100
- National rank
- #9699
- State rank
- #312 of 324 in MO
Livability — St. Louis
No livability data for this city. (Only ~50 U.S. cities are tracked.)
Census & demographics
- Census place
- St. Louis, MO
- County
- Saint Louis City · 254,015 people
- City population
- 283,259
- Metro
- St. Louis, MO-IL
- Population (ZIP)
- 25,913
- Household income
- $57,762
- Rent vs Own
- Severe rent burden
- 1495.0
Population outlook (St. Louis County) Hauer SSP2
- Today (2025)
- 315,737 people
- By 2030
- 313,865 · -0.6%
- By 2040
- 305,439 · -3.3%
- By 2050
- 296,529 · -6.1%
- By 2075
- 271,028 · -14.2%
- By 2100
- 255,359 · -19.1%
Race, ethnicity, and origin ACS 2023
- Neighborhood character
- Diverse neighborhood (Simpson 0.63)
- Race & ethnicity
- White 44% Black 41% Two or more races 8% Hispanic / Latino 8% Asian 2%
- Hispanic origin (detail)
- Mexican 6%
- Common ancestry
- Slovak 2% Lithuanian 2% Romanian 2%
- Foreign-born
- 6% · Canada, Vietnam
- Languages at home
- 90% English-only · Spanish 5% Vietnamese 1% French/Haitian/Cajun 1%
Political lean MEDSL · St. Louis
- 2024 margin
- Solid D (+64.7) · D 81.4% · R 16.7% · Other 2.0%
- 2008→2024 swing
- -3.5pp toward R · 2008: 68.2pp · 2024: 64.7pp
- All cycles
- 2024: D+64.7 2020: D+66.2 2016: D+63.7 2012: D+66.6 2008: D+68.2
Not yet ingested
- Civics
- —
Market trends
- HPI YoY
- ▼ -347.51%
- Current HPI
- 171.5963
- Rent YoY
- ▲ 4.89%
- Metro
- St. Louis, MO-IL
- State GDP YoY
- ▲ 1.84%
- F500 in state
- 20
Industry mix (Fortune 500 HQ in MO)
| Industry | F500 HQs | Revenue |
|---|---|---|
| Healthcare | 1 | $163B |
|
||
| Insurance | 1 | $21B |
|
||
| Industrial Technology | 1 | $17B |
|
||
| Retail | 1 | $16B |
|
||
| Industrial Distribution | 1 | $10B |
|
||
| Utilities | 1 | $9B |
|
||
Price history
-25.1% since first listed4 events — show timeline
- 2026-04-23 Price Changed $29,900 MARIS as Distributed by MLS Grid
- 2026-03-23 Price Changed $34,900 MARIS as Distributed by MLS Grid
- 2026-02-23 Listed $39,900 MARIS as Distributed by MLS Grid
- 2026-02-23 Coming Soon $39,900 MARIS as Distributed by MLS Grid
Property tax history
+2.5%/yrLatest (2024): $384 · +4.8% YoY. Source: county tax records.
Cash-flow waterfall
monthlySold comps — $/sqft
last 12 mo · ≤1 miLoading sold comps…