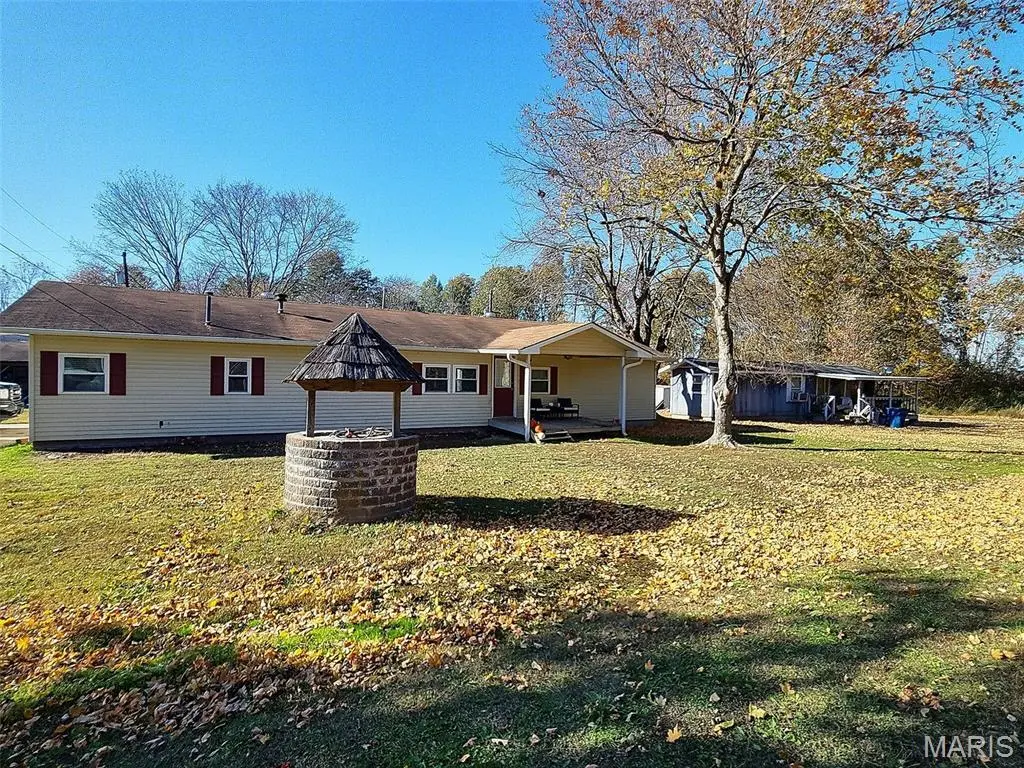
33445 Maple St · Advance, MO
Flood risk 4/10 · Minor
- FEMA flood zone
- X
- Chance of flooding over 30 yrs
- 0.24%
- Est. flood insurance / yr
- $473 – $860
Fire risk 1/10 · Minimal
- Est. fire insurance / yr
- $1,054 – $1,958
Heat risk 5/10 · Moderate
- Hot days now (above 108°F)
- 7 days/yr
- Hot days in 30 yrs
- 20 days/yr
Wind risk 3/10 · Minor
- Chance of severe wind over 30 yrs
- 5.0%
Air-quality risk 2/10 · Minimal
- Unhealthy air days now
- 0 days/yr
- Unhealthy air days in 30 yrs
- 1 days/yr
Risk factors via First Street. Map © Google.
Why this score? — see what drove the D+ grade
The composite is a weighted blend of 9 inputs, each scored 0–100. Each bar is that input's sub-score; the figure is the points it added to the 100-point composite (weight × sub-score).
- ARV discount +15.0/15.0
- Appreciation +10.0/10.0
- Cash flow +8.2/30.0
- Schools +4.1/10.0
- Livability +3.2/5.0
- Rent growth +2.5/5.0
- Condition / age +2.5/5.0
- DSCR +2.2/10.0
- 1% rule +1.3/10.0
$145,000
🖨 Deal sheet 📄 Offer letter ✓ Due diligence
Listing remarks MLS
Beautifully Updated 4-Bedroom Home in Parkview Acres – Advance, MO Welcome to this fully updated 4-bedroom, 1.5-bathroom home offering over 1,600 sq. ft. of comfortable living space in Parkview Acres subdivision. This property sits on a spacious 0.594-acre lot, providing the perfect blend of space and functionality. Step inside to find a bright, modern interior featuring newer flooring, fresh paint, updated trim, and contemporary finishes throughout. The floor plan offers plenty of room for both relaxation and entertaining, with a large living area and an inviting kitchen ready for your favorite meals and gatherings. A 16' x 16' storage shed and an 18' x 28' detached garage provide excellent space for hobbies, tools, and vehicles. This well-maintained property is move-in ready and offers a peaceful neighborhood setting while still being conveniently close to schools, shops, and local amenities. Schedule your showing today — this one won’t last long!
Key facts
- Spacious lot
- Storage shed
- Updated interior
Tags
Neighborhood map
What this means for you Summary
Snapshot
- This is a 3-bed/1.5-bath other listed at $145k.
Deal economics
- At list price, monthly cash flow is $-138 ($-2k/yr) — negative.
- To cash-flow at today's rent, offer at most $121k (16.8% below list).
- To meet the 1% rule (rent ≥ 1% of price), the offer needs to be $91k (37.2% below list).
- Recommended offer: $91k (37.2% below list) — sets the bar for 1% rule.
Location & tenants
- Location reads 63/100 on livability (#346 in MO) — a middle-class / working-renter tenant base. Strengths: cost of living A+, housing A+, crime A; Watch: schools D+, amenities F, commute F.
- Advance R-IV (rural): math 46% / reading 53% proficiency, ranked #55 of 324 in MO (top 17%) — families likely to look elsewhere, expect single-tenant / working-renter base with shorter leases.
- Market conditions: 6 active listings in the ZIP; 17 units permitted in Stoddard County in 2024 (0 in 5+ unit buildings).
Forward outlook
- In year one you build about $16k of equity ($1k loan paydown + $14k appreciation (10.0% local appreciation)).
- Stoddard County population projected at -12% by 2050 — secular population decline; favor cash flow + early exit over multi-decade hold.
- By year 3, paydown + projected appreciation supports a ~$39k cash-out refi (75% LTV) — recoverable capital for the next deal without selling this one.
Negotiation context
- It's been on market 167 days — a 12% lower offer ($128k) is reasonable based on typical stale-listing flexibility.
- 3 sale attempts since 2y ago with the ask held roughly flat each time — persistent listings suggest the price (not the market) is what's stuck; bring a comps-based counter.
Risks & watch-outs
- Climate carrying-cost: extreme-heat days projected 7→20/yr by 2055 (HVAC capex compounding) — expect insurance premiums to compound above CPI over the hold.
Questions for the listing agent
- What do current leases actually rent for vs. the listed asking? Can we see a recent rent roll and the last 12 months of T-12 income?
- It's been on market 167 days. Have you received any prior offers? Is the seller open to a 37% concession, seller financing, or rate buy-down credit?
- Built in 1970 — when were the roof, HVAC, electrical panel, plumbing, and water heater last replaced?
- Why hasn't it sold? Are there any deal-killer items the seller is aware of (foundation, flood, title, zoning, code violations)?
- Is there a deadline driving the sale (1031 exchange, divorce, estate, relocation)? That informs how much negotiation room exists.
- Schools are D-rated, which usually means shorter tenancies and higher turnover. Who's the typical renter profile here, and what's been the actual vacancy rate?
- The area grade is low — what's the realistic commute time and amenity access for the typical tenant pool here? Any planned neighborhood developments (good or bad) we should know about?
- What's the average days-on-market for RENTAL listings here right now (not sales)? A rising rental-DOM trend means longer vacancies and softer asking-rent achievability than the comps imply.
- What's the recent tenant-quality profile in this submarket — average credit score on applications, eviction rate, late-payment / NSF rate, and stable-employment percentage? A property-management company in the area should have these aggregated.
- How much new for-sale + rental construction is in the pipeline within 1–3 miles? Heavy new supply typically softens prices + rents 12–24 months out; constrained supply supports both.
Investment metrics
- 1% rule
- 0.63% ✗
- Cap rate
- 5.15%
- Cash-on-cash
- -4.08%
- DSCR
- 0.82
- GRM
- 13.3
CMA / ARV
- ARV (median comp)
- $186,157
- List price
- $145,000
- Delta
- -22.11%
- Verdict
- UNDERPRICED
- Comps
- 16 within 1.0 mi
Projected returns pro-forma
10.0% appreciation · 3.0% rent growth · sell at horizon
- IRR
- 21.4%
- Equity multiple
- 2.73×
- Total profit
- $70,113
- Equity at exit
- $130,627
- IRR
- 19.3%
- Equity multiple
- 6.25×
- Total profit
- $213,227
- Equity at exit
- $281,703
Cash invested: $40,600 (down + closing). Projections, not guarantees.
Landlord ↔ Tenant lean methodology
- Overall (STATE)
- 81 Strongly Landlord-Friendly
- State Missouri
- 81 Strongly Landlord-Friendly · R+10
- County
- — inherits STATE
- City
- — inherits STATE
ZIP-level market 63730
- Home prices YoY
- 33.1%
- Active inventory
- 6
- Price-to-rent
- 13.3×
Monthly cashflow live
- Estimated rent
- $911 medium interval (Pro) →
- Mortgage (P&I)
- −$760
- Tax from tax record
- −$37 /mo · $438/yr
- Insurance
- −$60
- HOA
- −$0
- Vacancy / Maint / Mgmt
- −$191
- Net cashflow
- $-138
Break-even live
UW: 25.0% down · 7.5% · 30yr · 1.5% tax · 5.0% vac · 8.0% maint · 8.0% mgmt
Financing live
Cash to close
- Down payment
- $36,250
- Closing costs
- $4,350
- Reserves months
- —
- Total cash needed
- —
Loan-product check · same deal, 3 products live
Conventional
25% down · 7.5% · 30yr
- Down + closing
- —
- Monthly P&I
- —
- Monthly cashflow
- —
- DSCR
- —
- Eligible?
- —
Personal DTI + credit; lowest rate.
DSCR
20% down · 8.5% · 30yr
- Down + closing
- —
- Monthly P&I
- —
- Monthly cashflow
- —
- DSCR
- —
- Eligible?
- —
No personal income docs; deal must DSCR.
Hard money
10% down · 12.0% · 12mo
- Down + closing
- —
- Monthly P&I
- —
- Monthly cashflow
- —
- DSCR
- —
- Eligible?
- —
Short-term bridge; refi at stabilization.
Listing history 18 events
-
2026-06-18days on market $145,000 Active 167 DOM
-
2026-06-17days on market $145,000 Active 166 DOM
-
2026-06-16days on market $145,000 Active 165 DOM
-
2026-06-15days on market $145,000 Active 164 DOM
-
2026-06-13days on market $145,000 Active 162 DOM
-
2026-06-12days on market $145,000 Active 161 DOM
-
2026-06-09days on market $145,000 Active 158 DOM
-
2026-06-08days on market $145,000 Active 157 DOM
-
2026-06-07days on market $145,000 Active 156 DOM
-
2026-06-07days on market $145,000 Active 155 DOM
-
2026-06-04days on market $145,000 Active 152 DOM
-
2026-06-02days on market $145,000 Active 151 DOM
-
2026-06-01days on market $145,000 Active 150 DOM
-
2026-05-31days on market $145,000 Active 149 DOM
-
2026-01-02$145,000 Active 981-char remark
Show marketing remark (981 chars)
Beautifully Updated 4-Bedroom Home in Parkview Acres – Advance, MO Welcome to this fully updated 4-bedroom, 1.5-bathroom home offering over 1,600 sq. ft. of comfortable living space in Parkview Acres subdivision. This property sits on a spacious 0.594-acre lot, providing the perfect blend of space and functionality. Step inside to find a bright, modern interior featuring newer flooring, fresh paint, updated trim, and contemporary finishes throughout. The floor plan offers plenty of room for both relaxation and entertaining, with a large living area and an inviting kitchen ready for your favorite meals and gatherings. A 16' x 16' storage shed and an 18' x 28' detached garage provide excellent space for hobbies, tools, and vehicles. This well-maintained property is move-in ready and offers a peaceful neighborhood setting while still being conveniently close to schools, shops, and local amenities. Schedule your showing today — this one won’t last long!
-
2025-11-11$145,000 Active
-
2024-11-05historical
-
2024-09-10$129,000 Active
ⓘ Source: listings_history table (triggers on properties + properties_extension) + one-shot
backfill from property_details.listing_events for pre-trigger history.
Tax reassessment forecast MO · Resets to sale price
- Current annual tax
- $438 · $37/mo
- Projected year-2 tax
- $1,406 · $117/mo
- Expected delta
- +$968/yr (+$81/mo · 221.0%)
ⓘ Screening estimate from a state-policy table — verify with the county assessor before closing.
Climate risk First Street
- Flood 4/10 Moderate FEMA zone X · 24% chance over 30 yrs
- Wildfire 1/10 Low
- Heat 5/10 Major 7 d/yr ≥108°F today · 20 d/yr by 30 yrs out
- Wind 3/10 Moderate 5% chance of damaging wind over 30 yrs
- Air quality 2/10 Low 0 unhealthy d/yr today · 1 by 30 yrs out
Nearby sold comps map
Loading sold comps map…
Walkable amenities ~0.75 mi
Loading nearby amenities…
Taxation est. · year 1
- Rental income
- $10,928
- − Mortgage interest
- −$8,122
- − Property taxes
- −$438
- − Insurance
- −$725
- − Repairs & maintenance
- −$874
- − Management
- −$874
- − Depreciation
- −$4,218
- Taxable loss
- −$4,324
- Est. tax savings @ 24.0%
- +$1,038
- After-tax cash flow
- $-617/yr
For passive investors: Depreciation is non-cash, so a rental often shows a tax loss while cash-flowing — sheltering income. Rental losses are passive: they offset passive income freely, and up to $25,000/yr can offset ordinary (W-2) income if you actively participate and your MAGI is under $100k (phasing out to $0 by $150k); unused losses carry forward. On sale, claimed depreciation is recaptured at up to 25%, and gains may owe capital-gains tax (a 1031 exchange can defer both). Figures are a year-1 estimate at your 24.0% rate — not tax advice; consult a CPA.
Schools (NCES district)
- District
- Advance R-IV
- NCES district ID
- 2902880
- Math proficiency
- 46% ▲ 3.00%
- Reading proficiency
- 53% ▲ 3.00%
- Median HH income
- $37,982
- Composite
- 41.2/100
- National rank
- #3541
- State rank
- #55 of 324 in MO
Livability — Advance
- Score
- 63/100
- State rank
- #346
- US rank
- #15586
Category grades
Schools grade is shown separately in the Schools card above.
Census & demographics
- Population (ZIP)
- 3,667
Population outlook (Stoddard County) Hauer SSP2
- Today (2025)
- 29,096 people
- By 2030
- 28,478 · -2.1%
- By 2040
- 27,073 · -7.0%
- By 2050
- 25,512 · -12.3%
- By 2075
- 21,740 · -25.3%
- By 2100
- 17,841 · -38.7%
Race, ethnicity, and origin ACS 2023
- Neighborhood character
- Predominantly White (96%)
- Race & ethnicity
- White 96% Two or more races 4%
- Common ancestry
- Iranian 2% Italian 1% Lithuanian 1%
- Foreign-born
- 0%
- Languages at home
- 99% English-only · Spanish 1%
Political lean MEDSL · Stoddard
- 2024 margin
- Solid R (+73.9) · D 12.8% · R 86.7%
- 2008→2024 swing
- -34.1pp toward R · 2008: -39.8pp · 2024: -73.9pp
- All cycles
- 2024: R+73.9 2020: R+72.0 2016: R+69.3 2012: R+49.3 2008: R+39.8
Not yet ingested
- Civics
- —
Market trends
- HPI YoY
- ▲ 56.06%
- Current HPI
- 225.37
- Rent YoY
- —
- Metro
- —
- State GDP YoY
- ▲ 1.84%
- F500 in state
- 20
Industry mix (Fortune 500 HQ in MO)
| Industry | F500 HQs | Revenue |
|---|---|---|
| Healthcare | 1 | $163B |
|
||
| Insurance | 1 | $21B |
|
||
| Industrial Technology | 1 | $17B |
|
||
| Retail | 1 | $16B |
|
||
| Industrial Distribution | 1 | $10B |
|
||
| Utilities | 1 | $9B |
|
||
Price history
+12.4% since first listed4 events — show timeline
- 2026-01-02 Listed $145,000 MARIS as Distributed by MLS Grid
- 2025-11-11 Listed $145,000 MARIS as Distributed by MLS Grid
- 2024-11-05 Delisted — MARIS as Distributed by MLS Grid
- 2024-09-10 Listed $129,000 MARIS as Distributed by MLS Grid
Property tax history
+3.2%/yrLatest (2025): $438 · +6.2% YoY. Source: county tax records.
Cash-flow waterfall
monthlySold comps — $/sqft
last 12 mo · ≤1 miLoading sold comps…