325 Coppice Pl · Bossier City, LA
Flood risk No data
- FEMA flood zone
- —
- Chance of flooding over 30 yrs
- —
- Est. flood insurance / yr
- —
Fire risk No data
- Est. fire insurance / yr
- —
Heat risk No data
- Hot days now (above threshold)
- —
- Hot days in 30 yrs
- —
Wind risk No data
- Chance of severe wind over 30 yrs
- —
Air-quality risk No data
- Unhealthy air days now
- —
- Unhealthy air days in 30 yrs
- —
Risk factors via First Street. Map © Google.
Why this score? — see what drove the D grade
The composite is a weighted blend of 9 inputs, each scored 0–100. Each bar is that input's sub-score; the figure is the points it added to the 100-point composite (weight × sub-score).
- Cash flow +10.8/30.0
- ARV discount +10.6/15.0
- Rent growth +4.1/5.0
- Schools +3.8/10.0
- Livability +3.6/5.0
- DSCR +3.1/10.0
- 1% rule +2.5/10.0
- Condition / age +2.5/5.0
- Appreciation +0.0/10.0
$285,000
🖨 Deal sheet (PDF) 📄 Offer letter ✓ Due diligence
Listing remarks MLS
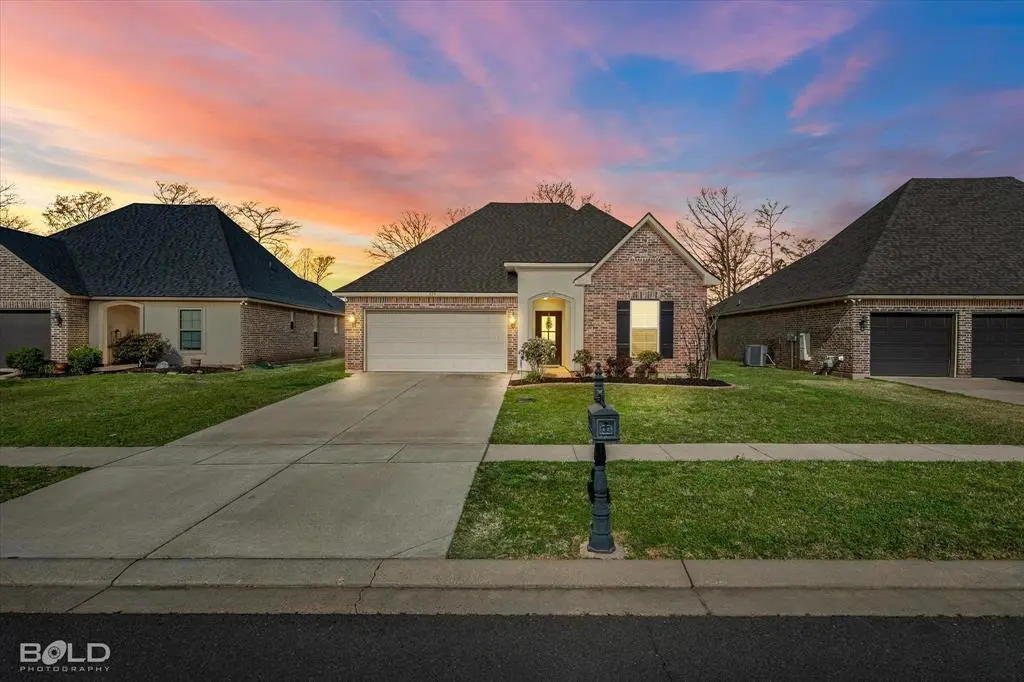
Welcome to 325 Coppice Place in Bossier City—an exceptional home built in 2019 that's perfectly situated on a serene BAYOU LOT! Offering 1,848 square feet of thoughtfully designed living space, this 3-bedroom, 2-bathroom home blends modern style with everyday comfort. Step inside to find an open and inviting floor plan featuring granite countertops throughout, sleek modern fixtures, and quality finishes that elevate every space. The open-concept kitchen flows seamlessly into the living and dining areas, making it ideal for both entertaining and daily living. Out back, enjoy peaceful views of the bayou right from your backyard—perfect for unwinding or hosting gatherings in a tranquil, natural setting. *Located in the Kingston and Benton school district* Call today to schedule a showing appointment!
Key facts
- Open-concept kitchen
- Peaceful views
- Granite countertops
Tags
Neighborhood map
What this means for you Summary
Snapshot
- This is a 3-bed/2.0-bath single-family listed at $285k.
Deal economics
- At list price, monthly cash flow is $-128 ($-2k/yr) — negative.
- To cash-flow at today's rent, offer at most $262k (7.9% below list).
- To meet the 1% rule (rent ≥ 1% of price), the offer needs to be $215k (24.7% below list).
- Recommended offer: $215k (24.7% below list) — sets the bar for 1% rule.
- Cap rate 5.8% vs local median 4.7% in Bossier City — meaningfully above typical; check what's discounted (condition, days-on-market, listing class) to confirm the premium yield is real.
Location & tenants
- Location reads 71/100 on livability (#47 in LA) — a middle-class / working-renter tenant base. Strengths: commute A+, cost of living A+, housing A+; Watch: employment D+, crime F, amenities F.
- Bossier Parish (urban): math 40% / reading 47% proficiency, ranked #17 of 98 in LA (top 17%) — families likely to look elsewhere, expect single-tenant / working-renter base with shorter leases.
- Zoned schools: Kingston Elementary School (math 73% / reading 69%, grade A-, #23 of 646 statewide, top 4%, 820 students, 33% FRL); Benton Middle School (math 49% / reading 58%, grade C+, #21 of 218 statewide, top 9%, 850 students, 34% FRL); Benton High School (math 55% / reading 63%, grade C+, #22 of 265 statewide, top 8%, 1,538 students, 28% FRL).
- Zoned-school proficiency averages 61% at this address vs 44% district-wide (+18 pts) — the actual schools serving this property are materially stronger than the Bossier Parish average implies; a family-tenant draw the district grade alone would hide.
- Market conditions: Rents rising fast (+6.6%/yr); 426 active listings in the ZIP; 5 comparable units currently listed for rent nearby; rentals at typical pace (median 23d on market — plan ~3-4 weeks tenant-placement turnaround); 716 units permitted in Bossier Parish in 2024 (0 in 5+ unit buildings).
- This rent runs 39% of the median local income ($65k/yr) — at the standard rent-burdened threshold; future hikes will face affordability resistance.
Forward outlook
- Local home prices are declining (-3.0%/yr); year-one equity from $2k of loan paydown is wiped out by about $9k of value loss. Plan a longer hold.
- Bossier County population projected at +28% by 2050 — long-run rental-demand tailwind backs the buy-and-hold thesis.
Negotiation context
- It's been on market 83 days — a 6% lower offer ($268k) is reasonable based on typical stale-listing flexibility.
Questions for the listing agent
- What do current leases actually rent for vs. the listed asking? Can we see a recent rent roll and the last 12 months of T-12 income?
- It's been on market 83 days. Have you received any prior offers? Is the seller open to a 25% concession, seller financing, or rate buy-down credit?
- What does the HOA fee cover, when was the last increase, and are there any pending special assessments or reserve-fund shortfalls?
- Why hasn't it sold? Are there any deal-killer items the seller is aware of (foundation, flood, title, zoning, code violations)?
- Is there a deadline driving the sale (1031 exchange, divorce, estate, relocation)? That informs how much negotiation room exists.
- Schools are B-rated — typically a magnet for longer-tenancy family renters. What's the average tenant stay here, and is there a school-zone premium baked into asking?
- Crime grade is F in this area — have there been break-ins, vandalism, or insurance claims at this property in the last 3 years? What carrier currently insures it and at what premium?
- The area grade is low — what's the realistic commute time and amenity access for the typical tenant pool here? Any planned neighborhood developments (good or bad) we should know about?
- What's the average days-on-market for RENTAL listings here right now (not sales)? A rising rental-DOM trend means longer vacancies and softer asking-rent achievability than the comps imply.
- What's the recent tenant-quality profile in this submarket — average credit score on applications, eviction rate, late-payment / NSF rate, and stable-employment percentage? A property-management company in the area should have these aggregated.
- How much new for-sale + rental construction is in the pipeline within 1–3 miles? Heavy new supply typically softens prices + rents 12–24 months out; constrained supply supports both.
Investment metrics
- 1% rule
- 0.75% ✗
- Cap rate
- 5.75%
- Cash-on-cash
- -1.93%
- DSCR
- 0.91
- GRM
- 11.1
CMA / ARV
- ARV (median comp)
- $305,863
- List price
- $285,000
- Delta
- -6.82%
- Verdict
- FAIR
- Comps
- 20 within 1.0 mi
Show comp detail 12 sales within ~0.75 mi
| Address | Dist | Beds/Ba | Sqft | Sold | Price | $/sf | Match |
|---|---|---|---|---|---|---|---|
| 714 Crozier Dr | 0.36mi | 3/2.0 | 1,848 (0%) | 1mo | $279,999 | $152 | 82 |
| 209 Norwell Ln | 0.38mi | 3/2.0 | 1,848 (0%) | 3mo | $300,000 | $162 | 80 |
| 512 Chinquipin Dr | 0.45mi | 3/2.0 | 1,848 (0%) | 0mo | $312,000 | $169 | 79 |
| 703 Crozier Dr | 0.31mi | 4/2.5 (+1) | 1,851 (+0%) | 1mo | $300,000 | $162 | 77 |
| 613 Alder Ln | 0.36mi | 4/3.0 (+1) | 1,908 (+3%) | 2mo | $320,000 | $168 | 67 |
| 949 Maize St | 0.40mi | 4/2.0 (+1) | 1,961 (+6%) | 1mo | $310,000 | $158 | 66 |
| 780 Crozier Dr | 0.50mi | 4/2.5 (+1) | 1,902 (+3%) | 4mo | $298,000 | $157 | 62 |
| 903 Hackberry Dr | 0.14mi | 4/3.0 (+1) | 2,092 (+13%) | 2mo | $310,631 | $148 | 61 |
| 840 Entrada St | 0.34mi | 3/2.0 | 1,583 (-14%) | 2mo | $275,000 | $174 | 58 |
| 657 Alder Ln | 0.61mi | 4/2.0 (+1) | 1,954 (+6%) | 1mo | $315,900 | $162 | 57 |
| 320 Camelback Dr | 0.44mi | 4/2.0 (+1) | 2,050 (+11%) | 0mo | $299,995 | $146 | 56 |
| 1002 Maize St | 0.69mi | 3/2.0 | 1,994 (+8%) | 0mo | $299,000 | $150 | 54 |
Match score weights: distance 35% · size 25% · config 20% · recency 20%. Top-matched comps best support the ARV.
Projected returns pro-forma
-3.0% appreciation · 6.56% rent growth · sell at horizon
- IRR
- -15.9%
- Equity multiple
- 0.42×
- Total profit
- $-46,437
- Equity at exit
- $42,494
- IRR
- -2.6%
- Equity multiple
- 0.80×
- Total profit
- $-16,031
- Equity at exit
- $24,642
Cash invested: $79,800 (down + closing). Projections, not guarantees.
Landlord ↔ Tenant lean methodology
- Overall (STATE)
- 90 Strongly Landlord-Friendly
- State Louisiana
- 90 Strongly Landlord-Friendly · R+12
- County
- — inherits STATE
- City
- — inherits STATE
ZIP-level market 71111
- Home prices YoY
- -34.8%
- Rents YoY
- 6.6%
- Active inventory
- 426
- Price-to-rent
- 11.1×
Monthly cashflow live
- Estimated rent
- $2,145 high interval (Pro) →
- Mortgage (P&I)
- −$1,495
- Tax from tax record
- −$180 /mo · $2,154/yr
- Insurance
- −$119
- HOA
- −$30
- Vacancy / Maint / Mgmt
- −$451
- Net cashflow
- $-128
Break-even live
Sensitivity live
| Price | -10% $33 | -5% $-47 | +0% $-128 | +5% $-209 | +10% $-289 |
|---|---|---|---|---|---|
| Rent | -10% $-298 | -5% $-213 | +0% $-128 | +5% $-43 | +10% $41 |
| Rate | -1.0pp $15 | -0.5pp $-56 | base $-128 | +0.5pp $-202 | +1.0pp $-277 |
UW: 25.0% down · 7.5% · 30yr · 1.5% tax · 5.0% vac · 8.0% maint · 8.0% mgmt
Financing live
Cash to close
- Down payment
- $71,250
- Closing costs
- $8,550
- Reserves months
- —
- Total cash needed
- —
Loan-product check · same deal, 3 products live
Conventional
25% down · 7.5% · 30yr
- Down + closing
- —
- Monthly P&I
- —
- Monthly cashflow
- —
- DSCR
- —
- Eligible?
- —
Personal DTI + credit; lowest rate.
DSCR
20% down · 8.5% · 30yr
- Down + closing
- —
- Monthly P&I
- —
- Monthly cashflow
- —
- DSCR
- —
- Eligible?
- —
No personal income docs; deal must DSCR.
Hard money
10% down · 12.0% · 12mo
- Down + closing
- —
- Monthly P&I
- —
- Monthly cashflow
- —
- DSCR
- —
- Eligible?
- —
Short-term bridge; refi at stabilization.
Rent comps 5 comps
| Address | Beds | Baths | Sqft | Rent | $/sqft | DOM | Units | Dist |
|---|---|---|---|---|---|---|---|---|
| 606 Acacia Dr Bossier City, LA | 3.0 | 2.0 | 1765 | $2,200 | $1.25 | 23d | 1 | 0.10mi |
| 217 Norwell Ln Bossier City, LA | 4.0 | 2.5 | 1851 | $2,400 | $1.30 | 23d | 1 | 0.38mi |
| 90 Kingston Xing Bossier City, LA | 1.0–3.0 | 1.0–2.0 | 1150 | $2,015 | $1.75 | 15d | 14 | 1.00mi |
| 3283 Grand Lake Dr Bossier City, LA | 3.0 | 2.0 | 1302 | $1,950 | $1.50 | 23d | 1 | 1.27mi |
| 3348 Grand Lake Dr Bossier City, LA | 3.0 | 2.0 | 1800 | $2,100 | $1.17 | 23d | 1 | 1.31mi |
HOA detail
- Monthly dues
- $30 · $360/yr
Listing history 10 events
-
2026-06-13statusdays on market $285,000 Pending 83 DOM
-
2026-06-10days on market $285,000 Active Contingent 82 DOM
-
2026-06-09days on market $285,000 Active Contingent 81 DOM
-
2026-06-08days on market $285,000 Active Contingent 80 DOM
-
2026-06-07days on market $285,000 Active Contingent 79 DOM
-
2026-06-02days on market $285,000 Active Contingent 74 DOM
-
2026-06-01days on market $285,000 Active Contingent 73 DOM
-
2026-05-31days on market $285,000 Active Contingent 72 DOM
-
2026-05-30days on market $285,000 Active Contingent 71 DOM
-
2026-03-20$285,000 Active 829-char remark
Show marketing remark (829 chars)
Welcome to 325 Coppice Place in Bossier City—an exceptional home built in 2019 that's perfectly situated on a serene BAYOU LOT! Offering 1,848 square feet of thoughtfully designed living space, this 3-bedroom, 2-bathroom home blends modern style with everyday comfort. Step inside to find an open and inviting floor plan featuring granite countertops throughout, sleek modern fixtures, and quality finishes that elevate every space. The open-concept kitchen flows seamlessly into the living and dining areas, making it ideal for both entertaining and daily living. Out back, enjoy peaceful views of the bayou right from your backyard—perfect for unwinding or hosting gatherings in a tranquil, natural setting. *Located in the Kingston and Benton school district* Call today to schedule a showing appointment!
ⓘ Source: listings_history table (triggers on properties + properties_extension) + one-shot
backfill from property_details.listing_events for pre-trigger history.
Tax reassessment forecast LA · Resets to sale price
- Current annual tax
- $2,154 · $180/mo
- Projected year-2 tax
- $2,154 · $180/mo
- Expected delta
- $0/yr ($0/mo · 0.0%)
ⓘ Screening estimate from a state-policy table — verify with the county assessor before closing.
Nearby sold comps map
Loading sold comps map…
Walkable amenities ~0.75 mi
Loading nearby amenities…
Taxation est. · year 1
- Rental income
- $25,743
- − Mortgage interest
- −$15,964
- − Property taxes
- −$2,154
- − Insurance
- −$1,425
- − Repairs & maintenance
- −$2,059
- − Management
- −$2,059
- − HOA
- −$360
- − Depreciation
- −$8,291
- Taxable loss
- −$6,570
- Est. tax savings @ 24.0%
- +$1,577
- After-tax cash flow
- $40/yr
For passive investors: Depreciation is non-cash, so a rental often shows a tax loss while cash-flowing — sheltering income. Rental losses are passive: they offset passive income freely, and up to $25,000/yr can offset ordinary (W-2) income if you actively participate and your MAGI is under $100k (phasing out to $0 by $150k); unused losses carry forward. On sale, claimed depreciation is recaptured at up to 25%, and gains may owe capital-gains tax (a 1031 exchange can defer both). Figures are a year-1 estimate at your 24.0% rate — not tax advice; consult a CPA.
Schools (NCES district)
- District
- Bossier Parish
- NCES district ID
- 2200270
- Math proficiency
- 40% ▼ -32.00%
- Reading proficiency
- 47% ▼ -28.00%
- Median HH income
- $51,326
- Composite
- 37.5/100
- National rank
- #4402
- State rank
- #17 of 98 in LA
Livability — Bossier City
- Score
- 71/100
- State rank
- #47
- US rank
- #7044
Category grades
Schools grade is shown separately in the Schools card above.
Census & demographics
- County
- Bossier Parish · 98,704 people
- City population
- 91,925
- Metro
- Shreveport-Bossier City, LA
- Population (ZIP)
- 43,925
- Household income
- $65,292
- Rent vs Own
- Severe rent burden
- 1942.0
Population outlook (Bossier County) Hauer SSP2
- Today (2025)
- 143,247 people
- By 2030
- 151,802 · +6.0%
- By 2040
- 168,194 · +17.4%
- By 2050
- 183,533 · +28.1%
- By 2075
- 217,009 · +51.5%
- By 2100
- 230,091 · +60.6%
Race, ethnicity, and origin ACS 2023
- Neighborhood character
- Diverse neighborhood (Simpson 0.60)
- Race & ethnicity
- White 56% Black 29% Hispanic / Latino 9% Two or more races 8% Asian 3%
- Hispanic origin (detail)
- Mexican 5%
- Common ancestry
- Lithuanian 2% Iranian 1% Slovak 1%
- Foreign-born
- 5% · Canada, Vietnam
- Languages at home
- 90% English-only · Spanish 7% Vietnamese 1% French/Haitian/Cajun 1%
Political lean MEDSL · Bossier
- 2024 margin
- Solid R (+43.3) · D 27.7% · R 71.0% · Other 1.3%
- 2008→2024 swing
- +0.3pp no change · 2008: -43.7pp · 2024: -43.3pp
- All cycles
- 2024: R+43.3 2020: R+41.0 2016: R+45.8 2012: R+45.4 2008: R+43.7
Not yet ingested
- Civics
- —
Market trends
- HPI YoY
- ▼ -79.78%
- Current HPI
- 149.4336
- Rent YoY
- ▲ 6.56%
- Metro
- Shreveport-Bossier City, LA
- State GDP YoY
- ▲ 3.29%
- F500 in state
- 10
Industry mix (Fortune 500 HQ in LA)
| Industry | F500 HQs | Revenue |
|---|---|---|
| Telecommunications | 2 | $23B |
|
||
| Utilities | 1 | $12B |
|
||
| Wholesale / Distribution | 1 | $5B |
|
||
| Advertising | 1 | $2B |
|
||
Price history
1 event — show timeline
- 2026-03-20 Listed $285,000 NTREIS
Property tax history
+25.0%/yrLatest (2025): $2,154 · -1.0% YoY. Source: county tax records.
Cash-flow waterfall
monthlySold comps — $/sqft
last 12 mo · ≤1 miLoading sold comps…