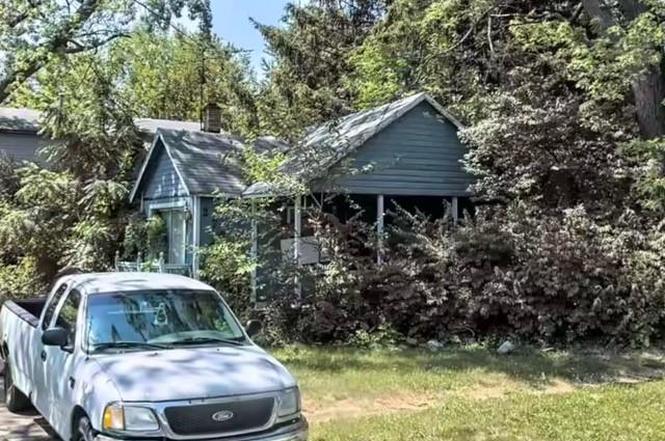
27217 Yale St · Inkster, MI
Flood risk 1/10 · Minimal
- FEMA flood zone
- X (unshaded)
- Chance of flooding over 30 yrs
- 0.0%
- Est. flood insurance / yr
- $507 – $1,088
Fire risk 1/10 · Minimal
- Est. fire insurance / yr
- $784 – $1,456
Heat risk 3/10 · Minor
- Hot days now (above 98°F)
- 7 days/yr
- Hot days in 30 yrs
- 14 days/yr
Wind risk 2/10 · Minimal
- Chance of severe wind over 30 yrs
- —
Air-quality risk 2/10 · Minimal
- Unhealthy air days now
- 1 days/yr
- Unhealthy air days in 30 yrs
- 2 days/yr
Risk factors via First Street. Map © Google.
Why this score? — see what drove the D grade
The composite is a weighted blend of 9 inputs, each scored 0–100. Each bar is that input's sub-score; the figure is the points it added to the 100-point composite (weight × sub-score).
- Cash flow +15.0/30.0
- ARV discount +7.5/15.0
- 1% rule +5.0/10.0
- DSCR +5.0/10.0
- Livability +3.4/5.0
- Rent growth +3.2/5.0
- Condition / age +2.5/5.0
- Schools +0.7/10.0
- Appreciation +0.0/10.0
$35,000
🖨 Deal sheet 📄 Offer letter ✓ Due diligence
Listing remarks MLS
BUYER AND AGENT MUST SIGN HOLD HARMLESS LETTER TO SCHEDULE SHOWING. ENTER AT OWN RISK. BEING SOLD AS IS. OVER 2800 SQFT. SITS ON 0.31 ACRE LOT. HOME NEEDS A FULL REHAB AND FULL TRASHOUT. BUYER TO ASSUME HOME AS IS. LOCATED CLOSE TO SCHOOLS, SHOPPING, AND MAJOR FREEWAYS. UPLOAD HOLD HARMLESS LETTER IN DOCUMENTS SECTION. HOLD HARMLESS LETTER MUST BE SIGNED BY THE BUYER AND AGENT BEFORE ENTRY IS GRANTED.
Key facts
- 0.31 acre lot
- Built 1925
- Listed 27 days
Neighborhood map
What this means for you Summary
Snapshot
- This is a 4-bed/2.5-bath single-family listed at $35k.
Deal economics
- At list price, monthly cash flow is $1k ($13k/yr) — positive.
- The deal already cash-flows at list — no discount required.
- Meets the 1% rule at list price ($2k rent vs $35k).
- Recommended offer: $34k (1.5% below list) — sets the bar for market timing.
- Cap rate 42.6% vs local median 9.8% in Inkster — top-decile yield for the area; either an underpriced asset or a hidden risk that comps aren't pricing in. Stress-test before assuming the spread holds.
Location & tenants
- Location reads 67/100 on livability (#406 in MI) — a middle-class / working-renter tenant base. Strengths: commute A+, cost of living A+, housing A+; Watch: health & safety D, schools F, crime F.
- Westwood Community School District (suburban): math 6% / reading 11% proficiency, ranked #529 of 540 in MI (top 98%) — low school quality limits family demand, transient renter base, plan for 1-2y turnover; 81% free/reduced lunch — lower-income household profile, screen leases tightly.
- Market conditions: Rents rising (+3.0%/yr); 142 active listings in the ZIP; 1 comparable units currently listed for rent nearby; lower-income renter base — watch delinquency; 2,639 units permitted in Wayne County in 2024 (1,216 in 5+ unit buildings).
- At $1,764/mo this rent would consume 54% of the median local household income ($39k/yr) (locally 1558% of renters already pay >50% of income on rent) — very limited rent-growth headroom before tenants either downsize or default.
Forward outlook
- Local home prices are declining (-3.0%/yr); year-one equity from $242 of loan paydown is wiped out by about $1k of value loss. Plan a longer hold.
- Wayne County population projected at -17% by 2050 — secular population decline; favor cash flow + early exit over multi-decade hold.
- At projected returns (-3.0% appreciation + 3.0% rent growth), your $10k cash investment doubles in ~1 year — after that, you're playing with house money.
Negotiation context
- It's been on market 27 days — a 2% lower offer ($34k) is reasonable based on typical stale-listing flexibility.
- 2 sale attempts with the ask held roughly flat each time — persistent listings suggest the price (not the market) is what's stuck; bring a comps-based counter.
Risks & watch-outs
- Watch-outs: property tax is 4.7% of price; built in 1925 — expect roof / HVAC / electrical / plumbing capex.
Questions for the listing agent
- Built in 1925 — when were the roof, HVAC, electrical panel, plumbing, and water heater last replaced?
- Property tax is high relative to price — has the assessment been appealed recently, and will the sale trigger a re-assessment?
- Is there a deadline driving the sale (1031 exchange, divorce, estate, relocation)? That informs how much negotiation room exists.
- Schools are F-rated, which usually means shorter tenancies and higher turnover. Who's the typical renter profile here, and what's been the actual vacancy rate?
- Crime grade is F in this area — have there been break-ins, vandalism, or insurance claims at this property in the last 3 years? What carrier currently insures it and at what premium?
- The area grade is low — what's the realistic commute time and amenity access for the typical tenant pool here? Any planned neighborhood developments (good or bad) we should know about?
- What's the average days-on-market for RENTAL listings here right now (not sales)? A rising rental-DOM trend means longer vacancies and softer asking-rent achievability than the comps imply.
- What's the recent tenant-quality profile in this submarket — average credit score on applications, eviction rate, late-payment / NSF rate, and stable-employment percentage? A property-management company in the area should have these aggregated.
- How much new for-sale + rental construction is in the pipeline within 1–3 miles? Heavy new supply typically softens prices + rents 12–24 months out; constrained supply supports both.
Investment metrics
- 1% rule
- 5.04% ✓
- Cap rate
- 42.57%
- Cash-on-cash
- 129.56%
- DSCR
- 6.76
- GRM
- 1.7
CMA / ARV
No comps found within radius.
Projected returns pro-forma
-3.0% appreciation · 2.95% rent growth · sell at horizon
- IRR
- —
- Equity multiple
- 7.30×
- Total profit
- $61,713
- Equity at exit
- $5,219
- IRR
- —
- Equity multiple
- 15.34×
- Total profit
- $140,492
- Equity at exit
- $3,026
Cash invested: $9,800 (down + closing). Projections, not guarantees.
Landlord ↔ Tenant lean methodology
- Overall (STATE)
- 62 Landlord-Friendly
- State Michigan
- 62 Landlord-Friendly · EVEN
- County
- — inherits STATE
- City
- — inherits STATE
ZIP-level market 48141
- Home prices YoY
- -2.9%
- Rents YoY
- 3.0%
- Active inventory
- 142
- Price-to-rent
- 1.7×
Monthly cashflow live
- Estimated rent
- $1,764 medium interval (Pro) →
- Mortgage (P&I)
- −$184
- Tax from tax record
- −$138 /mo · $1,651/yr
- Insurance
- −$15
- HOA
- −$0
- Vacancy / Maint / Mgmt
- −$370
- Net cashflow
- $1,058
Break-even live
UW: 25.0% down · 7.5% · 30yr · 1.5% tax · 5.0% vac · 8.0% maint · 8.0% mgmt
Financing live
Cash to close
- Down payment
- $8,750
- Closing costs
- $1,050
- Reserves months
- —
- Total cash needed
- —
Loan-product check · same deal, 3 products live
Conventional
25% down · 7.5% · 30yr
- Down + closing
- —
- Monthly P&I
- —
- Monthly cashflow
- —
- DSCR
- —
- Eligible?
- —
Personal DTI + credit; lowest rate.
DSCR
20% down · 8.5% · 30yr
- Down + closing
- —
- Monthly P&I
- —
- Monthly cashflow
- —
- DSCR
- —
- Eligible?
- —
No personal income docs; deal must DSCR.
Hard money
10% down · 12.0% · 12mo
- Down + closing
- —
- Monthly P&I
- —
- Monthly cashflow
- —
- DSCR
- —
- Eligible?
- —
Short-term bridge; refi at stabilization.
Rent comps 1 comps
| Address | Beds | Baths | Sqft | Rent | $/sqft | DOM | Units | Dist |
|---|---|---|---|---|---|---|---|---|
| 24926 Hickory St Dearborn, MI | 3.0 | 1.0 | 2040 | $1,800 | $0.88 | 1d | 1 | 1.49mi |
Listing history 4 events
-
2025-12-02status Pending 404-char remark
Show marketing remark (404 chars)
BUYER AND AGENT MUST SIGN HOLD HARMLESS LETTER TO SCHEDULE SHOWING. ENTER AT OWN RISK. BEING SOLD AS IS. OVER 2800 SQFT. SITS ON 0.31 ACRE LOT. HOME NEEDS A FULL REHAB AND FULL TRASHOUT. BUYER TO ASSUME HOME AS IS. LOCATED CLOSE TO SCHOOLS, SHOPPING, AND MAJOR FREEWAYS. UPLOAD HOLD HARMLESS LETTER IN DOCUMENTS SECTION. HOLD HARMLESS LETTER MUST BE SIGNED BY THE BUYER AND AGENT BEFORE ENTRY IS GRANTED.
-
2025-12-02status Pending
Show marketing remark (404 chars)
BUYER AND AGENT MUST SIGN HOLD HARMLESS LETTER TO SCHEDULE SHOWING. ENTER AT OWN RISK. BEING SOLD AS IS. OVER 2800 SQFT. SITS ON 0.31 ACRE LOT. HOME NEEDS A FULL REHAB AND FULL TRASHOUT. BUYER TO ASSUME HOME AS IS. LOCATED CLOSE TO SCHOOLS, SHOPPING, AND MAJOR FREEWAYS. UPLOAD HOLD HARMLESS LETTER IN DOCUMENTS SECTION. HOLD HARMLESS LETTER MUST BE SIGNED BY THE BUYER AND AGENT BEFORE ENTRY IS GRANTED.
-
2025-11-05$35,000 Active
Show marketing remark (404 chars)
BUYER AND AGENT MUST SIGN HOLD HARMLESS LETTER TO SCHEDULE SHOWING. ENTER AT OWN RISK. BEING SOLD AS IS. OVER 2800 SQFT. SITS ON 0.31 ACRE LOT. HOME NEEDS A FULL REHAB AND FULL TRASHOUT. BUYER TO ASSUME HOME AS IS. LOCATED CLOSE TO SCHOOLS, SHOPPING, AND MAJOR FREEWAYS. UPLOAD HOLD HARMLESS LETTER IN DOCUMENTS SECTION. HOLD HARMLESS LETTER MUST BE SIGNED BY THE BUYER AND AGENT BEFORE ENTRY IS GRANTED.
-
2025-11-05$35,000 Active 404-char remark
Show marketing remark (404 chars)
BUYER AND AGENT MUST SIGN HOLD HARMLESS LETTER TO SCHEDULE SHOWING. ENTER AT OWN RISK. BEING SOLD AS IS. OVER 2800 SQFT. SITS ON 0.31 ACRE LOT. HOME NEEDS A FULL REHAB AND FULL TRASHOUT. BUYER TO ASSUME HOME AS IS. LOCATED CLOSE TO SCHOOLS, SHOPPING, AND MAJOR FREEWAYS. UPLOAD HOLD HARMLESS LETTER IN DOCUMENTS SECTION. HOLD HARMLESS LETTER MUST BE SIGNED BY THE BUYER AND AGENT BEFORE ENTRY IS GRANTED.
ⓘ Source: listings_history table (triggers on properties + properties_extension) + one-shot
backfill from property_details.listing_events for pre-trigger history.
Tax reassessment forecast MI · Partial reset (capped growth)
- Current annual tax
- $1,651 · $138/mo
- Projected year-2 tax
- $1,651 · $138/mo
- Expected delta
- $0/yr ($0/mo · 0.0%)
ⓘ Screening estimate from a state-policy table — verify with the county assessor before closing.
Climate risk First Street
- Flood 1/10 Low FEMA zone X (unshaded) · 0% chance over 30 yrs
- Wildfire 1/10 Low
- Heat 3/10 Moderate 7 d/yr ≥98°F today · 14 d/yr by 30 yrs out
- Wind 2/10 Low
- Air quality 2/10 Low 1 unhealthy d/yr today · 2 by 30 yrs out
Nearby sold comps map
Loading sold comps map…
Walkable amenities ~0.75 mi
Loading nearby amenities…
Taxation est. · year 1
- Rental income
- $21,171
- − Mortgage interest
- −$1,961
- − Property taxes
- −$1,651
- − Insurance
- −$175
- − Repairs & maintenance
- −$1,694
- − Management
- −$1,694
- − Depreciation
- −$1,018
- Taxable income
- $12,979
- Est. tax owed @ 24.0%
- −$3,115
- After-tax cash flow
- $9,582/yr
For passive investors: Depreciation is non-cash, so a rental often shows a tax loss while cash-flowing — sheltering income. Rental losses are passive: they offset passive income freely, and up to $25,000/yr can offset ordinary (W-2) income if you actively participate and your MAGI is under $100k (phasing out to $0 by $150k); unused losses carry forward. On sale, claimed depreciation is recaptured at up to 25%, and gains may owe capital-gains tax (a 1031 exchange can defer both). Figures are a year-1 estimate at your 24.0% rate — not tax advice; consult a CPA.
Schools (NCES district)
- District
- Westwood Community School District
- NCES district ID
- 2611640
- Math proficiency
- 6% ▼ -6.00%
- Reading proficiency
- 11% ▼ -6.00%
- Median HH income
- $36,350
- Composite
- 7.06/100
- National rank
- #9967
- State rank
- #529 of 540 in MI
Livability — Inkster
- Score
- 67/100
- State rank
- #406
- US rank
- #11087
Category grades
Schools grade is shown separately in the Schools card above.
Census & demographics
- Census place
- Inkster, MI
- County
- Wayne County · 1,562,939 people
- City population
- 25,428
- Metro
- Detroit-Warren-Dearborn, MI
- Population (ZIP)
- 25,428
- Household income
- $39,252
- Rent vs Own
- Severe rent burden
- 1558.0
Population outlook (Wayne County) Hauer SSP2
- Today (2025)
- 1,675,273 people
- By 2030
- 1,620,300 · -3.3%
- By 2040
- 1,502,341 · -10.3%
- By 2050
- 1,384,039 · -17.4%
- By 2075
- 1,124,592 · -32.9%
- By 2100
- 881,193 · -47.4%
Race, ethnicity, and origin ACS 2023
- Neighborhood character
- Predominantly Black (72%)
- Race & ethnicity
- Black 72% White 17% Two or more races 7% Hispanic / Latino 2% Asian 1%
- Common ancestry
- Romanian 3% Slovak 1% Italian 1%
- Foreign-born
- 5% · Canada, China
- Languages at home
- 92% English-only · Arabic 3% Other Asian/Pacific 1% Spanish 1%
Political lean MEDSL · Wayne
- 2024 margin
- Strong D (+29.0) · D 62.7% · R 33.7% · Other 3.6%
- 2008→2024 swing
- -20.5pp toward R · 2008: 49.5pp · 2024: 29.0pp
- All cycles
- 2024: D+29.0 2020: D+38.1 2016: D+37.3 2012: D+46.9 2008: D+49.5
Not yet ingested
- Civics
- —
Market trends
- HPI YoY
- ▼ -11.74%
- Current HPI
- 390.2139
- Rent YoY
- ▲ 2.95%
- Metro
- Detroit-Warren-Dearborn, MI
- State GDP YoY
- ▲ 1.37%
- F500 in state
- 28
Industry mix (Fortune 500 HQ in MI)
| Industry | F500 HQs | Revenue |
|---|---|---|
| Automotive Parts | 3 | $48B |
|
||
| Automotive | 2 | $372B |
|
||
| Chemicals | 1 | $45B |
|
||
| Automotive Retail | 1 | $29B |
|
||
| Healthcare / Medical Devices | 1 | $23B |
|
||
| Automotive Technology | 1 | $20B |
|
||
Price history
+0.0% since first listed4 events — show timeline
- 2025-12-02 Pending — MiRealSource-MiMLS
- 2025-12-02 Pending — REALCOMP
- 2025-11-05 Listed $35,000 REALCOMP
- 2025-11-05 Listed $35,000 MiRealSource-MiMLS
Property tax history
+0.8%/yrLatest (2025): $1,651 · -44.7% YoY. Source: county tax records.
Cash-flow waterfall
monthlySold comps — $/sqft
last 12 mo · ≤1 miLoading sold comps…