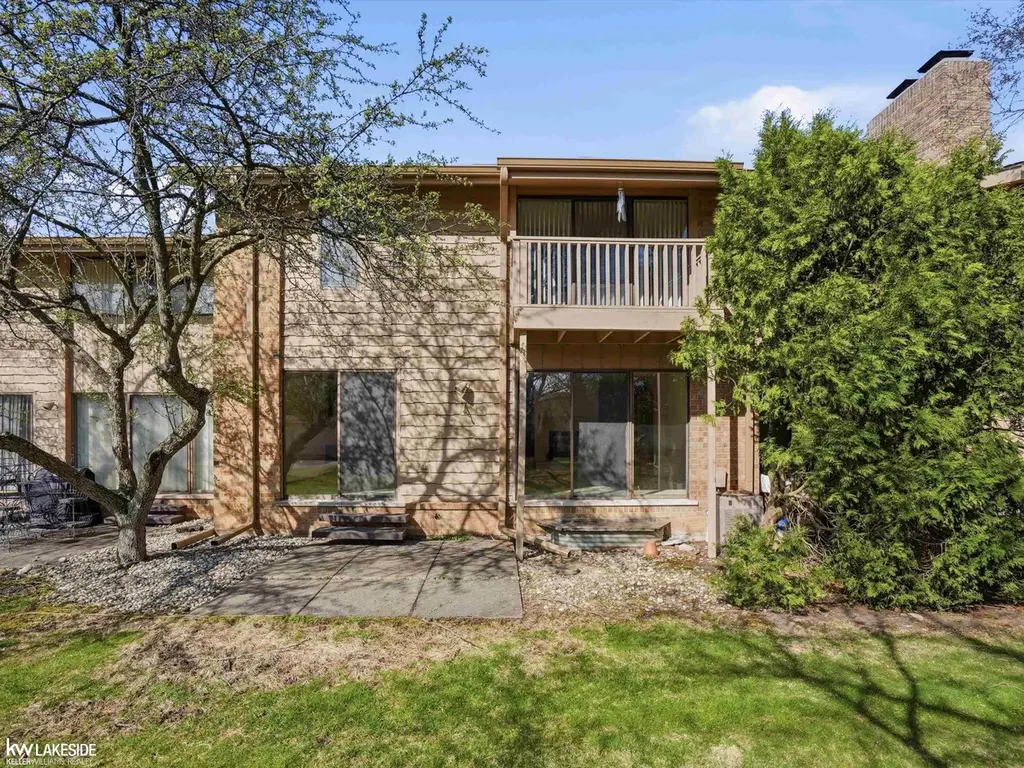
7134 Bridge Way · Farmington Hills, MI
Flood risk 6/10 · Moderate
- FEMA flood zone
- X (unshaded)
- Chance of flooding over 30 yrs
- 0.72%
- Est. flood insurance / yr
- $473 – $860
Fire risk 1/10 · Minimal
- Est. fire insurance / yr
- $784 – $1,456
Heat risk 2/10 · Minimal
- Hot days now (above 96°F)
- 7 days/yr
- Hot days in 30 yrs
- 15 days/yr
Wind risk 2/10 · Minimal
- Chance of severe wind over 30 yrs
- —
Air-quality risk 3/10 · Minor
- Unhealthy air days now
- 2 days/yr
- Unhealthy air days in 30 yrs
- 4 days/yr
Risk factors via First Street. Map © Google.
Why this score? — see what drove the D grade
The composite is a weighted blend of 9 inputs, each scored 0–100. Each bar is that input's sub-score; the figure is the points it added to the 100-point composite (weight × sub-score).
- ARV discount +10.3/15.0
- Cash flow +9.7/30.0
- Schools +4.5/10.0
- 1% rule +4.4/10.0
- Livability +4.0/5.0
- DSCR +2.7/10.0
- Condition / age +2.5/5.0
- Rent growth +2.4/5.0
- Appreciation +0.0/10.0
$295,000
🖨 Deal sheet 📄 Offer letter ✓ Due diligence
Listing remarks MLS
* * * OPEN HOUSE Saturday, 4/25, 10a-12pm * * * Spacious condo in desirable West Bloomfield Township offering 2,285 sq ft of comfortable living. This 3-bedroom, 2.5-bath home features a large primary suite with private bath, an updated kitchen with granite countertops, and a warm, inviting living area with gas fireplace. Unfinished basement offers great potential for additional living space or storage. Enjoy the best of West Bloomfield living with nearby lakes, parks, dining, and shopping just minutes away.
Key facts
- Unfinished basement
- Gas fireplace
- Nearby parks
Tags
Neighborhood map
What this means for you Summary
Snapshot
- This is a 3-bed/2.5-bath condo listed at $295k.
Deal economics
- At list price, monthly cash flow is $-196 ($-2k/yr) — negative.
- To cash-flow at today's rent, offer at most $260k (11.7% below list).
- To meet the 1% rule (rent ≥ 1% of price), the offer needs to be $277k (6.0% below list).
- Recommended offer: $260k (11.7% below list) — sets the bar for cash-flow.
- Cap rate 5.5% vs local median 3.5% in Farmington Hills — top-decile yield for the area; either an underpriced asset or a hidden risk that comps aren't pricing in. Stress-test before assuming the spread holds.
Location & tenants
- Location reads 81/100 on livability (#64 in MI, #1,364 nationally) — a professional / high-income tenant draw. Strengths: employment A+, housing A+, crime A; Watch: amenities D, health & safety F.
- West Bloomfield School District (suburban): math 42% / reading 55% proficiency, ranked #83 of 540 in MI (top 15%) — families likely to look elsewhere, expect single-tenant / working-renter base with shorter leases.
- Market conditions: Rents soft (-0.4%/yr); 181 active listings in the ZIP; 7 comparable units currently listed for rent nearby; rentals leasing fast (median 10d on market — plan ~1-2 weeks tenant-placement turnaround); high-income renter base; 2,614 units permitted in Oakland County in 2024 (721 in 5+ unit buildings).
Forward outlook
- Local home prices are declining (-3.0%/yr); year-one equity from $2k of loan paydown is wiped out by about $9k of value loss. Plan a longer hold.
- Oakland County population projected at +10% by 2050 — modest demand growth; plan on rents tracking national, not racing it.
Negotiation context
- It's been on market 15 days — a 2% lower offer ($291k) is reasonable based on typical stale-listing flexibility.
- 8 sale attempts since 13y ago with the ask held roughly flat each time — persistent listings suggest the price (not the market) is what's stuck; bring a comps-based counter.
- Current owner paid $207k; 43% above their basis — modest negotiation headroom, anchor on the comps not their cost.
Risks & watch-outs
- Watch-outs: HOA is 21% of rent.
- Climate carrying-cost: major flood risk — expect insurance premiums to compound above CPI over the hold.
Questions for the listing agent
- What do current leases actually rent for vs. the listed asking? Can we see a recent rent roll and the last 12 months of T-12 income?
- Built in 1974 — when were the roof, HVAC, electrical panel, plumbing, and water heater last replaced?
- What does the HOA fee cover, when was the last increase, and are there any pending special assessments or reserve-fund shortfalls?
- Any open or pending special assessments — roof, HVAC, plumbing, elevator, façade? What's the per-unit balance and payoff schedule, and is the seller paying it off at close or rolling it to the buyer?
- Is there a deadline driving the sale (1031 exchange, divorce, estate, relocation)? That informs how much negotiation room exists.
- Schools are B-rated — typically a magnet for longer-tenancy family renters. What's the average tenant stay here, and is there a school-zone premium baked into asking?
- The area grade is low — what's the realistic commute time and amenity access for the typical tenant pool here? Any planned neighborhood developments (good or bad) we should know about?
- What's the average days-on-market for RENTAL listings here right now (not sales)? A rising rental-DOM trend means longer vacancies and softer asking-rent achievability than the comps imply.
- What's the recent tenant-quality profile in this submarket — average credit score on applications, eviction rate, late-payment / NSF rate, and stable-employment percentage? A property-management company in the area should have these aggregated.
- How much new apartment / multifamily construction is in the pipeline within 1–3 miles? Heavy new supply (>2% of stock underway) typically softens rents 12–24 months out; light construction supports rent growth.
Investment metrics
- 1% rule
- 0.94% ✗
- Cap rate
- 5.50%
- Cash-on-cash
- -2.85%
- DSCR
- 0.87
- GRM
- 8.9
CMA / ARV
- ARV (median comp)
- $314,214
- List price
- $295,000
- Delta
- -6.11%
- Verdict
- FAIR
- Comps
- 20 within 1.0 mi
Projected returns pro-forma
-3.0% appreciation · 0.0% rent growth · sell at horizon
- IRR
- -25.0%
- Equity multiple
- 0.17×
- Total profit
- $-68,149
- Equity at exit
- $43,985
- IRR
- -37.2%
- Equity multiple
- -0.28×
- Total profit
- $-105,779
- Equity at exit
- $25,506
Cash invested: $82,600 (down + closing). Projections, not guarantees.
Landlord ↔ Tenant lean methodology
- Overall (STATE)
- 62 Landlord-Friendly
- State Michigan
- 62 Landlord-Friendly · EVEN
- County
- — inherits STATE
- City
- — inherits STATE
ZIP-level market 48322
- Rents YoY
- -0.4%
- Active inventory
- 181
- Price-to-rent
- 8.9×
Monthly cashflow live
- Estimated rent
- $2,774 high interval (Pro) →
- Mortgage (P&I)
- −$1,547
- Tax from tax record
- −$145 /mo · $1,742/yr
- Insurance
- −$123
- HOA
- −$572
- Vacancy / Maint / Mgmt
- −$582
- Net cashflow
- $-196
Break-even live
UW: 25.0% down · 7.5% · 30yr · 1.5% tax · 5.0% vac · 8.0% maint · 8.0% mgmt
Financing live
Cash to close
- Down payment
- $73,750
- Closing costs
- $8,850
- Reserves months
- —
- Total cash needed
- —
Loan-product check · same deal, 3 products live
Conventional
25% down · 7.5% · 30yr
- Down + closing
- —
- Monthly P&I
- —
- Monthly cashflow
- —
- DSCR
- —
- Eligible?
- —
Personal DTI + credit; lowest rate.
DSCR
20% down · 8.5% · 30yr
- Down + closing
- —
- Monthly P&I
- —
- Monthly cashflow
- —
- DSCR
- —
- Eligible?
- —
No personal income docs; deal must DSCR.
Hard money
10% down · 12.0% · 12mo
- Down + closing
- —
- Monthly P&I
- —
- Monthly cashflow
- —
- DSCR
- —
- Eligible?
- —
Short-term bridge; refi at stabilization.
Rent comps 7 comps
| Address | Beds | Baths | Sqft | Rent | $/sqft | DOM | Units | Dist |
|---|---|---|---|---|---|---|---|---|
| 31200 Hunters Dr Farmington Hills, MI | 1.0–3.0 | 1.0–2.5 | 1520 | $2,363 | $1.55 | 1d | 15 | 0.53mi |
| 7020 Orchard Lake Rd West Bloomfield, MI | 1.0–3.0 | 1.0–2.5 | 1298 | $6,335 | $4.88 | 1d | 25 | 0.58mi |
| 6322 Aspen Ridge Blvd West Bloomfield, MI | 2.0 | 2.5 | 2391 | $3,500 | $1.46 | 1d | 1 | 1.09mi |
| 5202 Richard Run West Bloomfield, MI | 3.0 | 2.5 | 1650 | $2,500 | $1.52 | 16d | 1 | 1.15mi |
| 6628 Heather Heath West Bloomfield, MI | 4.0 | 2.5 | 2604 | $3,000 | $1.15 | 10d | 1 | 1.23mi |
| 5353 Wright Way W West Bloomfield, MI | 4.0 | 2.5 | 1819 | $2,700 | $1.48 | 24d | 1 | 1.29mi |
| 29095 Oak Point Dr Farmington Hills, MI | 4.0 | 3.5 | 3140 | $3,000 | $0.96 | 10d | 1 | 1.42mi |
HOA detail condo
- Monthly dues
- $572 · $6,864/yr
- Likely covers
- gas
- Assessments
- None detected in remarks — confirm with the listing agent.
Listing history 18 events
-
2026-05-02status Pending 516-char remark
Show marketing remark (516 chars)
* * * OPEN HOUSE Saturday, 4/25, 10a-12pm * * * Spacious condo in desirable West Bloomfield Township offering 2,285 sq ft of comfortable living. This 3-bedroom, 2.5-bath home features a large primary suite with private bath, an updated kitchen with granite countertops, and a warm, inviting living area with gas fireplace. Unfinished basement offers great potential for additional living space or storage. Enjoy the best of West Bloomfield living with nearby lakes, parks, dining, and shopping just minutes away.
-
2026-04-17$295,000 Active 516-char remark
Show marketing remark (516 chars)
* * * OPEN HOUSE Saturday, 4/25, 10a-12pm * * * Spacious condo in desirable West Bloomfield Township offering 2,285 sq ft of comfortable living. This 3-bedroom, 2.5-bath home features a large primary suite with private bath, an updated kitchen with granite countertops, and a warm, inviting living area with gas fireplace. Unfinished basement offers great potential for additional living space or storage. Enjoy the best of West Bloomfield living with nearby lakes, parks, dining, and shopping just minutes away.
-
2026-03-31historical
-
2026-03-31historical
-
2026-03-02$315,000 Active
-
2026-03-02$315,000 Active
-
2026-02-28price $315,000
-
2026-02-27price $315,000
-
2025-10-20historical
-
2025-10-06$325,000 Active
-
2025-10-06$325,000 Active
-
2014-02-23historical
-
2014-02-23historical
-
2013-11-14$199,900
-
2013-11-14$199,900
-
2003-06-11soldstatus $207,000
ⓘ Source: listings_history table (triggers on properties + properties_extension) + one-shot
backfill from property_details.listing_events for pre-trigger history.
Tax reassessment forecast MI · Partial reset (capped growth)
- Current annual tax
- $1,742 · $145/mo
- Projected year-2 tax
- $3,142 · $262/mo
- Expected delta
- +$1,401/yr (+$117/mo · 80.4%)
ⓘ Screening estimate from a state-policy table — verify with the county assessor before closing.
Climate risk First Street
- Flood 6/10 Major FEMA zone X (unshaded) · 72% chance over 30 yrs
- Wildfire 1/10 Low
- Heat 2/10 Low 7 d/yr ≥96°F today · 15 d/yr by 30 yrs out
- Wind 2/10 Low
- Air quality 3/10 Moderate 2 unhealthy d/yr today · 4 by 30 yrs out
Nearby sold comps map
Loading sold comps map…
Walkable amenities ~0.75 mi
Loading nearby amenities…
Taxation est. · year 1
- Rental income
- $33,284
- − Mortgage interest
- −$16,525
- − Property taxes
- −$1,742
- − Insurance
- −$1,475
- − Repairs & maintenance
- −$2,663
- − Management
- −$2,663
- − HOA
- −$6,864
- − Depreciation
- −$8,582
- Taxable loss
- −$7,228
- Est. tax savings @ 24.0%
- +$1,735
- After-tax cash flow
- $-615/yr
For passive investors: Depreciation is non-cash, so a rental often shows a tax loss while cash-flowing — sheltering income. Rental losses are passive: they offset passive income freely, and up to $25,000/yr can offset ordinary (W-2) income if you actively participate and your MAGI is under $100k (phasing out to $0 by $150k); unused losses carry forward. On sale, claimed depreciation is recaptured at up to 25%, and gains may owe capital-gains tax (a 1031 exchange can defer both). Figures are a year-1 estimate at your 24.0% rate — not tax advice; consult a CPA.
Schools (NCES district)
- District
- West Bloomfield School District
- NCES district ID
- 2635820
- Math proficiency
- 42% ▼ -6.00%
- Reading proficiency
- 55% ▼ -2.00%
- Median HH income
- $89,668
- Composite
- 45.28/100
- National rank
- #2653
- State rank
- #83 of 540 in MI
Livability — Farmington Hills
- Score
- 81/100
- State rank
- #64
- US rank
- #1364
Category grades
Schools grade is shown separately in the Schools card above.
Census & demographics
- County
- Oakland County · 1,009,092 people
- City population
- 67,612
- Metro
- Detroit-Warren-Dearborn, MI
- Population (ZIP)
- 32,885
- Household income
- $113,865
- Rent vs Own
- Severe rent burden
- 911.0
Population outlook (Oakland County) Hauer SSP2
- Today (2025)
- 1,335,747 people
- By 2030
- 1,375,100 · +2.9%
- By 2040
- 1,435,385 · +7.5%
- By 2050
- 1,469,250 · +10.0%
- By 2075
- 1,531,946 · +14.7%
- By 2100
- 1,450,485 · +8.6%
Race, ethnicity, and origin ACS 2023
- Neighborhood character
- Majority White (64%)
- Race & ethnicity
- White 64% Black 20% Asian 10% Two or more races 5% Hispanic / Latino 3%
- Common ancestry
- Arab 9% Romanian 5% Scotch-Irish 4%
- Foreign-born
- 25% · Canada, China
- Languages at home
- 71% English-only · Arabic 8% Other Indo-European 5% Other Asian/Pacific 3%
Political lean MEDSL · Oakland
- 2024 margin
- D (+10.6) · D 54.4% · R 43.8% · Other 1.9%
- 2008→2024 swing
- -3.9pp toward R · 2008: 14.5pp · 2024: 10.6pp
- All cycles
- 2024: D+10.6 2020: D+14.1 2016: D+8.1 2012: D+8.1 2008: D+14.5
Not yet ingested
- Civics
- —
Market trends
- HPI YoY
- ▼ -220.52%
- Current HPI
- 149.0523
- Rent YoY
- ▼ -0.43%
- Metro
- Detroit-Warren-Dearborn, MI
- State GDP YoY
- ▲ 1.37%
- F500 in state
- 28
Industry mix (Fortune 500 HQ in MI)
| Industry | F500 HQs | Revenue |
|---|---|---|
| Automotive Parts | 3 | $48B |
|
||
| Automotive | 2 | $372B |
|
||
| Chemicals | 1 | $45B |
|
||
| Automotive Retail | 1 | $29B |
|
||
| Healthcare / Medical Devices | 1 | $23B |
|
||
| Automotive Technology | 1 | $20B |
|
||
Price history
+42.5% since first listed18 events — show timeline
- 2026-05-02 Pending — REALCOMP
- 2026-05-02 Pending — MiRealSource-MiMLS
- 2026-04-17 Listed $295,000 MiRealSource-MiMLS
- 2026-04-17 Listed $295,000 REALCOMP
- 2026-03-31 Listing Removed — MiRealSource-MiMLS
- 2026-03-31 Listing Removed — REALCOMP
- 2026-03-02 Listed $315,000 REALCOMP
- 2026-03-02 Listed $315,000 MiRealSource-MiMLS
- 2026-02-28 Price Changed $315,000 MiRealSource-MiMLS
- 2026-02-27 Price Changed $315,000 REALCOMP
- 2025-10-20 Listing Removed — MiRealSource-MiMLS
- 2025-10-06 Listed $325,000 REALCOMP
- 2025-10-06 Listed $325,000 MiRealSource-MiMLS
- 2014-02-23 Listing Removed — REALCOMP
- 2014-02-23 Listing Removed — MiRealSource-MiMLS
- 2013-11-14 Listed $199,900 REALCOMP
- 2013-11-14 Listed $199,900 MiRealSource-MiMLS
- 2003-06-11 Sold (Public Records) $207,000 Public Records
Property tax history
-2.9%/yrLatest (2025): $1,742 · -36.2% YoY. Source: county tax records.
Cash-flow waterfall
monthlySold comps — $/sqft
last 12 mo · ≤1 miLoading sold comps…