 Duplex
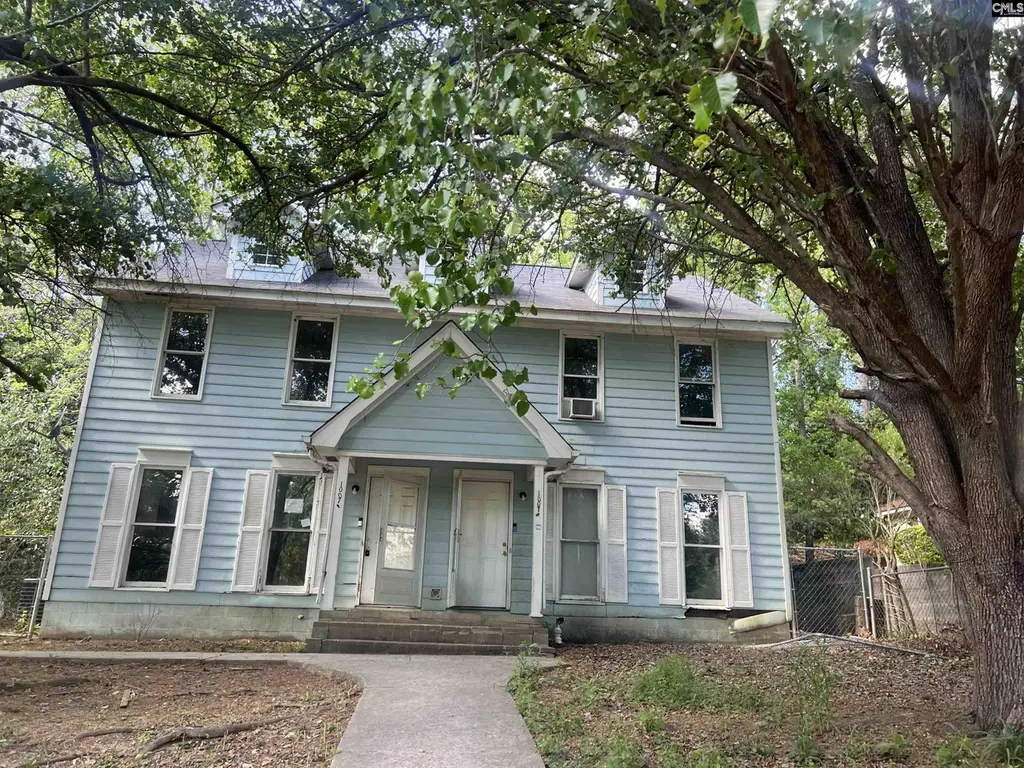
1007 Lynn St · St. Andrews, SC
Flood risk 1/10 · Minimal
- FEMA flood zone
- X (unshaded)
- Chance of flooding over 30 yrs
- 0.0%
- Est. flood insurance / yr
- $507 – $1,088
Fire risk 1/10 · Minimal
- Est. fire insurance / yr
- $783 – $1,453
Heat risk 7/10 · Major
- Hot days now (above 108°F)
- 7 days/yr
- Hot days in 30 yrs
- 16 days/yr
Wind risk 6/10 · Moderate
- Chance of severe wind over 30 yrs
- 65.0%
Air-quality risk 3/10 · Minor
- Unhealthy air days now
- 2 days/yr
- Unhealthy air days in 30 yrs
- 2 days/yr
Risk factors via First Street. Map © Google.
Why this score? — see what drove the B- grade
The composite is a weighted blend of 9 inputs, each scored 0–100. Each bar is that input's sub-score; the figure is the points it added to the 100-point composite (weight × sub-score).
- Cash flow +30.0/30.0
- 1% rule +10.0/10.0
- DSCR +10.0/10.0
- ARV discount +7.5/15.0
- Rent growth +3.8/5.0
- Schools +2.6/10.0
- Livability +2.5/5.0
- Condition / age +2.5/5.0
- Appreciation +0.0/10.0
$79,000
🖨 Deal sheet 📄 Offer letter ✓ Due diligence
Multi-family units
County records classify this as Multi-Family (2-4 Unit). Listing-text estimate: 2 units. confirmed
Listing remarks
Investor special! Duplex property offering two units, each featuring 2 bedrooms and 2.5 bathrooms with approximately 1,140 square feet per unit (2,280 total square feet). Built in 1983 with wood fiber construction, this property is in need of repairs and is being sold as-is. Ideal opportunity for experienced investors or contractors looking for a renovation project with income potential. Each unit offers a functional layout with strong upside once restored. Some visible discoloration was cut/removed. Some may still be present in or out of sight. No formal remediation was done. No before/after professional reports are in hand. Buyer to conduct due diligence. Disclaimer: CMLS has not reviewe
Key facts
- 0.32 acre lot
- 2 parking spots
- Built 1983
Property features AI
Finance
- Other: No pest control reported
Exterior
- Parking: Off-street parking for 2 vehicles
- Utilities: Public sewer; Electricity paid by owner; Sewer paid by owner; Water service provided by public system (owner pays)
- Home design: 2-story property; Two total residential units
- Construction: Slab foundation
- Exterior features: Wood Fiber‑Masonite exterior finish; Paved road access; Public water
Interior
- Bedrooms: Each unit has 2 bedrooms
- Bathrooms: Each unit has 2 full bathrooms and 1 half bathroom
- Heating & cooling: Central cooling; Heating described as 'Other' (see remarks); Owner pays heating
- Interior features: Total heated area 2,280; Seven rooms in each unit
Neighborhood map
What this means for you Summary
Snapshot
- This is a 2 × 2.0-bed/2.5-bath units multifamily listed at $79k.
Deal economics
- At list price, monthly cash flow is $1k ($17k/yr) — positive. Per door: $713/mo.
- The deal already cash-flows at list — no discount required.
- Meets the 1% rule at list price ($2k rent vs $79k).
Location & tenants
- Location reads: area grade B — affects rentability + tenant quality, not the cash-flow math above.
- Richland 01 (urban): math 26% / reading 36% proficiency, ranked #54 of 80 in SC (top 68%) — families likely to look elsewhere, expect single-tenant / working-renter base with shorter leases; 64% free/reduced lunch — lower-income household profile, screen leases tightly.
- Zoned schools: Pine Grove Elementary (math 24% / reading 15%, grade F, #496 of 597 statewide, top 83%, 541 students, 100% FRL); Columbia High (math 17% / reading 67%, grade F, #174 of 196 statewide, top 90%, 665 students, 100% FRL) — zoned schools average 100% FRL vs 64% district-wide (36 pts higher); higher-poverty schools than district average — tighter screening recommended.
- Market conditions: Rents rising fast (+5.0%/yr); 145 active listings in the ZIP; 3,472 units permitted in Richland County in 2024 (1,096 in 5+ unit buildings).
- At $2,497/mo this rent would consume 59% of the median local household income ($51k/yr) (locally 2859% of renters already pay >50% of income on rent) — very limited rent-growth headroom before tenants either downsize or default.
Forward outlook
- Local home prices are declining (-3.0%/yr); year-one equity from $546 of loan paydown is wiped out by about $2k of value loss. Plan a longer hold.
- Richland County population projected at +30% by 2050 — long-run rental-demand tailwind backs the buy-and-hold thesis.
- At projected returns (-3.0% appreciation + 5.0% rent growth), your $22k cash investment doubles in ~2 years — after that, you're playing with house money.
Negotiation context
- Only 6 days on market — expect competitive offers; lowballing is unlikely to land.
Risks & watch-outs
- Climate carrying-cost: major wind risk, 65% chance of damaging wind over 30y; extreme-heat days projected 7→16/yr by 2055 (HVAC capex compounding) — expect insurance premiums to compound above CPI over the hold.
Questions for the listing agent
- Can we see the unit-by-unit rent roll, current vacancy, and any below-market leases? What's the average tenancy length?
- What capital expenditures (roof, boiler, parking lot, exteriors) have been made in the last 5 years, and what's planned in the next 2?
- Is there a deadline driving the sale (1031 exchange, divorce, estate, relocation)? That informs how much negotiation room exists.
- What's the average days-on-market for RENTAL listings here right now (not sales)? A rising rental-DOM trend means longer vacancies and softer asking-rent achievability than the comps imply.
- What's the recent tenant-quality profile in this submarket — average credit score on applications, eviction rate, late-payment / NSF rate, and stable-employment percentage? A property-management company in the area should have these aggregated.
- How much new apartment / multifamily construction is in the pipeline within 1–3 miles? Heavy new supply (>2% of stock underway) typically softens rents 12–24 months out; light construction supports rent growth.
Investment metrics
- 1% rule
- 3.16% ✓
- Cap rate
- 27.96%
- Cash-on-cash
- 77.40%
- DSCR
- 4.44
- GRM
- 2.6
CMA / ARV
No comps found within radius.
Projected returns pro-forma
-3.0% appreciation · 5.0% rent growth · sell at horizon
- IRR
- 79.7%
- Equity multiple
- 4.76×
- Total profit
- $83,227
- Equity at exit
- $11,779
- IRR
- 83.7%
- Equity multiple
- 10.56×
- Total profit
- $211,538
- Equity at exit
- $6,830
Cash invested: $22,120 (down + closing). Projections, not guarantees.
Landlord ↔ Tenant lean methodology
- Overall (STATE)
- 90 Strongly Landlord-Friendly
- State South Carolina
- 90 Strongly Landlord-Friendly · R+6
- County
- — inherits STATE
- City
- — inherits STATE
ZIP-level market 29210
- Home prices YoY
- -32.2%
- Rents YoY
- 5.0%
- Active inventory
- 145
- Price-to-rent
- 5.3×
Monthly cashflow live
- Estimated rent
- $2,497 high interval (Pro) →
- Mortgage (P&I)
- −$414
- Tax est. 1.5%
- −$99 /mo · $1,185/yr
- Insurance
- −$33
- HOA
- −$0
- Vacancy / Maint / Mgmt
- −$524
- Net cashflow
- $1,427
Break-even live
2-unit breakdown (identical units grouped — click to expand)
| Units | Beds | Baths | Est. rent |
|---|---|---|---|
| 2× units | 2.0 | 2.5 | $2,496 |
| #1 | 2.0 | 2.5 | $1,248 |
| #2 | 2.0 | 2.5 | $1,248 |
| Total (2 units) | $2,497 | ||
UW: 25.0% down · 7.5% · 30yr · 1.5% tax · 5.0% vac · 8.0% maint · 8.0% mgmt
Financing live
Cash to close
- Down payment
- $19,750
- Closing costs
- $2,370
- Reserves months
- —
- Total cash needed
- —
Loan-product check · same deal, 3 products live
Conventional
25% down · 7.5% · 30yr
- Down + closing
- —
- Monthly P&I
- —
- Monthly cashflow
- —
- DSCR
- —
- Eligible?
- —
Personal DTI + credit; lowest rate.
DSCR
20% down · 8.5% · 30yr
- Down + closing
- —
- Monthly P&I
- —
- Monthly cashflow
- —
- DSCR
- —
- Eligible?
- —
No personal income docs; deal must DSCR.
Hard money
10% down · 12.0% · 12mo
- Down + closing
- —
- Monthly P&I
- —
- Monthly cashflow
- —
- DSCR
- —
- Eligible?
- —
Short-term bridge; refi at stabilization.
Listing history 7 events
-
2026-05-06status Pending
-
2026-04-29status Pending
-
2026-04-22$79,000 Active
-
2019-01-10soldstatus $144,000
-
2007-10-17soldstatus $125,690
-
2005-04-08soldstatus $110,000
-
1992-12-18soldstatus $88,000
ⓘ Source: listings_history table (triggers on properties + properties_extension) + one-shot
backfill from property_details.listing_events for pre-trigger history.
Climate risk First Street
- Flood 1/10 Low FEMA zone X (unshaded) · 0% chance over 30 yrs
- Wildfire 1/10 Low
- Heat 7/10 Severe 7 d/yr ≥108°F today · 16 d/yr by 30 yrs out
- Wind 6/10 Major 65% chance of damaging wind over 30 yrs
- Air quality 3/10 Moderate 2 unhealthy d/yr today · 2 by 30 yrs out
Nearby sold comps map
Loading sold comps map…
Walkable amenities ~0.75 mi
Loading nearby amenities…
Taxation est. · year 1
- Rental income
- $29,964
- − Mortgage interest
- −$4,425
- − Property taxes
- −$1,185
- − Insurance
- −$395
- − Repairs & maintenance
- −$2,397
- − Management
- −$2,397
- − Depreciation
- −$2,298
- Taxable income
- $16,866
- Est. tax owed @ 24.0%
- −$4,048
- After-tax cash flow
- $13,072/yr
For passive investors: Depreciation is non-cash, so a rental often shows a tax loss while cash-flowing — sheltering income. Rental losses are passive: they offset passive income freely, and up to $25,000/yr can offset ordinary (W-2) income if you actively participate and your MAGI is under $100k (phasing out to $0 by $150k); unused losses carry forward. On sale, claimed depreciation is recaptured at up to 25%, and gains may owe capital-gains tax (a 1031 exchange can defer both). Figures are a year-1 estimate at your 24.0% rate — not tax advice; consult a CPA.
Schools (NCES district)
- District
- Richland 01
- NCES district ID
- 4503360
- Math proficiency
- 26% ▼ -7.00%
- Reading proficiency
- 36% ▼ -5.00%
- Median HH income
- $38,931
- Composite
- 25.94/100
- National rank
- #7335
- State rank
- #54 of 80 in SC
Livability — St. Andrews
No livability data for this city. (Only ~50 U.S. cities are tracked.)
Census & demographics
- Census place
- St. Andrews, SC
- County
- Richland County · 389,530 people
- City population
- 40,504
- Metro
- Columbia, SC
- Population (ZIP)
- 39,962
- Household income
- $50,871
- Rent vs Own
- Severe rent burden
- 2859.0
Population outlook (Richland County) Hauer SSP2
- Today (2025)
- 459,667 people
- By 2030
- 487,524 · +6.1%
- By 2040
- 542,035 · +17.9%
- By 2050
- 595,371 · +29.5%
- By 2075
- 732,998 · +59.5%
- By 2100
- 820,415 · +78.5%
Race, ethnicity, and origin ACS 2023
- Neighborhood character
- Diverse neighborhood (Simpson 0.58)
- Race & ethnicity
- Black 55% White 34% Two or more races 6% Hispanic / Latino 4% Asian 2%
- Common ancestry
- Arab 2% Lithuanian 2% Slovak 1%
- Foreign-born
- 7% · Canada
- Languages at home
- 91% English-only · Spanish 3%
Political lean MEDSL · Richland
- 2024 margin
- Solid D (+34.6) · D 66.4% · R 31.8% · Other 1.8%
- 2008→2024 swing
- +5.7pp toward D · 2008: 28.9pp · 2024: 34.6pp
- All cycles
- 2024: D+34.6 2020: D+38.3 2016: D+32.9 2012: D+33.3 2008: D+28.9
Not yet ingested
- Civics
- —
Market trends
- HPI YoY
- ▼ -107.61%
- Current HPI
- 226.2564
- Rent YoY
- ▲ 5.00%
- Metro
- Columbia, SC
- State GDP YoY
- ▲ 4.51%
- F500 in state
- 2
Industry mix (Fortune 500 HQ in SC)
| Industry | F500 HQs | Revenue |
|---|---|---|
| Packaging | 1 | $7B |
|
||
Price history
-10.2% since first listed7 events — show timeline
- 2026-05-06 Pending — Consolidated MLS
- 2026-04-29 Pending — Consolidated MLS
- 2026-04-22 Listed $79,000 Consolidated MLS
- 2019-01-10 Sold (Public Records) $144,000 Public Records
- 2007-10-17 Sold (Public Records) $125,690 Public Records
- 2005-04-08 Sold (Public Records) $110,000 Public Records
- 1992-12-18 Sold (Public Records) $88,000 Public Records
Property tax history
+2.9%/yrLatest (2025): $5,096 · +2.6% YoY. Source: county tax records.
Cash-flow waterfall
monthlySold comps — $/sqft
last 12 mo · ≤1 miLoading sold comps…