 Duplex
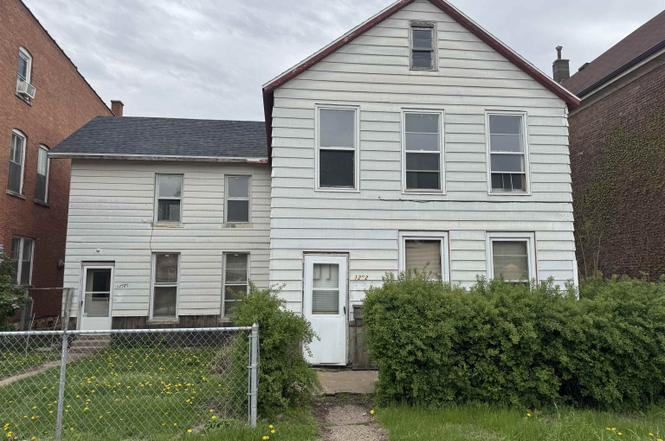
1252 White St · Dubuque, IA
Flood risk 1/10 · Minimal
- FEMA flood zone
- X (unshaded)
- Chance of flooding over 30 yrs
- 0.0%
- Est. flood insurance / yr
- $473 – $860
Fire risk 1/10 · Minimal
- Est. fire insurance / yr
- $902 – $1,676
Heat risk 3/10 · Minor
- Hot days now (above 102°F)
- 7 days/yr
- Hot days in 30 yrs
- 15 days/yr
Wind risk 2/10 · Minimal
- Chance of severe wind over 30 yrs
- —
Air-quality risk 2/10 · Minimal
- Unhealthy air days now
- 1 days/yr
- Unhealthy air days in 30 yrs
- 2 days/yr
Risk factors via First Street. Map © Google.
Why this score? — see what drove the A- grade
The composite is a weighted blend of 9 inputs, each scored 0–100. Each bar is that input's sub-score; the figure is the points it added to the 100-point composite (weight × sub-score).
- Cash flow +30.0/30.0
- ARV discount +15.0/15.0
- 1% rule +10.0/10.0
- DSCR +10.0/10.0
- Schools +5.5/10.0
- Livability +4.5/5.0
- Rent growth +3.9/5.0
- Condition / age +2.5/5.0
- Appreciation +0.0/10.0
$119,000
🖨 Deal sheet 📄 Offer letter ✓ Due diligence
Multi-family units
County records classify this as Multi-Family (2-4 Unit). Listing-text estimate: 2 units. confirmed
Listing remarks
Investor Alert! 1252 White St is a fully rented duplex offering immediate cash flow with plenty of value add opportunity just a block away from Dubuque’s vibrant Millwork District. The upper unit features 2 bedrooms, 1 bath, deck, and has been recently updated with fresh paint, new light fixtures, new bathroom flooring, and a newer stove/oven. The lower unit is a 1 bed, 1 bath with solid rental history. Value-add potential remains, and major improvements are already done—including a new roof in 2023. Great opportunity to own a cash-flowing property in a prime location! Seller is a licensed Realtor in IA.
Key facts
- Fully rented duplex
- Recently updated
- New roof
Tags
Property features AI
Finance
- Financial info: Unit rents listed: 1-bedroom unit currently $500, 2-bedroom unit currently $925
Exterior
- Parking: Detached off-street parking for 2 vehicles
- Home design: Duplex (residential income); Two stories
- Construction: Stone foundation; Shingle roof
- Exterior features: Shingle roof; Stone foundation; Lot zoned R
Interior
- Kitchen: Kitchen appliances include refrigerator and range
- Bedrooms: One 1-bedroom unit; One 2-bedroom unit
- Bathrooms: Two 1-bath units (each unit has 1 bathroom)
- Heating & cooling: Forced air heating (natural gas); Window unit cooling
- Interior features: Refrigerator; Range; Window air conditioning units; Forced air heating (natural gas); Partial basement
Neighborhood map
What this means for you Summary
Snapshot
- This is a 2 × 3-bed/1.5-bath units multifamily listed at $119k.
Deal economics
- At list price, monthly cash flow is $1k ($14k/yr) — positive. Per door: $599/mo.
- The deal already cash-flows at list — no discount required.
- Meets the 1% rule at list price ($2k rent vs $119k).
- Cap rate 18.4% vs local median 3.5% in Dubuque — top-decile yield for the area; either an underpriced asset or a hidden risk that comps aren't pricing in. Stress-test before assuming the spread holds.
Location & tenants
- Location reads 89/100 on livability (#7 in IA, #119 nationally) — a professional / high-income tenant draw. Strengths: amenities A+, commute A+, cost of living A+; Watch: crime C-.
- Dubuque Community School District (urban): math 63% / reading 65% proficiency, ranked #205 of 289 in IA (top 71%) — acceptable for families but not a draw, mixed tenant base, ~2y average lease.
- Zoned schools: Prescott Elementary School (math 27% / reading 27%, grade F, #607 of 616 statewide, top 99%, 370 students, 76% FRL); Dubuque Senior High School (math 63% / reading 74%, grade B, #181 of 336 statewide, top 54%, 1,435 students, 36% FRL) — zoned schools average 56% FRL vs 32% district-wide (25 pts higher); higher-poverty schools than district average — tighter screening recommended.
- Zoned-school proficiency averages 48% at this address vs 64% district-wide (-16 pts) — the specific schools serving this property underperform the Dubuque Community School District average; the district grade overstates school quality for this exact location.
- Market conditions: Rents rising fast (+5.6%/yr); 225 active listings in the ZIP; 3 comparable units currently listed for rent nearby; rentals lingering (median 44d on market — plan ~5-8 weeks vacancy on turnover, expect pricing pressure); 100% of comp listings sitting > 30 days — soft ceiling on asking rent; 473 units permitted in Dubuque County in 2024 (319 in 5+ unit buildings).
- At $2,450/mo this rent would consume 48% of the median local household income ($62k/yr) (locally 1940% of renters already pay >50% of income on rent) — very limited rent-growth headroom before tenants either downsize or default.
Forward outlook
- Local home prices are declining (-3.0%/yr); year-one equity from $823 of loan paydown is wiped out by about $4k of value loss. Plan a longer hold.
- Dubuque County population projected at +13% by 2050 — modest demand growth; plan on rents tracking national, not racing it.
- At projected returns (-3.0% appreciation + 5.6% rent growth), your $33k cash investment doubles in ~3 years — after that, you're playing with house money.
Negotiation context
- Only 4 days on market — expect competitive offers; lowballing is unlikely to land.
- 5 sale attempts since 11y ago with the ask held roughly flat each time — persistent listings suggest the price (not the market) is what's stuck; bring a comps-based counter.
- Current owner paid $47k; list at $119k implies a 153% gain — meaningful room to come down on a strong offer.
Risks & watch-outs
- Watch-outs: built in 1900 — expect roof / HVAC / electrical / plumbing capex.
Questions for the listing agent
- Can we see the unit-by-unit rent roll, current vacancy, and any below-market leases? What's the average tenancy length?
- What capital expenditures (roof, boiler, parking lot, exteriors) have been made in the last 5 years, and what's planned in the next 2?
- Built in 1900 — when were the roof, HVAC, electrical panel, plumbing, and water heater last replaced?
- Is there a deadline driving the sale (1031 exchange, divorce, estate, relocation)? That informs how much negotiation room exists.
- Schools are B-rated — typically a magnet for longer-tenancy family renters. What's the average tenant stay here, and is there a school-zone premium baked into asking?
- What's the average days-on-market for RENTAL listings here right now (not sales)? A rising rental-DOM trend means longer vacancies and softer asking-rent achievability than the comps imply.
- What's the recent tenant-quality profile in this submarket — average credit score on applications, eviction rate, late-payment / NSF rate, and stable-employment percentage? A property-management company in the area should have these aggregated.
- How much new apartment / multifamily construction is in the pipeline within 1–3 miles? Heavy new supply (>2% of stock underway) typically softens rents 12–24 months out; light construction supports rent growth.
Investment metrics
- 1% rule
- 2.06% ✓
- Cap rate
- 18.37%
- Cash-on-cash
- 43.13%
- DSCR
- 2.92
- GRM
- 4.0
CMA / ARV
- ARV (on-the-fly)
- $160,160
- Comps found
- 8
Show comp detail 8 sales within ~0.75 mi
| Address | Dist | Beds/Ba | Sqft | Sold | Price | $/sf | Match |
|---|---|---|---|---|---|---|---|
| 623-627 Arlington St | 0.48mi | 4/2.0 (-1) | 1,792 (+2%) | 7mo | $190,000 | $106 | 62 |
| 1805 Madison St | 0.41mi | 4/2.0 (-1) | 1,680 (-4%) | 8mo | $152,500 | $91 | 60 |
| 609-617 Arlington St | 0.47mi | 4/2.0 (-1) | 1,862 (+6%) | 7mo | $210,000 | $113 | 56 |
| 555 W 17th St | 0.54mi | 4/2.0 (-1) | 1,680 (-4%) | 14mo | $75,100 | $45 | 48 |
| 646-652 W 11th St | 0.53mi | 5/2.0 | 1,952 (+11%) | 14mo | $170,000 | $87 | 44 |
| 614 Lincoln Ave | 0.70mi | 4/2.0 (-1) | 1,536 (-13%) | 6mo | $180,000 | $117 | 34 |
| 821 W 8th St | 0.74mi | 4/2.0 (-1) | 1,944 (+10%) | 16mo | $140,000 | $72 | 28 |
| 650 University Ave | 0.56mi | 5/3.0 | 2,016 (+14%) | 24mo | $169,000 | $84 | 28 |
Match score weights: distance 35% · size 25% · config 20% · recency 20%. Top-matched comps best support the ARV.
Projected returns pro-forma
-3.0% appreciation · 5.63% rent growth · sell at horizon
- IRR
- 42.8%
- Equity multiple
- 2.91×
- Total profit
- $63,637
- Equity at exit
- $17,743
- IRR
- 50.0%
- Equity multiple
- 6.47×
- Total profit
- $182,395
- Equity at exit
- $10,289
Cash invested: $33,320 (down + closing). Projections, not guarantees.
Landlord ↔ Tenant lean methodology
- Overall (STATE)
- 83 Strongly Landlord-Friendly
- State Iowa
- 83 Strongly Landlord-Friendly · R+6
- County
- — inherits STATE
- City
- — inherits STATE
ZIP-level market 52001
- Rents YoY
- 5.6%
- Active inventory
- 225
- Price-to-rent
- 8.1×
Monthly cashflow live
- Estimated rent
- $2,450 high interval (Pro) →
- Mortgage (P&I)
- −$624
- Tax from tax record
- −$64 /mo · $770/yr
- Insurance
- −$50
- HOA
- −$0
- Vacancy / Maint / Mgmt
- −$514
- Net cashflow
- $1,198
Break-even live
2-unit breakdown (identical units grouped — click to expand)
| Units | Beds | Baths | Est. rent |
|---|---|---|---|
| 2× units | 3 | 1.5 | $2,450 |
| #1 | 3 | 1.5 | $1,225 |
| #2 | 3 | 1.5 | $1,225 |
| Total (2 units) | $2,450 | ||
UW: 25.0% down · 7.5% · 30yr · 1.5% tax · 5.0% vac · 8.0% maint · 8.0% mgmt
Financing live
Cash to close
- Down payment
- $29,750
- Closing costs
- $3,570
- Reserves months
- —
- Total cash needed
- —
Loan-product check · same deal, 3 products live
Conventional
25% down · 7.5% · 30yr
- Down + closing
- —
- Monthly P&I
- —
- Monthly cashflow
- —
- DSCR
- —
- Eligible?
- —
Personal DTI + credit; lowest rate.
DSCR
20% down · 8.5% · 30yr
- Down + closing
- —
- Monthly P&I
- —
- Monthly cashflow
- —
- DSCR
- —
- Eligible?
- —
No personal income docs; deal must DSCR.
Hard money
10% down · 12.0% · 12mo
- Down + closing
- —
- Monthly P&I
- —
- Monthly cashflow
- —
- DSCR
- —
- Eligible?
- —
Short-term bridge; refi at stabilization.
Rent comps 3 comps
| Address | Beds | Baths | Sqft | Rent | $/sqft | DOM | Units | Dist |
|---|---|---|---|---|---|---|---|---|
| 1199 Central Ave Unit 302 Dubuque, IA | 4.0 | 3.0 | 2339 | $2,850 | $1.22 | 43d | 1 | 0.06mi |
| 597 Jefferson St Rm 3 Dubuque, IA | 5.0 | 2.0 | 1800 | $550 | $0.31 | 43d | 1 | 0.47mi |
| 705 W 3rd St Dubuque, IA | 5.0 | 2.0 | 1300 | $1,400 | $1.08 | 44d | 1 | 0.77mi |
Listing history 5 events
-
2026-06-19days on market $119,000 Active 4 DOM
-
2026-06-18days on market $119,000 Active 3 DOM
-
2026-06-17days on market $119,000 Active 2 DOM
-
2026-06-16remarks 611-char remark
-
2026-06-16$119,000 Active 1 DOM
ⓘ Source: listings_history table (triggers on properties + properties_extension) + one-shot
backfill from property_details.listing_events for pre-trigger history.
Tax reassessment forecast IA · Partial reset (capped growth)
- Current annual tax
- $770 · $64/mo
- Projected year-2 tax
- $1,319 · $110/mo
- Expected delta
- +$549/yr (+$46/mo · 71.3%)
ⓘ Screening estimate from a state-policy table — verify with the county assessor before closing.
Climate risk First Street
- Flood 1/10 Low FEMA zone X (unshaded) · 0% chance over 30 yrs
- Wildfire 1/10 Low
- Heat 3/10 Moderate 7 d/yr ≥102°F today · 15 d/yr by 30 yrs out
- Wind 2/10 Low
- Air quality 2/10 Low 1 unhealthy d/yr today · 2 by 30 yrs out
Nearby sold comps map
Loading sold comps map…
Walkable amenities ~0.75 mi
Loading nearby amenities…
Taxation est. · year 1
- Rental income
- $29,400
- − Mortgage interest
- −$6,666
- − Property taxes
- −$770
- − Insurance
- −$595
- − Repairs & maintenance
- −$2,352
- − Management
- −$2,352
- − Depreciation
- −$3,462
- Taxable income
- $13,203
- Est. tax owed @ 24.0%
- −$3,169
- After-tax cash flow
- $11,204/yr
For passive investors: Depreciation is non-cash, so a rental often shows a tax loss while cash-flowing — sheltering income. Rental losses are passive: they offset passive income freely, and up to $25,000/yr can offset ordinary (W-2) income if you actively participate and your MAGI is under $100k (phasing out to $0 by $150k); unused losses carry forward. On sale, claimed depreciation is recaptured at up to 25%, and gains may owe capital-gains tax (a 1031 exchange can defer both). Figures are a year-1 estimate at your 24.0% rate — not tax advice; consult a CPA.
Schools (NCES district)
- District
- Dubuque Community School District
- NCES district ID
- 1909480
- Math proficiency
- 63% ▼ -7.00%
- Reading proficiency
- 65% ▼ -1.00%
- Median HH income
- $51,237
- Composite
- 54.51/100
- National rank
- #1345
- State rank
- #205 of 289 in IA
Livability — Dubuque
- Score
- 89/100
- State rank
- #7
- US rank
- #119
Category grades
Schools grade is shown separately in the Schools card above.
Census & demographics
- Census place
- Dubuque, IA
- County
- Dubuque County · 60,106 people
- City population
- 60,106
- Metro
- Dubuque, IA
- Population (ZIP)
- 43,101
- Household income
- $61,643
- Rent vs Own
- Severe rent burden
- 1940.0
Population outlook (Dubuque County) Hauer SSP2
- Today (2025)
- 103,359 people
- By 2030
- 106,472 · +3.0%
- By 2040
- 112,043 · +8.4%
- By 2050
- 116,553 · +12.8%
- By 2075
- 128,014 · +23.9%
- By 2100
- 132,892 · +28.6%
Race, ethnicity, and origin ACS 2023
- Neighborhood character
- Predominantly White (84%)
- Race & ethnicity
- White 84% Two or more races 6% Black 5% Hispanic / Latino 4% Asian 1% Pacific Islander 1%
- Common ancestry
- Portuguese 3% Italian 2% Lithuanian 2%
- Foreign-born
- 4% · Canada, China
- Languages at home
- 95% English-only · Spanish 3% Tagalog/Filipino 1% Other Asian/Pacific 1%
Political lean MEDSL · Dubuque
- 2024 margin
- Lean R (+8.6) · D 45.1% · R 53.7% · Other 1.2%
- 2008→2024 swing
- -29.4pp toward R · 2008: 20.8pp · 2024: -8.6pp
- All cycles
- 2024: R+8.6 2020: R+2.9 2016: R+1.2 2012: D+14.5 2008: D+20.8
Not yet ingested
- Civics
- —
Market trends
- HPI YoY
- ▼ -156.36%
- Current HPI
- 173.5536
- Rent YoY
- ▲ 5.63%
- Metro
- Dubuque, IA
- State GDP YoY
- ▲ 2.48%
- F500 in state
- 4
Industry mix (Fortune 500 HQ in IA)
| Industry | F500 HQs | Revenue |
|---|---|---|
| Financial Services | 1 | $16B |
|
||
| Retail / Convenience | 1 | $15B |
|
||
Price history
+94.4% since first listed8 events — show timeline
- 2026-06-12 Listed $119,000 ECIMLS
- 2025-11-03 Listed $129,000 ECIMLS
- 2025-10-06 Price Changed $132,000 ECIMLS
- 2025-06-30 Price Changed $134,900 ECIMLS
- 2025-06-05 Listed $139,900 ECIMLS
- 2022-06-30 Sold (Public Records) $47,000 Public Records
- 2015-08-08 Listed $61,200 ECIMLS
- 2015-08-08 Listed $61,200 ECIMLS
Property tax history
-1.2%/yrLatest (2025): $770 · +3.2% YoY. Source: county tax records.
Cash-flow waterfall
monthlySold comps — $/sqft
last 12 mo · ≤1 miLoading sold comps…