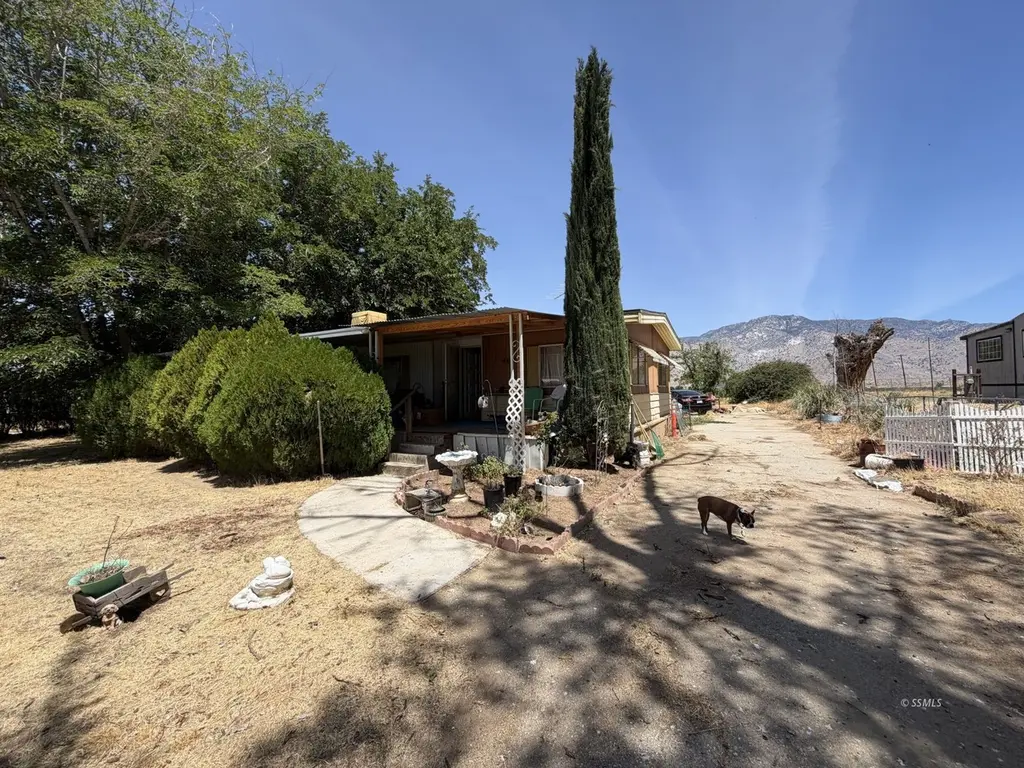
14401 Allen Ave · Weldon, CA
Flood risk 1/10 · Minimal
- FEMA flood zone
- AO
- Chance of flooding over 30 yrs
- 0.0%
- Est. flood insurance / yr
- $848 – $2,087
Fire risk 7/10 · Major
- Est. fire insurance / yr
- $659 – $1,223
Heat risk 7/10 · Major
- Hot days now (above 96°F)
- 7 days/yr
- Hot days in 30 yrs
- 17 days/yr
Wind risk 1/10 · Minimal
- Chance of severe wind over 30 yrs
- —
Air-quality risk 9/10 · Severe
- Unhealthy air days now
- 18 days/yr
- Unhealthy air days in 30 yrs
- 22 days/yr
Risk factors via First Street. Map © Google.
Why this score? — see what drove the A- grade
The composite is a weighted blend of 9 inputs, each scored 0–100. Each bar is that input's sub-score; the figure is the points it added to the 100-point composite (weight × sub-score).
- Cash flow +30.0/30.0
- ARV discount +15.0/15.0
- 1% rule +10.0/10.0
- DSCR +10.0/10.0
- Appreciation +9.3/10.0
- Schools +2.9/10.0
- Rent growth +2.5/5.0
- Condition / age +2.5/5.0
- Livability +2.4/5.0
$89,000
🖨 Deal sheet 📄 Offer letter ✓ Due diligence
Listing remarks
Great Horse property in Valley Estates neighborhood here in the Kern River Valley! This 1,296 sq. ft. garage has a fixer upper 3-bedroom 2 bath, 1,440 sq. ft home that sits on . 69 acres in a cul-de-sac. The home is on a corner lot cul-de-sac with 2 garage doors on one street and the other garage door in the back yard which has two entrance gates, one from the side street and one in front of the house. Cinder block footings around the entire house. Fully fenced great water company and unobstructed mountain views all around. Minutes from the Piute Mountains. Close to Lake Isabella for the fishing derby, Kernville and the MIGHTY Kern River, Trail of 100 GIANTS for the giant redwood trees in t
Key facts
- Fully fenced
- Cul-de-sac
- Two entrance gates
Tags
Property features AI
Exterior
- Parking: Detached garage with 1 parking space
- Utilities: Propane
- Home design: Manufactured home (double-wide, not affixed); Residential property
- Construction: Composition/shingle roof
- Exterior features: Covered patio; Patio; Fenced yard; Workshop; Located on a cul-de-sac; Has a view
Interior
- Kitchen: Electric range; Electric oven
- Flooring: Carpet
- Bathrooms: Two full bathrooms
- Heating & cooling: Forced air heating (natural gas); Evaporative cooling
- Interior features: Electric range and electric oven; Carpet flooring; Crawl space basement
Neighborhood map
What this means for you Summary
Snapshot
- This is a 3-bed/2.0-bath manufactured listed at $89k.
Deal economics
- At list price, monthly cash flow is $321 ($4k/yr) — positive.
- The deal already cash-flows at list — no discount required.
- Meets the 1% rule at list price ($1k rent vs $89k).
- Cap rate 12.3% vs local median 5.0% in Weldon — top-decile yield for the area; either an underpriced asset or a hidden risk that comps aren't pricing in. Stress-test before assuming the spread holds.
Location & tenants
- Location reads 48/100 on livability (#1,218 in CA) — a working-class tenant base; expect higher turnover. Strengths: cost of living A-, housing B+; Watch: schools F, amenities F, commute F.
- South Fork Union (rural): math 25% / reading 40% proficiency, ranked #1,016 of 1,400 in CA (top 73%) — families likely to look elsewhere, expect single-tenant / working-renter base with shorter leases; 67% free/reduced lunch — lower-income household profile, screen leases tightly.
- Market conditions: 41 active listings in the ZIP; 3,244 units permitted in Kern County in 2024 (73 in 5+ unit buildings).
Forward outlook
- In year one you build about $8k of equity ($615 loan paydown + $8k appreciation (8.7% local appreciation)).
- Kern County population projected at +17% by 2050 — long-run rental-demand tailwind backs the buy-and-hold thesis.
- At projected returns (8.7% appreciation + 3.0% rent growth), your $25k cash investment doubles in ~2 years — after that, you're playing with house money.
- By year 5, paydown + projected appreciation supports a ~$38k cash-out refi (75% LTV) — recoverable capital for the next deal without selling this one.
Negotiation context
- Only 10 days on market — expect competitive offers; lowballing is unlikely to land.
- Current owner paid $50k; list at $89k implies a 78% gain — meaningful room to come down on a strong offer.
Risks & watch-outs
- Watch-outs: flood insurance adds $122/mo.
- Climate carrying-cost: in FEMA flood zone AO (mandatory federal flood insurance); major wildfire risk; extreme-heat days projected 7→17/yr by 2055 (HVAC capex compounding) — expect insurance premiums to compound above CPI over the hold.
Questions for the listing agent
- Built in 1974 — when were the roof, HVAC, electrical panel, plumbing, and water heater last replaced?
- What's the actual annual flood-insurance premium (NFIP or private), and is the property in a SFHA with mandatory coverage?
- What does the HOA fee cover, when was the last increase, and are there any pending special assessments or reserve-fund shortfalls?
- Is there a deadline driving the sale (1031 exchange, divorce, estate, relocation)? That informs how much negotiation room exists.
- Schools are F-rated, which usually means shorter tenancies and higher turnover. Who's the typical renter profile here, and what's been the actual vacancy rate?
- What's the average days-on-market for RENTAL listings here right now (not sales)? A rising rental-DOM trend means longer vacancies and softer asking-rent achievability than the comps imply.
- What's the recent tenant-quality profile in this submarket — average credit score on applications, eviction rate, late-payment / NSF rate, and stable-employment percentage? A property-management company in the area should have these aggregated.
- How much new for-sale + rental construction is in the pipeline within 1–3 miles? Heavy new supply typically softens prices + rents 12–24 months out; constrained supply supports both.
Investment metrics
- 1% rule
- 1.51% ✓
- Cap rate
- 12.28%
- Cash-on-cash
- 21.37%
- DSCR
- 1.95
- GRM
- 5.5
CMA / ARV
- ARV (on-the-fly)
- $168,480
- Comps found
- 4
Show comp detail 4 sales within ~0.75 mi
| Address | Dist | Beds/Ba | Sqft | Sold | Price | $/sf | Match |
|---|---|---|---|---|---|---|---|
| 5401 Marjorie St St | 0.20mi | 3/2.0 | 1,584 (+10%) | 20mo | $185,000 | $117 | 57 |
| 14317 Allen Ave | 0.04mi | 2/2.0 (-1) | 1,248 (-13%) | 21mo | $116,000 | $93 | 53 |
| 14109 Bass Ave | 0.28mi | 2/2.0 (-1) | 1,240 (-14%) | 11mo | $128,000 | $103 | 50 |
| 14212 Allen Ave Ave | 0.18mi | 2/2.0 (-1) | 1,248 (-13%) | 20mo | $200,000 | $160 | 48 |
Match score weights: distance 35% · size 25% · config 20% · recency 20%. Top-matched comps best support the ARV.
Projected returns pro-forma
8.65% appreciation · 3.0% rent growth · sell at horizon
- IRR
- 33.3%
- Equity multiple
- 3.45×
- Total profit
- $60,975
- Equity at exit
- $71,600
- IRR
- 29.4%
- Equity multiple
- 7.51×
- Total profit
- $162,202
- Equity at exit
- $146,104
Cash invested: $24,920 (down + closing). Projections, not guarantees.
Landlord ↔ Tenant lean methodology
- Overall (STATE)
- 18 Strongly Tenant-Friendly
- State California
- 18 Strongly Tenant-Friendly · D+13
- County
- — inherits STATE
- City
- — inherits STATE
ZIP-level market 93283
- Home prices YoY
- 1.9%
- Active inventory
- 41
- Price-to-rent
- 5.5×
Monthly cashflow live
- Estimated rent
- $1,340 medium interval (Pro) →
- Mortgage (P&I)
- −$467
- Tax from tax record
- −$91 /mo · $1,091/yr
- Insurance
- −$37
- Flood insurance flood zone
- −$122 /mo · $1,468/yr
- HOA
- −$20
- Vacancy / Maint / Mgmt
- −$281
- Net cashflow
- $321
Break-even live
UW: 25.0% down · 7.5% · 30yr · 1.5% tax · 5.0% vac · 8.0% maint · 8.0% mgmt
Financing live
Cash to close
- Down payment
- $22,250
- Closing costs
- $2,670
- Reserves months
- —
- Total cash needed
- —
Loan-product check · same deal, 3 products live
Conventional
25% down · 7.5% · 30yr
- Down + closing
- —
- Monthly P&I
- —
- Monthly cashflow
- —
- DSCR
- —
- Eligible?
- —
Personal DTI + credit; lowest rate.
DSCR
20% down · 8.5% · 30yr
- Down + closing
- —
- Monthly P&I
- —
- Monthly cashflow
- —
- DSCR
- —
- Eligible?
- —
No personal income docs; deal must DSCR.
Hard money
10% down · 12.0% · 12mo
- Down + closing
- —
- Monthly P&I
- —
- Monthly cashflow
- —
- DSCR
- —
- Eligible?
- —
Short-term bridge; refi at stabilization.
HOA detail
- Monthly dues
- $20 · $240/yr
- Likely covers
- water
Listing history 9 events
-
2026-06-19days on market $89,000 Active 10 DOM
-
2026-06-18days on market $89,000 Active 9 DOM
-
2026-06-17days on market $89,000 Active 8 DOM
-
2026-06-16days on market $89,000 Active 7 DOM
-
2026-06-15days on market $89,000 Active 6 DOM
-
2026-06-14days on market $89,000 Active 4 DOM
-
2026-06-12days on market $89,000 Active 3 DOM
-
2026-06-09remarks 699-char remark
-
2026-06-09$89,000 Active 1 DOM
ⓘ Source: listings_history table (triggers on properties + properties_extension) + one-shot
backfill from property_details.listing_events for pre-trigger history.
Tax reassessment forecast CA · Resets to sale price
- Current annual tax
- $1,091 · $91/mo
- Projected year-2 tax
- $1,091 · $91/mo
- Expected delta
- $0/yr ($0/mo · 0.0%)
ⓘ Screening estimate from a state-policy table — verify with the county assessor before closing.
Climate risk First Street
- Flood 1/10 Low FEMA zone AO · 0% chance over 30 yrs
- Wildfire 7/10 Severe
- Heat 7/10 Severe 7 d/yr ≥96°F today · 17 d/yr by 30 yrs out
- Wind 1/10 Low
- Air quality 9/10 Extreme 18 unhealthy d/yr today · 22 by 30 yrs out
Nearby sold comps map
Loading sold comps map…
Walkable amenities ~0.75 mi
Loading nearby amenities…
Taxation est. · year 1
- Rental income
- $16,077
- − Mortgage interest
- −$4,985
- − Property taxes
- −$1,091
- − Insurance
- −$1,912
- − Repairs & maintenance
- −$1,286
- − Management
- −$1,286
- − HOA
- −$240
- − Depreciation
- −$2,589
- Taxable income
- $2,687
- Est. tax owed @ 24.0%
- −$645
- After-tax cash flow
- $3,212/yr
For passive investors: Depreciation is non-cash, so a rental often shows a tax loss while cash-flowing — sheltering income. Rental losses are passive: they offset passive income freely, and up to $25,000/yr can offset ordinary (W-2) income if you actively participate and your MAGI is under $100k (phasing out to $0 by $150k); unused losses carry forward. On sale, claimed depreciation is recaptured at up to 25%, and gains may owe capital-gains tax (a 1031 exchange can defer both). Figures are a year-1 estimate at your 24.0% rate — not tax advice; consult a CPA.
Schools (NCES district)
- District
- South Fork Union
- NCES district ID
- 0637470
- Math proficiency
- 25% ▲ 5.00%
- Reading proficiency
- 40% ▲ 5.00%
- Median HH income
- $32,532
- Composite
- 29.31/100
- National rank
- #11836
- State rank
- #1016 of 1400 in CA
Livability — Weldon
- Score
- 48/100
- State rank
- #1218
- US rank
- #26156
Category grades
Schools grade is shown separately in the Schools card above.
Census & demographics
- Census place
- Weldon, CA
- Population (ZIP)
- 2,129
Population outlook (Kern County) Hauer SSP2
- Today (2025)
- 947,286 people
- By 2030
- 978,984 · +3.3%
- By 2040
- 1,045,018 · +10.3%
- By 2050
- 1,105,232 · +16.7%
- By 2075
- 1,229,538 · +29.8%
- By 2100
- 1,238,059 · +30.7%
Race, ethnicity, and origin ACS 2023
- Neighborhood character
- Predominantly White (86%)
- Race & ethnicity
- White 86% Hispanic / Latino 11% Two or more races 7% Native American 2%
- Hispanic origin (detail)
- Mexican 7%
- Common ancestry
- Lithuanian 13% Iranian 1%
- Foreign-born
- 17% · Canada
- Languages at home
- 93% English-only · Spanish 7%
Political lean MEDSL · Kern
- 2024 margin
- Strong R (+21.1) · D 38.2% · R 59.3% · Other 2.5%
- 2008→2024 swing
- -3.3pp toward R · 2008: -17.8pp · 2024: -21.1pp
- All cycles
- 2024: R+21.1 2020: R+10.2 2016: R+15.0 2012: R+20.9 2008: R+17.8
Not yet ingested
- Civics
- —
Market trends
- HPI YoY
- ▲ 8.65%
- Current HPI
- 468.8712
- Rent YoY
- —
- Metro
- —
- State GDP YoY
- ▲ 3.21%
- F500 in state
- 116
Industry mix (Fortune 500 HQ in CA)
| Industry | F500 HQs | Revenue |
|---|---|---|
| Technology | 27 | $1,492B |
|
||
| Financial Services | 3 | $174B |
|
||
| Retail | 3 | $44B |
|
||
| Insurance | 3 | $26B |
|
||
| Media / Entertainment | 2 | $115B |
|
||
| Pharmaceuticals / Biotech | 2 | $62B |
|
||
Price history
+78.0% since first listed2 events — show timeline
- 2026-06-08 Listed $89,000 SSMLS
- 1990-09-26 Sold (Public Records) $50,000 Public Records
Property tax history
+2.6%/yrLatest (2025): $1,091 · -0.3% YoY. Source: county tax records.
Cash-flow waterfall
monthlySold comps — $/sqft
last 12 mo · ≤1 miLoading sold comps…