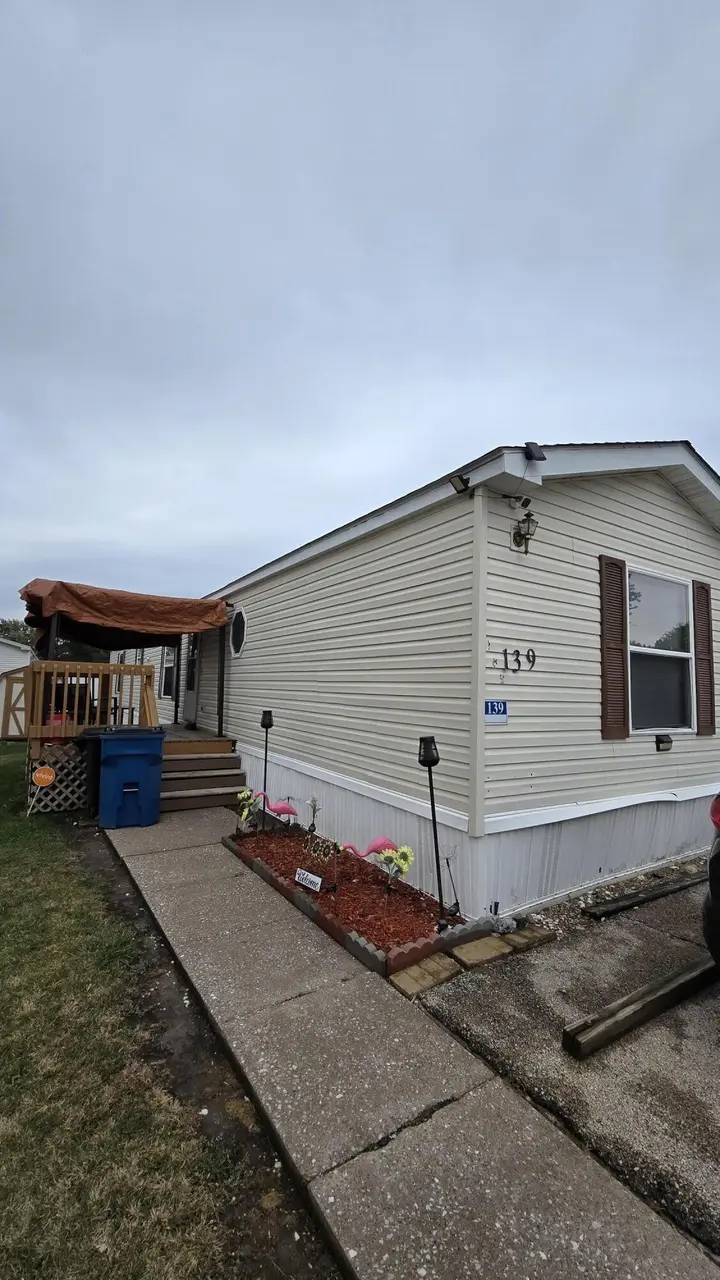
5112 N Fairmount Lot 139 St · Davenport, IA
Flood risk 1/10 · Minimal
- FEMA flood zone
- AE
- Chance of flooding over 30 yrs
- 0.0%
- Est. flood insurance / yr
- $508 – $851
Fire risk 1/10 · Minimal
- Est. fire insurance / yr
- $902 – $1,676
Heat risk 3/10 · Minor
- Hot days now (above threshold)
- 7 days/yr
- Hot days in 30 yrs
- 16 days/yr
Wind risk No data
- Chance of severe wind over 30 yrs
- —
Air-quality risk 3/10 · Minor
- Unhealthy air days now
- 2 days/yr
- Unhealthy air days in 30 yrs
- 3 days/yr
Risk factors via First Street. Map © Google.
Why this score? — see what drove the B grade
The composite is a weighted blend of 9 inputs, each scored 0–100. Each bar is that input's sub-score; the figure is the points it added to the 100-point composite (weight × sub-score).
- Cash flow +30.0/30.0
- 1% rule +10.0/10.0
- DSCR +10.0/10.0
- ARV discount +7.5/15.0
- Livability +4.0/5.0
- Schools +3.9/10.0
- Rent growth +3.0/5.0
- Condition / age +2.5/5.0
- Appreciation +0.0/10.0
$39,900
🖨 Deal sheet (PDF) 📄 Offer letter ✓ Due diligence
Listing remarks MLS
Main floor amenities and affordability unite in this 3 bedroom 2 bath home with an open concept. Enjoy the primary suite with separate shower and garden tub. This well-maintained home is ready for a new owner. This home is on leased land on the outskirts of Davenport. For questions about lot rent and park guidelines, buyers should contact 5 Seasons Mobile Home Park. Please allow 48 hours to show.
Key facts
- Ample counter space
- Spacious kitchen
- Ample cabinet space
Tags
Property features AI
Finance
- Financial info: Annual tax amount reported
Exterior
- Utilities: Public water; Public sewer; Natural gas available
- Home design: Single-family residence; One story; Residential zoning
- Construction: Vinyl siding
- Exterior features: Deck
Interior
- Kitchen: Dishwasher; Refrigerator
- Bedrooms: 3 main-level bedrooms
- Bathrooms: 2 main-level bathrooms
- Heating & cooling: Central air
- Interior features: Dishwasher; Refrigerator; Central air conditioning
- Laundry & utility: Washer and dryer on the main level; Dryer
Neighborhood map
What this means for you Summary
Snapshot
- This is a 3-bed/2.0-bath other listed at $40k.
Deal economics
- At list price, monthly cash flow is $878 ($11k/yr) — positive.
- The deal already cash-flows at list — no discount required.
- Meets the 1% rule at list price ($2k rent vs $40k).
- Recommended offer: $39k (3.0% below list) — sets the bar for market timing.
- Cap rate 34.4% vs local median 4.4% in Davenport — top-decile yield for the area; either an underpriced asset or a hidden risk that comps aren't pricing in. Stress-test before assuming the spread holds.
Location & tenants
- Location reads 79/100 on livability (#126 in IA, #2,312 nationally) — a middle-class / working-renter tenant base. Strengths: cost of living A+, housing A+, health & safety A+; Watch: employment C-, crime F.
- Davenport Community School District (urban): math 43% / reading 50% proficiency, ranked #288 of 289 in IA (top 100%) — families likely to look elsewhere, expect single-tenant / working-renter base with shorter leases.
- Market conditions: Rents rising (+1.8%/yr); 162 active listings in the ZIP; 1 comparable units currently listed for rent nearby; 805 units permitted in Scott County in 2024 (479 in 5+ unit buildings).
Forward outlook
- Local home prices are declining (-3.0%/yr); year-one equity from $276 of loan paydown is wiped out by about $1k of value loss. Plan a longer hold.
- Scott County population projected at +19% by 2050 — long-run rental-demand tailwind backs the buy-and-hold thesis.
- At projected returns (-3.0% appreciation + 1.8% rent growth), your $11k cash investment doubles in ~2 years — after that, you're playing with house money.
Negotiation context
- It's been on market 56 days — a 3% lower offer ($39k) is reasonable based on typical stale-listing flexibility.
- 5 sale attempts since 19y ago with the ask held roughly flat each time — persistent listings suggest the price (not the market) is what's stuck; bring a comps-based counter.
- Current owner paid $34k; 17% above their basis — modest negotiation headroom, anchor on the comps not their cost.
Risks & watch-outs
- Watch-outs: flood insurance adds $57/mo.
- Climate carrying-cost: in FEMA flood zone AE (mandatory federal flood insurance) — expect insurance premiums to compound above CPI over the hold.
Questions for the listing agent
- It's been on market 56 days. Have you received any prior offers? Is the seller open to a 3% concession, seller financing, or rate buy-down credit?
- What's the actual annual flood-insurance premium (NFIP or private), and is the property in a SFHA with mandatory coverage?
- Is there a deadline driving the sale (1031 exchange, divorce, estate, relocation)? That informs how much negotiation room exists.
- Crime grade is F in this area — have there been break-ins, vandalism, or insurance claims at this property in the last 3 years? What carrier currently insures it and at what premium?
- What's the average days-on-market for RENTAL listings here right now (not sales)? A rising rental-DOM trend means longer vacancies and softer asking-rent achievability than the comps imply.
- What's the recent tenant-quality profile in this submarket — average credit score on applications, eviction rate, late-payment / NSF rate, and stable-employment percentage? A property-management company in the area should have these aggregated.
- How much new for-sale + rental construction is in the pipeline within 1–3 miles? Heavy new supply typically softens prices + rents 12–24 months out; constrained supply supports both.
Investment metrics
- 1% rule
- 3.84% ✓
- Cap rate
- 34.40%
- Cash-on-cash
- 100.39%
- DSCR
- 5.47
- GRM
- 2.2
CMA / ARV
- ARV (median comp)
- $192,098
- List price
- $39,900
- Delta
- -79.23%
- Verdict
- UNDERPRICED
- Comps
- 20 within 1.0 mi
Projected returns pro-forma
-3.0% appreciation · 1.8% rent growth · sell at horizon
- IRR
- 93.8%
- Equity multiple
- 5.27×
- Total profit
- $47,683
- Equity at exit
- $5,949
- IRR
- 96.3%
- Equity multiple
- 10.53×
- Total profit
- $106,438
- Equity at exit
- $3,450
Cash invested: $11,172 (down + closing). Projections, not guarantees.
Landlord ↔ Tenant lean methodology
- Overall (STATE)
- 83 Strongly Landlord-Friendly
- State Iowa
- 83 Strongly Landlord-Friendly · R+6
- County
- — inherits STATE
- City
- — inherits STATE
ZIP-level market 52806
- Rents YoY
- 1.8%
- Active inventory
- 162
- Price-to-rent
- 2.2×
Monthly cashflow live
- Estimated rent
- $1,532 medium interval (Pro) →
- Mortgage (P&I)
- −$209
- Tax est. 1.5%
- −$50 /mo · $598/yr
- Insurance
- −$17
- Flood insurance flood zone
- −$57 /mo · $680/yr
- HOA
- −$0
- Vacancy / Maint / Mgmt
- −$322
- Net cashflow
- $878
Break-even live
Sensitivity live
| Price | -10% $906 | -5% $892 | +0% $878 | +5% $864 | +10% $850 |
|---|---|---|---|---|---|
| Rent | -10% $757 | -5% $817 | +0% $878 | +5% $938 | +10% $999 |
| Rate | -1.0pp $898 | -0.5pp $888 | base $878 | +0.5pp $868 | +1.0pp $857 |
UW: 25.0% down · 7.5% · 30yr · 1.5% tax · 5.0% vac · 8.0% maint · 8.0% mgmt
Financing live
Cash to close
- Down payment
- $9,975
- Closing costs
- $1,197
- Reserves months
- —
- Total cash needed
- —
Loan-product check · same deal, 3 products live
Conventional
25% down · 7.5% · 30yr
- Down + closing
- —
- Monthly P&I
- —
- Monthly cashflow
- —
- DSCR
- —
- Eligible?
- —
Personal DTI + credit; lowest rate.
DSCR
20% down · 8.5% · 30yr
- Down + closing
- —
- Monthly P&I
- —
- Monthly cashflow
- —
- DSCR
- —
- Eligible?
- —
No personal income docs; deal must DSCR.
Hard money
10% down · 12.0% · 12mo
- Down + closing
- —
- Monthly P&I
- —
- Monthly cashflow
- —
- DSCR
- —
- Eligible?
- —
Short-term bridge; refi at stabilization.
Rent comps 1 comps
| Address | Beds | Baths | Sqft | Rent | $/sqft | DOM | Units | Dist |
|---|---|---|---|---|---|---|---|---|
| 5556 N Thornwood Ave Davenport, IA | 3.0 | 2.0 | 1715 | $1,800 | $1.05 | 44d | 1 | 0.92mi |
Listing history 29 events
-
2026-06-18days on market $39,900 Active 56 DOM
-
2026-06-17days on market $39,900 Active 55 DOM
-
2026-06-16days on market $39,900 Active 54 DOM
-
2026-06-15days on market $39,900 Active 53 DOM
-
2026-06-14days on market $39,900 Active 51 DOM
-
2026-06-13days on market $39,900 Active 50 DOM
-
2026-06-10days on market $39,900 Active 48 DOM
-
2026-06-09days on market $39,900 Active 47 DOM
-
2026-06-08days on market $39,900 Active 46 DOM
-
2026-06-07days on market $39,900 Active 45 DOM
-
2026-06-03days on market $39,900 Active 41 DOM
-
2026-06-02days on market $39,900 Active 40 DOM
-
2026-06-01days on market $39,900 Active 39 DOM
-
2026-05-31days on market $39,900 Active 38 DOM
-
2026-05-30days on market $39,900 Active 37 DOM
-
2026-04-23$39,900 Active 433-char remark
-
2025-08-08soldstatus $34,000 Closed 399-char remark
Show marketing remark (399 chars)
Main floor amenities and affordability unite in this 3 bedroom 2 bath home with an open concept. Enjoy the primary suite with separate shower and garden tub. This well-maintained home is ready for a new owner. This home is on leased land on the outskirts of Davenport. For questions about lot rent and park guidelines, buyers should contact 5 Seasons Mobile Home Park. Please allow 48 hours to show.
-
2025-07-30status Pending 399-char remark
Show marketing remark (399 chars)
Main floor amenities and affordability unite in this 3 bedroom 2 bath home with an open concept. Enjoy the primary suite with separate shower and garden tub. This well-maintained home is ready for a new owner. This home is on leased land on the outskirts of Davenport. For questions about lot rent and park guidelines, buyers should contact 5 Seasons Mobile Home Park. Please allow 48 hours to show.
-
2025-02-27$39,000 Active 399-char remark
Show marketing remark (399 chars)
Main floor amenities and affordability unite in this 3 bedroom 2 bath home with an open concept. Enjoy the primary suite with separate shower and garden tub. This well-maintained home is ready for a new owner. This home is on leased land on the outskirts of Davenport. For questions about lot rent and park guidelines, buyers should contact 5 Seasons Mobile Home Park. Please allow 48 hours to show.
-
2017-07-07soldstatus $49,500
Show marketing remark (337 chars)
Build your own home in this wonderful neighborhood located in northwest Davenport. Bring your own builder or we can help with designs and builders. Subdivision has public water supply and city sewer. ASK ABOUT THE DAVENPORT NOW PROGRAM! Effective May 18, 2017 this lot no longer require flood insurance per FEMA - see attached documents.
-
2017-03-01$49,500
Show marketing remark (337 chars)
Build your own home in this wonderful neighborhood located in northwest Davenport. Bring your own builder or we can help with designs and builders. Subdivision has public water supply and city sewer. ASK ABOUT THE DAVENPORT NOW PROGRAM! Effective May 18, 2017 this lot no longer require flood insurance per FEMA - see attached documents.
-
2012-08-20soldstatus $4,254,000
-
2012-07-26soldstatus $35,000
-
2011-12-28$40,500
-
2010-01-22historical
-
2009-01-22historical
-
2007-12-22historical
-
2007-05-11soldstatus $49,000
-
2007-03-28$49,000
ⓘ Source: listings_history table (triggers on properties + properties_extension) + one-shot
backfill from property_details.listing_events for pre-trigger history.
Climate risk First Street
- Flood 1/10 Low FEMA zone AE · 0% chance over 30 yrs
- Wildfire 1/10 Low
- Heat 3/10 Moderate
- Air quality 3/10 Moderate 2 unhealthy d/yr today · 3 by 30 yrs out
Nearby sold comps map
Loading sold comps map…
Walkable amenities ~0.75 mi
Loading nearby amenities…
Taxation est. · year 1
- Rental income
- $18,385
- − Mortgage interest
- −$2,235
- − Property taxes
- −$598
- − Insurance
- −$879
- − Repairs & maintenance
- −$1,471
- − Management
- −$1,471
- − Depreciation
- −$1,161
- Taxable income
- $10,570
- Est. tax owed @ 24.0%
- −$2,537
- After-tax cash flow
- $7,999/yr
For passive investors: Depreciation is non-cash, so a rental often shows a tax loss while cash-flowing — sheltering income. Rental losses are passive: they offset passive income freely, and up to $25,000/yr can offset ordinary (W-2) income if you actively participate and your MAGI is under $100k (phasing out to $0 by $150k); unused losses carry forward. On sale, claimed depreciation is recaptured at up to 25%, and gains may owe capital-gains tax (a 1031 exchange can defer both). Figures are a year-1 estimate at your 24.0% rate — not tax advice; consult a CPA.
Schools (NCES district)
- District
- Davenport Community School District
- NCES district ID
- 1908580
- Math proficiency
- 43% ▼ -11.00%
- Reading proficiency
- 50% ▼ -3.00%
- Median HH income
- $46,157
- Composite
- 39.49/100
- National rank
- #3951
- State rank
- #288 of 289 in IA
Livability — Davenport
- Score
- 79/100
- State rank
- #126
- US rank
- #2312
Category grades
Schools grade is shown separately in the Schools card above.
Census & demographics
- Census place
- Davenport, IA
- County
- Scott County · 144,583 people
- City population
- 103,319
- Metro
- Davenport-Moline-Rock Island, IA-IL
- Population (ZIP)
- 26,871
- Household income
- $74,297
- Rent vs Own
- Severe rent burden
- 735.0
Population outlook (Scott County) Hauer SSP2
- Today (2025)
- 188,878 people
- By 2030
- 196,648 · +4.1%
- By 2040
- 210,860 · +11.6%
- By 2050
- 224,359 · +18.8%
- By 2075
- 258,884 · +37.1%
- By 2100
- 286,447 · +51.7%
Race, ethnicity, and origin ACS 2023
- Neighborhood character
- Predominantly White (74%)
- Race & ethnicity
- White 74% Black 12% Hispanic / Latino 7% Two or more races 7% Asian 2%
- Hispanic origin (detail)
- Mexican 6%
- Common ancestry
- Slovak 2% Lithuanian 2% Iranian 1%
- Foreign-born
- 4% · Canada, Vietnam, China
- Languages at home
- 93% English-only · Spanish 3% Vietnamese 1% Chinese 1%
Political lean MEDSL · Scott
- 2024 margin
- Toss-up / Even · D 47.3% · R 51.2% · Other 1.4%
- 2008→2024 swing
- -18.4pp toward R · 2008: 14.6pp · 2024: -3.9pp
- All cycles
- 2024: R+3.9 2020: D+3.5 2016: D+1.4 2012: D+13.8 2008: D+14.6
Not yet ingested
- Civics
- —
Market trends
- HPI YoY
- ▼ -127.41%
- Current HPI
- 185.0808
- Rent YoY
- ▲ 1.80%
- Metro
- Davenport-Moline-Rock Island, IA-IL
- State GDP YoY
- ▲ 2.48%
- F500 in state
- 4
Industry mix (Fortune 500 HQ in IA)
| Industry | F500 HQs | Revenue |
|---|---|---|
| Financial Services | 1 | $16B |
|
||
| Retail / Convenience | 1 | $15B |
|
||
Price history
-18.6% since first listed14 events — show timeline
- 2026-04-23 Listed $39,900 Muscatine BOR
- 2025-08-08 Sold (MLS) $34,000 Muscatine BOR
- 2025-07-30 Pending — Muscatine BOR
- 2025-02-27 Listed $39,000 Muscatine BOR
- 2017-07-07 Sold (MLS) $49,500 MRED as Distributed by MLS Grid
- 2017-03-01 Listed $49,500 MRED as Distributed by MLS Grid
- 2012-08-20 Sold (Public Records) $4,254,000 Public Records
- 2012-07-26 Sold (MLS) $35,000 MRED as Distributed by MLS Grid
- 2011-12-28 Listed $40,500 MRED as Distributed by MLS Grid
- 2010-01-22 Listing Removed — MRED as Distributed by MLS Grid
- 2009-01-22 Listing Removed — MRED as Distributed by MLS Grid
- 2007-12-22 Listing Removed — MRED as Distributed by MLS Grid
- 2007-05-11 Sold (MLS) $49,000 MRED as Distributed by MLS Grid
- 2007-03-28 Listed $49,000 MRED as Distributed by MLS Grid
Property tax history
-4.5%/yrLatest (2025): $22,344 · +2.5% YoY. Source: county tax records.
Cash-flow waterfall
monthlySold comps — $/sqft
last 12 mo · ≤1 miLoading sold comps…