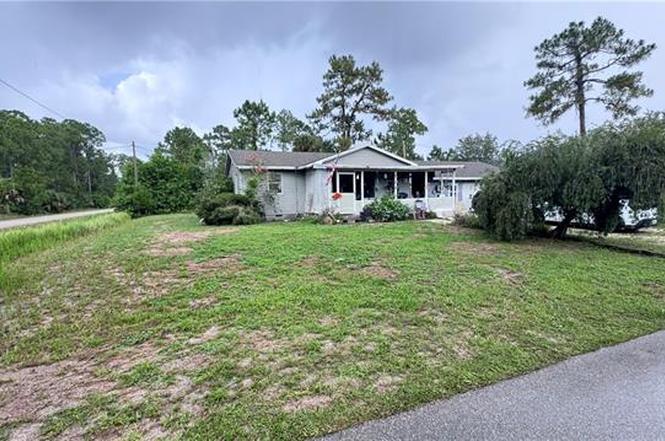
406 W 8th St · Lehigh Acres, FL
Flood risk 5/10 · Moderate
- FEMA flood zone
- X (unshaded)
- Chance of flooding over 30 yrs
- 0.57%
- Est. flood insurance / yr
- $507 – $1,088
Fire risk 4/10 · Minor
- Est. fire insurance / yr
- $947 – $1,759
Heat risk 9/10 · Severe
- Hot days now (above 108°F)
- 6 days/yr
- Hot days in 30 yrs
- 24 days/yr
Wind risk 10/10 · Severe
- Chance of severe wind over 30 yrs
- 99.0%
Air-quality risk 2/10 · Minimal
- Unhealthy air days now
- 1 days/yr
- Unhealthy air days in 30 yrs
- 2 days/yr
Risk factors via First Street. Map © Google.
Why this score? — see what drove the B grade
The composite is a weighted blend of 9 inputs, each scored 0–100. Each bar is that input's sub-score; the figure is the points it added to the 100-point composite (weight × sub-score).
- Cash flow +30.0/30.0
- 1% rule +10.0/10.0
- DSCR +10.0/10.0
- ARV discount +7.5/15.0
- Schools +4.1/10.0
- Rent growth +3.8/5.0
- Livability +3.0/5.0
- Condition / age +2.5/5.0
- Appreciation +0.0/10.0
$99,000
🖨 Deal sheet 📄 Offer letter ✓ Due diligence
Listing remarks
Opportunity knocks! This 2-bedroom, 1-bath home is the perfect project for investors, flippers, or buyers looking to create value. Situated on a spacious . 25-acre corner lot on a quiet street, this property offers plenty of potential and room to expand. Conveniently located just minutes from downtown Lehigh Acres, shopping, dining, schools, and major roadways. The home is being offered as-is and is priced aggressively for a quick sale. With solid bones, a desirable corner location, and a large lot on a quiet street, this fixer-upper presents an excellent opportunity to renovate, rent, or resell.
Key facts
- Quiet street
- Spacious lot
- Corner lot
Tags
Property features AI
Finance
- Other: Property type: Residential; Development: Lehigh Acres; Lot size approximately 0.25 acres; Lot dimensions roughly 104' x 105' (corner lot)
- HOA & community: Non-gated community
Exterior
- Parking: Attached 2-car garage
- Utilities: Well water; Septic sewer; Cable available
- Home design: Single family home; 1 story (ranch); Rear exposure faces north
- Construction: Built in 1981
- Exterior features: Shingle roof; Windows: see remarks; Storm protection: see remarks; Corner lot
Interior
- Kitchen: Range; Refrigerator/Freezer
- Bedrooms: 2 bedrooms
- Flooring: Laminate flooring
- Bathrooms: 1 full bathroom; Master bath: see remarks
- Heating & cooling: Central electric heat; Central electric cooling
- Interior features: Screened lanai/porch; See remarks for additional interior details
Neighborhood map
What this means for you Summary
Snapshot
- This is a 2-bed/1.0-bath single-family listed at $99k.
Deal economics
- At list price, monthly cash flow is $592 ($7k/yr) — positive.
- The deal already cash-flows at list — no discount required.
- Meets the 1% rule at list price ($2k rent vs $99k).
- Cap rate 13.5% vs local median 4.7% in Lehigh Acres — top-decile yield for the area; either an underpriced asset or a hidden risk that comps aren't pricing in. Stress-test before assuming the spread holds.
Location & tenants
- Location reads 59/100 on livability (#826 in FL) — a working-class tenant base; expect higher turnover. Strengths: cost of living A+, housing A+; Watch: crime C-, employment D+, schools D-.
- Lee (suburban): math 47% / reading 50% proficiency, ranked #42 of 73 in FL (top 58%) — families likely to look elsewhere, expect single-tenant / working-renter base with shorter leases.
- Market conditions: Rents rising fast (+5.3%/yr); 1611 active listings in the ZIP; 6 comparable units currently listed for rent nearby; rentals at typical pace (median 21d on market — plan ~3-4 weeks tenant-placement turnaround); 15,411 units permitted in Lee County in 2024 (4,686 in 5+ unit buildings).
Forward outlook
- Local home prices are declining (-3.0%/yr); year-one equity from $684 of loan paydown is wiped out by about $3k of value loss. Plan a longer hold.
- Lee County population projected at +44% by 2050 — long-run rental-demand tailwind backs the buy-and-hold thesis.
- At projected returns (-3.0% appreciation + 5.3% rent growth), your $28k cash investment doubles in ~5 years — after that, you're playing with house money.
Negotiation context
- Only 1 days on market — expect competitive offers; lowballing is unlikely to land.
- Current owner paid $51k; list at $99k implies a 93% gain — meaningful room to come down on a strong offer.
Risks & watch-outs
- Climate carrying-cost: moderate flood risk; severe wind risk, 99% chance of damaging wind over 30y; extreme-heat days projected 6→24/yr by 2055 (HVAC capex compounding) — expect insurance premiums to compound above CPI over the hold.
Questions for the listing agent
- Is there a deadline driving the sale (1031 exchange, divorce, estate, relocation)? That informs how much negotiation room exists.
- Schools are D-rated, which usually means shorter tenancies and higher turnover. Who's the typical renter profile here, and what's been the actual vacancy rate?
- What's the average days-on-market for RENTAL listings here right now (not sales)? A rising rental-DOM trend means longer vacancies and softer asking-rent achievability than the comps imply.
- What's the recent tenant-quality profile in this submarket — average credit score on applications, eviction rate, late-payment / NSF rate, and stable-employment percentage? A property-management company in the area should have these aggregated.
- How much new for-sale + rental construction is in the pipeline within 1–3 miles? Heavy new supply typically softens prices + rents 12–24 months out; constrained supply supports both.
Investment metrics
- 1% rule
- 1.57% ✓
- Cap rate
- 13.46%
- Cash-on-cash
- 25.61%
- DSCR
- 2.14
- GRM
- 5.3
CMA / ARV
No comps found within radius.
Projected returns pro-forma
-3.0% appreciation · 5.33% rent growth · sell at horizon
- IRR
- 21.7%
- Equity multiple
- 1.92×
- Total profit
- $25,366
- Equity at exit
- $14,761
- IRR
- 31.3%
- Equity multiple
- 4.13×
- Total profit
- $86,665
- Equity at exit
- $8,560
Cash invested: $27,720 (down + closing). Projections, not guarantees.
Landlord ↔ Tenant lean methodology
- Overall (STATE)
- 87 Strongly Landlord-Friendly
- State Florida
- 87 Strongly Landlord-Friendly · R+3
- County
- — inherits STATE
- City
- — inherits STATE
ZIP-level market 33972
- Home prices YoY
- -13.6%
- Rents YoY
- 5.3%
- Active inventory
- 1611
- Price-to-rent
- 5.3×
Monthly cashflow live
- Estimated rent
- $1,558 high interval (Pro) →
- Mortgage (P&I)
- −$519
- Tax from tax record
- −$78 /mo · $942/yr
- Insurance
- −$41
- HOA
- −$0
- Vacancy / Maint / Mgmt
- −$327
- Net cashflow
- $592
Break-even live
UW: 25.0% down · 7.5% · 30yr · 1.5% tax · 5.0% vac · 8.0% maint · 8.0% mgmt
Financing live
Cash to close
- Down payment
- $24,750
- Closing costs
- $2,970
- Reserves months
- —
- Total cash needed
- —
Loan-product check · same deal, 3 products live
Conventional
25% down · 7.5% · 30yr
- Down + closing
- —
- Monthly P&I
- —
- Monthly cashflow
- —
- DSCR
- —
- Eligible?
- —
Personal DTI + credit; lowest rate.
DSCR
20% down · 8.5% · 30yr
- Down + closing
- —
- Monthly P&I
- —
- Monthly cashflow
- —
- DSCR
- —
- Eligible?
- —
No personal income docs; deal must DSCR.
Hard money
10% down · 12.0% · 12mo
- Down + closing
- —
- Monthly P&I
- —
- Monthly cashflow
- —
- DSCR
- —
- Eligible?
- —
Short-term bridge; refi at stabilization.
Rent comps 6 comps
| Address | Beds | Baths | Sqft | Rent | $/sqft | DOM | Units | Dist |
|---|---|---|---|---|---|---|---|---|
| 107 W 5th St Lehigh Acres, FL | 2.0 | 2.0 | 832 | $1,450 | $1.74 | 3d | 1 | 0.86mi |
| 1232 Village Lakes Blvd Lehigh Acres, FL | 1.0–2.0 | 1.0–2.0 | 734 | $1,449 | $1.97 | 14d | 17 | 0.87mi |
| 714 W 12th St Lehigh Acres, FL | 3.0 | 2.0 | 1121 | $1,600 | $1.43 | 14d | 1 | 1.01mi |
| 1000 W 12th St #1002 Lehigh Acres, FL | 2.0 | 2.0 | 964 | $1,225 | $1.27 | 21d | 1 | 1.07mi |
| 1418 W 12th St Lehigh Acres, FL | 2.0 | 2.0 | 1113 | $1,295 | $1.16 | 21d | 1 | 1.31mi |
| 216 Oregon Way Lehigh Acres, FL | 3.0 | 1.0 | 920 | $1,250 | $1.36 | 21d | 1 | 1.38mi |
Listing history 2 events
-
2026-06-17remarks 603-char remark
-
2026-06-17$99,000 Active 1 DOM
ⓘ Source: listings_history table (triggers on properties + properties_extension) + one-shot
backfill from property_details.listing_events for pre-trigger history.
Tax reassessment forecast FL · Resets to sale price
- Current annual tax
- $942 · $78/mo
- Projected year-2 tax
- $942 · $78/mo
- Expected delta
- $0/yr ($0/mo · 0.0%)
ⓘ Screening estimate from a state-policy table — verify with the county assessor before closing.
Climate risk First Street
- Flood 5/10 Major FEMA zone X (unshaded) · 57% chance over 30 yrs
- Wildfire 4/10 Moderate
- Heat 9/10 Extreme 6 d/yr ≥108°F today · 24 d/yr by 30 yrs out
- Wind 10/10 Extreme 99% chance of damaging wind over 30 yrs
- Air quality 2/10 Low 1 unhealthy d/yr today · 2 by 30 yrs out
Nearby sold comps map
Loading sold comps map…
Walkable amenities ~0.75 mi
Loading nearby amenities…
Taxation est. · year 1
- Rental income
- $18,690
- − Mortgage interest
- −$5,546
- − Property taxes
- −$942
- − Insurance
- −$495
- − Repairs & maintenance
- −$1,495
- − Management
- −$1,495
- − Depreciation
- −$2,880
- Taxable income
- $5,838
- Est. tax owed @ 24.0%
- −$1,401
- After-tax cash flow
- $5,698/yr
For passive investors: Depreciation is non-cash, so a rental often shows a tax loss while cash-flowing — sheltering income. Rental losses are passive: they offset passive income freely, and up to $25,000/yr can offset ordinary (W-2) income if you actively participate and your MAGI is under $100k (phasing out to $0 by $150k); unused losses carry forward. On sale, claimed depreciation is recaptured at up to 25%, and gains may owe capital-gains tax (a 1031 exchange can defer both). Figures are a year-1 estimate at your 24.0% rate — not tax advice; consult a CPA.
Schools (NCES district)
- District
- Lee
- NCES district ID
- 1201080
- Math proficiency
- 47% ▼ -11.00%
- Reading proficiency
- 50% ▼ -4.00%
- Median HH income
- $49,518
- Composite
- 41.49/100
- National rank
- #3458
- State rank
- #42 of 73 in FL
Livability — Lehigh Acres
- Score
- 59/100
- State rank
- #826
- US rank
- #20055
Category grades
Schools grade is shown separately in the Schools card above.
Census & demographics
- Census place
- Lehigh Acres, FL
- County
- Lee County · 788,662 people
- City population
- 130,638
- Metro
- Cape Coral-Fort Myers, FL
- Population (ZIP)
- 17,285
- Household income
- $73,819
- Rent vs Own
- Severe rent burden
- 190.0
Population outlook (Lee County) Hauer SSP2
- Today (2025)
- 871,946 people
- By 2030
- 955,468 · +9.6%
- By 2040
- 1,113,587 · +27.7%
- By 2050
- 1,256,891 · +44.1%
- By 2075
- 1,560,270 · +78.9%
- By 2100
- 1,726,848 · +98.0%
Race, ethnicity, and origin ACS 2023
- Neighborhood character
- Diverse neighborhood (Simpson 0.65)
- Race & ethnicity
- White 44% Hispanic / Latino 38% Two or more races 21% Black 13%
- Hispanic origin (detail)
- Mexican 8% Puerto Rican 7% Cuban 18%
- Common ancestry
- Hispanic 6% Italian 2% Romanian 2%
- Foreign-born
- 27% · Canada, Guatemala
- Languages at home
- 61% English-only · Spanish 32% French/Haitian/Cajun 4% Other Indo-European 1%
Political lean MEDSL · Lee
- 2024 margin
- Strong R (+28.4) · D 35.5% · R 63.9%
- 2008→2024 swing
- -18.0pp toward R · 2008: -10.4pp · 2024: -28.4pp
- All cycles
- 2024: R+28.4 2020: R+19.2 2016: R+20.4 2012: R+16.6 2008: R+10.4
Not yet ingested
- Civics
- —
Market trends
- HPI YoY
- ▼ -53.97%
- Current HPI
- 343.484
- Rent YoY
- ▲ 5.33%
- Metro
- Cape Coral-Fort Myers, FL
- State GDP YoY
- ▲ 3.28%
- F500 in state
- 36
Industry mix (Fortune 500 HQ in FL)
| Industry | F500 HQs | Revenue |
|---|---|---|
| Industrial Technology | 2 | $29B |
|
||
| Insurance | 2 | $17B |
|
||
| Retail | 1 | $60B |
|
||
| Technology Distribution | 1 | $58B |
|
||
| Homebuilding | 1 | $35B |
|
||
| Technology Manufacturing | 1 | $35B |
|
||
Price history
+93.0% since first listed2 events — show timeline
- 2026-06-17 Listed $99,000 NAPLESMLS
- 1994-05-03 Sold (Public Records) $51,300 Public Records
Property tax history
+9.6%/yrLatest (2025): $942 · +11.7% YoY. Source: county tax records.
Cash-flow waterfall
monthlySold comps — $/sqft
last 12 mo · ≤1 miLoading sold comps…