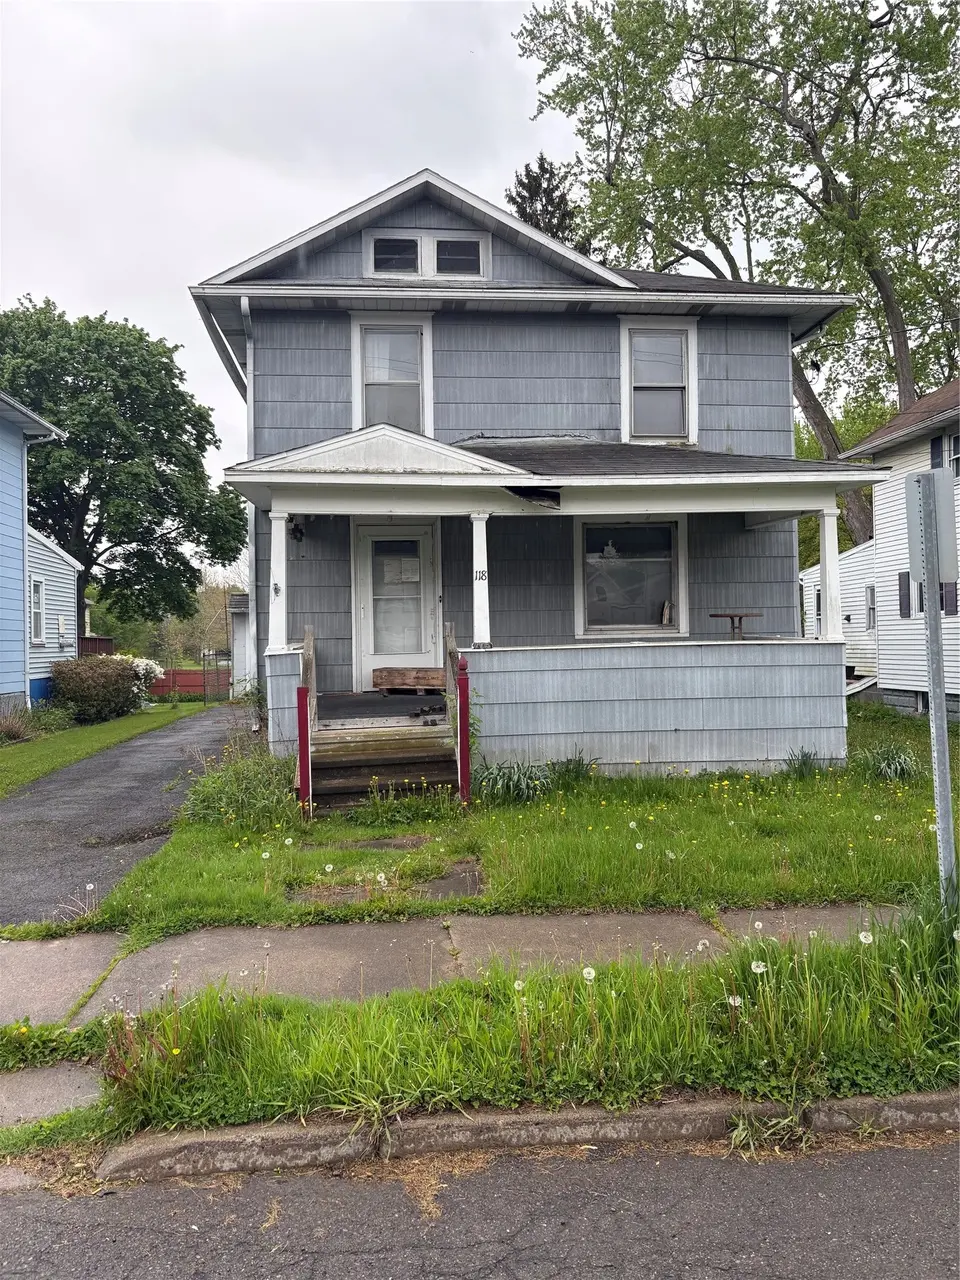
118 Theron St · Johnson City, NY
Flood risk 10/10 · Severe
- FEMA flood zone
- X (shaded)
- Chance of flooding over 30 yrs
- 0.99%
- Est. flood insurance / yr
- $473 – $860
Fire risk 2/10 · Minimal
- Est. fire insurance / yr
- $691 – $1,283
Heat risk 3/10 · Minor
- Hot days now (above 92°F)
- 7 days/yr
- Hot days in 30 yrs
- 16 days/yr
Wind risk 2/10 · Minimal
- Chance of severe wind over 30 yrs
- 2.0%
Air-quality risk 2/10 · Minimal
- Unhealthy air days now
- 0 days/yr
- Unhealthy air days in 30 yrs
- 1 days/yr
Risk factors via First Street. Map © Google.
Why this score? — see what drove the A grade
The composite is a weighted blend of 9 inputs, each scored 0–100. Each bar is that input's sub-score; the figure is the points it added to the 100-point composite (weight × sub-score).
- Cash flow +30.0/30.0
- ARV discount +15.0/15.0
- 1% rule +10.0/10.0
- DSCR +10.0/10.0
- Appreciation +10.0/10.0
- Rent growth +4.9/5.0
- Livability +3.8/5.0
- Schools +3.3/10.0
- Condition / age +2.5/5.0
$79,900
🖨 Deal sheet 📄 Offer letter ✓ Due diligence
Listing remarks
COME SEE THIS NICE FIXER UPPER IN JOHNON CITY! Traditional 2 story floorplan. Nice woodwork. Formal Dining Room. 1st floor half bathroom. Updated electric service. Master bdrm has a nice walk in closet. The enclosed back porch is a great space for gatherings or just relaxing and it come with a built in outdoor grill! The porch opens up to a deep fenced back yard. There is a garage!! Bring this house back to live and make it a home. AS IS SALE. Cash or rehab loan only. Freeze caused pipes to burst and cause the damage to the walls, floors and ceilings.
Key facts
- Covered front porch
- Updated elec service
- Floorplan 2 story
Tags
Property features AI
Exterior
- Parking: Detached garage (1 car)
- Utilities: Public water; Public sewer; Cable available
- Home design: Single family residence; Two levels
- Construction: Clapboard exterior
- Exterior features: Covered, enclosed porch
Interior
- Kitchen: Exhaust fan; Gas water heater
- Bedrooms: Total of 8 rooms (includes bedrooms and living spaces)
- Flooring: Hardwood; Tile; Vinyl
- Bathrooms: 1 full bathroom; 1 half bathroom
- Heating & cooling: Baseboard heating; Ceiling fans for cooling
- Interior features: Exhaust fan; Gas water heater; Basement
- Laundry & utility: Washer hookup
Neighborhood map
What this means for you Summary
Snapshot
- This is a 3-bed/1.0-bath single-family listed at $80k.
Deal economics
- At list price, monthly cash flow is $669 ($8k/yr) — positive.
- The deal already cash-flows at list — no discount required.
- Meets the 1% rule at list price ($2k rent vs $80k).
- Recommended offer: $78k (3.0% below list) — sets the bar for market timing.
- Cap rate 17.2% vs local median 6.2% in Johnson City — top-decile yield for the area; either an underpriced asset or a hidden risk that comps aren't pricing in. Stress-test before assuming the spread holds.
Location & tenants
- Location reads 76/100 on livability (#238 in NY, #3,739 nationally) — a middle-class / working-renter tenant base. Strengths: cost of living A+, housing A+, health & safety A+; Watch: crime F, employment D-.
- Johnson City Central School District (suburban): math 38% / reading 41% proficiency, ranked #535 of 590 in NY (top 91%) — families likely to look elsewhere, expect single-tenant / working-renter base with shorter leases.
- Zoned schools: Johnson City Elementary/Primary School (496 students, 55% FRL) — zoned schools at 55% FRL track the district average.
- Market conditions: Rents rising fast (+9.5%/yr); 99 active listings in the ZIP; 16 comparable units currently listed for rent nearby; rentals at typical pace (median 21d on market — plan ~3-4 weeks tenant-placement turnaround); 340 units permitted in Broome County in 2024 (269 in 5+ unit buildings).
- This rent runs 33% of the median local income ($59k/yr) — at the standard rent-burdened threshold; future hikes will face affordability resistance.
Forward outlook
- In year one you build about $9k of equity ($552 loan paydown + $8k appreciation (10.0% local appreciation)).
- Broome County population projected at -13% by 2050 — secular population decline; favor cash flow + early exit over multi-decade hold.
- At projected returns (10.0% appreciation + 8.0% rent growth), your $22k cash investment doubles in ~2 years — after that, you're playing with house money.
- By year 4, paydown + projected appreciation supports a ~$30k cash-out refi (75% LTV) — recoverable capital for the next deal without selling this one.
Negotiation context
- It's been on market 37 days — a 3% lower offer ($78k) is reasonable based on typical stale-listing flexibility.
Risks & watch-outs
- Watch-outs: flood insurance adds $56/mo; built in 1935 — expect roof / HVAC / electrical / plumbing capex.
- Climate carrying-cost: severe flood risk — expect insurance premiums to compound above CPI over the hold.
Questions for the listing agent
- It's been on market 37 days. Have you received any prior offers? Is the seller open to a 3% concession, seller financing, or rate buy-down credit?
- Built in 1935 — when were the roof, HVAC, electrical panel, plumbing, and water heater last replaced?
- What's the actual annual flood-insurance premium (NFIP or private), and is the property in a SFHA with mandatory coverage?
- Is there a deadline driving the sale (1031 exchange, divorce, estate, relocation)? That informs how much negotiation room exists.
- Crime grade is F in this area — have there been break-ins, vandalism, or insurance claims at this property in the last 3 years? What carrier currently insures it and at what premium?
- What's the average days-on-market for RENTAL listings here right now (not sales)? A rising rental-DOM trend means longer vacancies and softer asking-rent achievability than the comps imply.
- What's the recent tenant-quality profile in this submarket — average credit score on applications, eviction rate, late-payment / NSF rate, and stable-employment percentage? A property-management company in the area should have these aggregated.
- How much new for-sale + rental construction is in the pipeline within 1–3 miles? Heavy new supply typically softens prices + rents 12–24 months out; constrained supply supports both.
Investment metrics
- 1% rule
- 2.02% ✓
- Cap rate
- 17.18%
- Cash-on-cash
- 38.87%
- DSCR
- 2.73
- GRM
- 4.1
CMA / ARV
- ARV (median comp)
- $147,554
- List price
- $79,900
- Delta
- -45.85%
- Verdict
- UNDERPRICED
- Comps
- 20 within 1.0 mi
Show comp detail 12 sales within ~0.75 mi
| Address | Dist | Beds/Ba | Sqft | Sold | Price | $/sf | Match |
|---|---|---|---|---|---|---|---|
| 90 Theron St | 0.05mi | 3/1.5 | 1,144 (0%) | 10mo | $159,900 | $140 | 87 |
| 59 Lusk St | 0.26mi | 3/1.0 | 1,133 (-1%) | 6mo | $162,000 | $143 | 81 |
| 3 Banks Ave Ave | 0.24mi | 3/1.5 | 1,248 (+9%) | 0mo | $190,000 | $152 | 71 |
| 473 Grand Ave | 0.19mi | 3/1.0 | 1,226 (+7%) | 14mo | $135,000 | $110 | 67 |
| 310 Floral Ave | 0.38mi | 3/2.0 | 1,184 (+4%) | 9mo | $76,000 | $64 | 65 |
| 9 Endwell St | 0.71mi | 3/1.5 | 1,200 (+5%) | 6mo | $145,000 | $121 | 52 |
| 41 Elizabeth St | 0.42mi | 3/1.0 | 1,312 (+15%) | 6mo | $126,000 | $96 | 51 |
| 307 Floral Ave | 0.38mi | 4/1.5 (+1) | 1,232 (+8%) | 14mo | $146,000 | $119 | 51 |
| 58 Orchard Ave | 0.33mi | 2/1.0 (-1) | 998 (-13%) | 10mo | $145,000 | $145 | 50 |
| 204 Baldwin St N | 0.62mi | 3/1.0 | 1,012 (-12%) | 6mo | $187,500 | $185 | 47 |
| 52 Albert St | 0.56mi | 2/1.0 (-1) | 992 (-13%) | 3mo | $122,000 | $123 | 45 |
| 40 Haynes Ave | 0.70mi | 3/1.0 | 1,296 (+13%) | 11mo | $145,000 | $112 | 36 |
Match score weights: distance 35% · size 25% · config 20% · recency 20%. Top-matched comps best support the ARV.
Projected returns pro-forma
10.0% appreciation · 8.0% rent growth · sell at horizon
- IRR
- 55.4%
- Equity multiple
- 5.23×
- Total profit
- $94,731
- Equity at exit
- $71,980
- IRR
- 51.1%
- Equity multiple
- 12.92×
- Total profit
- $266,732
- Equity at exit
- $155,228
Cash invested: $22,372 (down + closing). Projections, not guarantees.
Landlord ↔ Tenant lean methodology
- Overall (STATE)
- 15 Strongly Tenant-Friendly
- State New York
- 15 Strongly Tenant-Friendly · D+10
- County
- — inherits STATE
- City
- — inherits STATE
ZIP-level market 13790
- Home prices YoY
- 6.8%
- Rents YoY
- 9.5%
- Active inventory
- 99
- Price-to-rent
- 4.1×
Monthly cashflow live
- Estimated rent
- $1,616 high interval (Pro) →
- Mortgage (P&I)
- −$419
- Tax est. 1.5%
- −$100 /mo · $1,198/yr
- Insurance
- −$33
- Flood insurance flood zone
- −$56 /mo · $666/yr
- HOA
- −$0
- Vacancy / Maint / Mgmt
- −$339
- Net cashflow
- $669
Break-even live
UW: 25.0% down · 7.5% · 30yr · 1.5% tax · 5.0% vac · 8.0% maint · 8.0% mgmt
Financing live
Cash to close
- Down payment
- $19,975
- Closing costs
- $2,397
- Reserves months
- —
- Total cash needed
- —
Loan-product check · same deal, 3 products live
Conventional
25% down · 7.5% · 30yr
- Down + closing
- —
- Monthly P&I
- —
- Monthly cashflow
- —
- DSCR
- —
- Eligible?
- —
Personal DTI + credit; lowest rate.
DSCR
20% down · 8.5% · 30yr
- Down + closing
- —
- Monthly P&I
- —
- Monthly cashflow
- —
- DSCR
- —
- Eligible?
- —
No personal income docs; deal must DSCR.
Hard money
10% down · 12.0% · 12mo
- Down + closing
- —
- Monthly P&I
- —
- Monthly cashflow
- —
- DSCR
- —
- Eligible?
- —
Short-term bridge; refi at stabilization.
Rent comps 16 comps
| Address | Beds | Baths | Sqft | Rent | $/sqft | DOM | Units | Dist |
|---|---|---|---|---|---|---|---|---|
| 207 Saint Charles St #2 Johnson City, NY | 2.0 | 1.0 | 925 | $1,250 | $1.35 | 20d | 1 | 0.46mi |
| 50 Crocker Ave Johnson City, NY | 4.0 | 2.0 | 1411 | $2,000 | $1.42 | 20d | 1 | 0.52mi |
| 400 Riverside Dr Unit 27 Johnson City, NY | 2.0 | 1.0 | 800 | $2,000 | $2.50 | 13d | 1 | 0.56mi |
| 400 Riverside Dr Unit 15 Johnson City, NY | 3.0 | 1.0 | 1000 | $2,425 | $2.42 | 13d | 1 | 0.56mi |
| 400 Riverside Dr Unit 212 Johnson City, NY | 3.0 | 1.0 | 1100 | $2,500 | $2.27 | 13d | 1 | 0.56mi |
| 79 Saint Charles St Apt 3 Johnson City, NY | 3.0 | 1.0 | 793 | $1,340 | $1.69 | 13d | 1 | 0.60mi |
| 51 Allen St Unit 1 Johnson City, NY | 3.0 | 1.0 | 1170 | $1,575 | $1.35 | 20d | 1 | 0.61mi |
| 143 Harrison St Unit 2 Johnson City, NY | 2.0 | 1.0 | 750 | $1,100 | $1.47 | 13d | 1 | 0.61mi |
| 11 Dayton St Apt 5 Johnson City, NY | 2.0 | 1.0 | 900 | $1,200 | $1.33 | 13d | 1 | 0.67mi |
| 145 Floral Ave Unit 4 Johnson City, NY | 3.0 | 1.0 | 1095 | $1,250 | $1.14 | 20d | 1 | 0.77mi |
| 10 Bidwell St Johnson City, NY | 3.0 | 2.0 | 1200 | $1,850 | $1.54 | 43d | 1 | 0.78mi |
| 155 Willow St Unit 3 Johnson City, NY | 2.0 | 1.0 | 739 | $1,200 | $1.62 | 20d | 1 | 0.81mi |
| 127 Burbank Ave Unit 2 Johnson City, NY | 2.0 | 1.0 | 1032 | $1,000 | $0.97 | 20d | 1 | 0.87mi |
| 263 Main St Unit 2 Johnson City, NY | 2.0 | 2.0 | 850 | $1,399 | $1.65 | 20d | 1 | 0.90mi |
| 133 Crestmont Rd Unit 2 Binghamton, NY | 3.0 | 1.0 | 1300 | $1,900 | $1.46 | 43d | 1 | 1.43mi |
| 296 Main St Unit 6 Binghamton, NY | 3.0 | 1.0 | 1200 | $1,250 | $1.04 | 13d | 1 | 1.45mi |
Listing history 22 events
-
2026-06-19days on market $79,900 Active 37 DOM
-
2026-06-18days on market $79,900 Active 36 DOM
-
2026-06-18price $79,900 Active 35 DOM
-
2026-06-17days on market $84,500 Active 35 DOM
-
2026-06-16days on market $84,500 Active 34 DOM
-
2026-06-15days on market $84,500 Active 33 DOM
-
2026-06-14days on market $84,500 Active 31 DOM
-
2026-06-13days on market $84,500 Active 30 DOM
-
2026-06-10days on market $84,500 Active 28 DOM
-
2026-06-09days on market $84,500 Active 27 DOM
-
2026-06-09price $84,500 Active 26 DOM
-
2026-06-08days on market $89,500 Active 26 DOM
-
2026-06-07days on market $89,500 Active 25 DOM
-
2026-06-05days on market $89,500 Active 22 DOM
-
2026-06-03days on market $89,500 Active 21 DOM
-
2026-06-02days on market $89,500 Active 20 DOM
-
2026-06-01pricedays on market $89,500 Active 19 DOM
-
2026-05-31days on market $94,500 Active 18 DOM
-
2026-05-30days on market $94,500 Active 17 DOM
-
2026-05-13$94,500 Active 347-char remark
-
2012-07-31soldstatus $70,000
-
2007-12-19soldstatus $60,667
ⓘ Source: listings_history table (triggers on properties + properties_extension) + one-shot
backfill from property_details.listing_events for pre-trigger history.
Climate risk First Street
- Flood 10/10 Extreme FEMA zone X (shaded) · 99% chance over 30 yrs
- Wildfire 2/10 Low
- Heat 3/10 Moderate 7 d/yr ≥92°F today · 16 d/yr by 30 yrs out
- Wind 2/10 Low 2% chance of damaging wind over 30 yrs
- Air quality 2/10 Low 0 unhealthy d/yr today · 1 by 30 yrs out
Nearby sold comps map
Loading sold comps map…
Walkable amenities ~0.75 mi
Loading nearby amenities…
Taxation est. · year 1
- Rental income
- $19,395
- − Mortgage interest
- −$4,476
- − Property taxes
- −$1,198
- − Insurance
- −$1,066
- − Repairs & maintenance
- −$1,552
- − Management
- −$1,552
- − Depreciation
- −$2,324
- Taxable income
- $7,227
- Est. tax owed @ 24.0%
- −$1,735
- After-tax cash flow
- $6,295/yr
For passive investors: Depreciation is non-cash, so a rental often shows a tax loss while cash-flowing — sheltering income. Rental losses are passive: they offset passive income freely, and up to $25,000/yr can offset ordinary (W-2) income if you actively participate and your MAGI is under $100k (phasing out to $0 by $150k); unused losses carry forward. On sale, claimed depreciation is recaptured at up to 25%, and gains may owe capital-gains tax (a 1031 exchange can defer both). Figures are a year-1 estimate at your 24.0% rate — not tax advice; consult a CPA.
Schools (NCES district)
- District
- Johnson City Central School District
- NCES district ID
- 3615900
- Math proficiency
- 38% ▼ -8.00%
- Reading proficiency
- 41% ▲ 2.00%
- Median HH income
- $40,514
- Composite
- 33.17/100
- National rank
- #5545
- State rank
- #535 of 590 in NY
Livability — Johnson City
- Score
- 76/100
- State rank
- #238
- US rank
- #3739
Category grades
Schools grade is shown separately in the Schools card above.
Census & demographics
- Census place
- Johnson City, NY
- County
- Broome County · 126,805 people
- City population
- 18,739
- Metro
- Binghamton, NY
- Population (ZIP)
- 18,739
- Household income
- $59,045
- Rent vs Own
- Severe rent burden
- 1233.0
Population outlook (Broome County) Hauer SSP2
- Today (2025)
- 187,989 people
- By 2030
- 183,066 · -2.6%
- By 2040
- 172,228 · -8.4%
- By 2050
- 163,161 · -13.2%
- By 2075
- 153,641 · -18.3%
- By 2100
- 140,851 · -25.1%
Race, ethnicity, and origin ACS 2023
- Neighborhood character
- Predominantly White (75%)
- Race & ethnicity
- White 75% Two or more races 9% Asian 8% Black 6% Hispanic / Latino 4%
- Common ancestry
- Romanian 6% Lithuanian 3% Scotch-Irish 2%
- Foreign-born
- 9% · Canada, China, Vietnam
- Languages at home
- 88% English-only · Other Indo-European 4% French/Haitian/Cajun 2% Spanish 2%
Political lean MEDSL · Broome
- 2024 margin
- Toss-up / Even · D 50.2% · R 49.8%
- 2008→2024 swing
- -7.6pp toward R · 2008: 8.0pp · 2024: 0.4pp
- All cycles
- 2024: D+0.4 2020: D+3.5 2016: R+3.7 2012: D+4.6 2008: D+8.0
Not yet ingested
- Civics
- —
Market trends
- HPI YoY
- ▲ 18.06%
- Current HPI
- 285.3668
- Rent YoY
- ▲ 9.47%
- Metro
- Binghamton, NY
- State GDP YoY
- ▲ 2.60%
- F500 in state
- 92
Industry mix (Fortune 500 HQ in NY)
| Industry | F500 HQs | Revenue |
|---|---|---|
| Financial Services | 10 | $950B |
|
||
| Consumer Goods | 9 | $162B |
|
||
| Insurance | 4 | $225B |
|
||
| Telecommunications | 2 | $144B |
|
||
| Pharmaceuticals | 2 | $112B |
|
||
| Media / Entertainment | 2 | $69B |
|
||
Price history
+31.7% since first listed6 events — show timeline
- 2026-06-18 Price Changed $79,900 GBAOR
- 2026-06-08 Price Changed $84,500 GBAOR
- 2026-06-01 Price Changed $89,500 GBAOR
- 2026-05-13 Listed $94,500 GBAOR
- 2012-07-31 Sold (Public Records) $70,000 Public Records
- 2007-12-19 Sold (Public Records) $60,667 Public Records
Property tax history
+4.1%/yrLatest (2025): $4,508 · +1.7% YoY. Source: county tax records.
Cash-flow waterfall
monthlySold comps — $/sqft
last 12 mo · ≤1 miLoading sold comps…