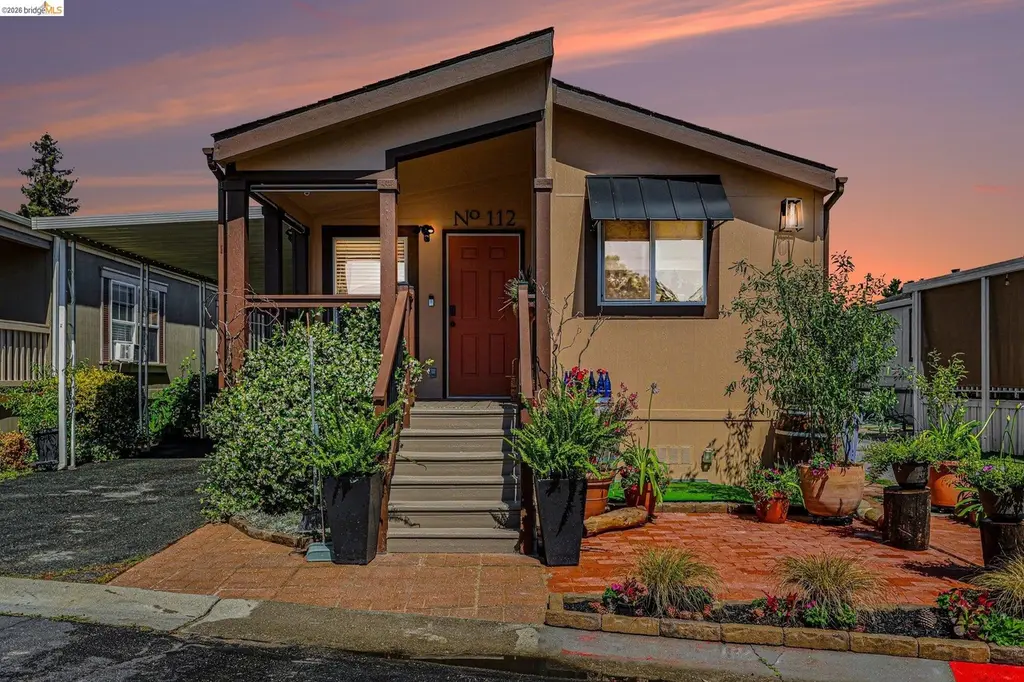
112 A St · Concord, CA
Flood risk 8/10 · Major
- FEMA flood zone
- X (unshaded)
- Chance of flooding over 30 yrs
- 0.99%
- Est. flood insurance / yr
- $507 – $1,088
Fire risk 6/10 · Moderate
- Est. fire insurance / yr
- $659 – $1,223
Heat risk 5/10 · Moderate
- Hot days now (above 97°F)
- 7 days/yr
- Hot days in 30 yrs
- 14 days/yr
Wind risk 1/10 · Minimal
- Chance of severe wind over 30 yrs
- —
Air-quality risk 9/10 · Severe
- Unhealthy air days now
- 18 days/yr
- Unhealthy air days in 30 yrs
- 19 days/yr
Risk factors via First Street. Map © Google.
Why this score? — see what drove the C- grade
The composite is a weighted blend of 9 inputs, each scored 0–100. Each bar is that input's sub-score; the figure is the points it added to the 100-point composite (weight × sub-score).
- Cash flow +19.4/30.0
- ARV discount +7.5/15.0
- DSCR +6.1/10.0
- 1% rule +5.2/10.0
- Schools +3.8/10.0
- Livability +3.2/5.0
- Rent growth +2.9/5.0
- Condition / age +2.5/5.0
- Appreciation +0.0/10.0
$275,000
🖨 Deal sheet 📄 Offer letter ✓ Due diligence
Listing remarks
Exceptional Updated Modular Home in Family-Friendly Community! Step into your dream home! This beautifully updated modular residence offers over 1,000 square feet of modern living, perfect for those who appreciate style and functionality. Interior Features Airy Atmosphere: vaulted ceilings that create a spacious, light-filled environment. Open Floor Plan: Seamless flow between living, dining, and kitchen areas, ideal for entertaining. Master suite with updated bathroom and an electric fireplace. Central air conditioning and heating for a comfortable environment. Designer Finishes: Thoughtfully curated with sophisticated designs throughout. Abundant Storage Features a huge double-door, lofte
Key facts
- Primary bathroom
- Dining area
- Big kitchen
Tags
Property features AI
Finance
- HOA & community: Pets allowed; Located in a park community (Victoria Mobile)
Exterior
- Parking: Carport
- Utilities: Public water
- Home design: Manufactured in park (mobile home); Double wide; Single-story (entry at street level)
- Construction: Wood siding
- Exterior features: Front porch; Back yard; Side yard; Level lot
Interior
- Kitchen: Updated kitchen
- Bedrooms: 3 bedrooms
- Flooring: Laminate; Vinyl
- Bathrooms: 2 full bathrooms
- Heating & cooling: Forced air heating; No air conditioning
- Interior features: Updated kitchen; Dining area; Mirrored closet doors; Main entry; Laundry facility
- Laundry & utility: Laundry closet
Neighborhood map
What this means for you Summary
Snapshot
- This is a 3-bed/2.0-bath manufactured listed at $275k.
Deal economics
- At list price, monthly cash flow is $240 ($3k/yr) — positive.
- The deal already cash-flows at list — no discount required.
- Meets the 1% rule at list price ($3k rent vs $275k).
- Recommended offer: $271k (1.5% below list) — sets the bar for market timing.
- Cap rate 7.6% vs local median 2.8% in Concord — top-decile yield for the area; either an underpriced asset or a hidden risk that comps aren't pricing in. Stress-test before assuming the spread holds.
Location & tenants
- Location reads 65/100 on livability (#397 in CA) — a middle-class / working-renter tenant base. Strengths: employment A+, health & safety A+, housing B; Watch: schools C-, crime F, amenities F.
- Mt. Diablo Unified (suburban): math 36% / reading 45% proficiency, ranked #202 of 517 in CA (top 39%) — families likely to look elsewhere, expect single-tenant / working-renter base with shorter leases.
- Market conditions: Rents rising (+1.6%/yr); 116 active listings in the ZIP; 9 comparable units currently listed for rent nearby; rentals at typical pace (median 24d on market — plan ~3-4 weeks tenant-placement turnaround); solid renter incomes; 2,169 units permitted in Contra Costa County in 2024 (896 in 5+ unit buildings).
- This rent runs 41% of the median local income ($82k/yr) — at the standard rent-burdened threshold; future hikes will face affordability resistance.
Forward outlook
- Local home prices are declining (-3.0%/yr); year-one equity from $2k of loan paydown is wiped out by about $8k of value loss. Plan a longer hold.
- Contra Costa County population projected at +26% by 2050 — long-run rental-demand tailwind backs the buy-and-hold thesis.
Negotiation context
- It's been on market 29 days — a 2% lower offer ($271k) is reasonable based on typical stale-listing flexibility.
- 2 sale attempts; this cycle's ask has dropped $24k (8%) from the opening price — seller is motivated, your offer sets the floor, not the list.
Risks & watch-outs
- Watch-outs: flood insurance adds $66/mo.
- Climate carrying-cost: severe flood risk; major wildfire risk; extreme-heat days projected 7→14/yr by 2055 (HVAC capex compounding) — expect insurance premiums to compound above CPI over the hold.
Questions for the listing agent
- What's the actual annual flood-insurance premium (NFIP or private), and is the property in a SFHA with mandatory coverage?
- Is there a deadline driving the sale (1031 exchange, divorce, estate, relocation)? That informs how much negotiation room exists.
- Crime grade is F in this area — have there been break-ins, vandalism, or insurance claims at this property in the last 3 years? What carrier currently insures it and at what premium?
- What's the average days-on-market for RENTAL listings here right now (not sales)? A rising rental-DOM trend means longer vacancies and softer asking-rent achievability than the comps imply.
- What's the recent tenant-quality profile in this submarket — average credit score on applications, eviction rate, late-payment / NSF rate, and stable-employment percentage? A property-management company in the area should have these aggregated.
- How much new for-sale + rental construction is in the pipeline within 1–3 miles? Heavy new supply typically softens prices + rents 12–24 months out; constrained supply supports both.
Investment metrics
- 1% rule
- 1.02% ✓
- Cap rate
- 7.63%
- Cash-on-cash
- 4.78%
- DSCR
- 1.21
- GRM
- 8.2
CMA / ARV
- ARV (on-the-fly)
- $180,000
- Comps found
- 4
Show comp detail 4 sales within ~0.75 mi
| Address | Dist | Beds/Ba | Sqft | Sold | Price | $/sf | Match |
|---|---|---|---|---|---|---|---|
| 2197 Dalis Dr #124 | 0.13mi | 2/1.5 (-1) | 960 (-4%) | 3mo | $160,000 | $167 | 78 |
| 83 A St | 0.06mi | 2/2.0 (-1) | 1,140 (+14%) | 4mo | $205,000 | $180 | 66 |
| 2007 Dalis Dr #36 | 0.29mi | 2/2.0 (-1) | 1,060 (+6%) | 8mo | $195,000 | $184 | 65 |
| 2064 Dalis Dr | 0.25mi | 2/2.0 (-1) | 1,040 (+4%) | 18mo | $170,000 | $163 | 62 |
Match score weights: distance 35% · size 25% · config 20% · recency 20%. Top-matched comps best support the ARV.
Projected returns pro-forma
-3.0% appreciation · 1.59% rent growth · sell at horizon
- IRR
- -12.0%
- Equity multiple
- 0.57×
- Total profit
- $-33,094
- Equity at exit
- $41,003
- IRR
- -5.2%
- Equity multiple
- 0.68×
- Total profit
- $-24,379
- Equity at exit
- $23,777
Cash invested: $77,000 (down + closing). Projections, not guarantees.
Landlord ↔ Tenant lean methodology
- Overall (STATE)
- 18 Strongly Tenant-Friendly
- State California
- 18 Strongly Tenant-Friendly · D+13
- County
- — inherits STATE
- City
- — inherits STATE
ZIP-level market 94520
- Rents YoY
- 1.6%
- Active inventory
- 116
- Price-to-rent
- 8.2×
Monthly cashflow live
- Estimated rent
- $2,794 high interval (Pro) →
- Mortgage (P&I)
- −$1,442
- Tax est. 1.5%
- −$344 /mo · $4,125/yr
- Insurance
- −$115
- Flood insurance flood zone
- −$66 /mo · $798/yr
- HOA
- −$0
- Vacancy / Maint / Mgmt
- −$587
- Net cashflow
- $240
Break-even live
UW: 25.0% down · 7.5% · 30yr · 1.5% tax · 5.0% vac · 8.0% maint · 8.0% mgmt
Financing live
Cash to close
- Down payment
- $68,750
- Closing costs
- $8,250
- Reserves months
- —
- Total cash needed
- —
Loan-product check · same deal, 3 products live
Conventional
25% down · 7.5% · 30yr
- Down + closing
- —
- Monthly P&I
- —
- Monthly cashflow
- —
- DSCR
- —
- Eligible?
- —
Personal DTI + credit; lowest rate.
DSCR
20% down · 8.5% · 30yr
- Down + closing
- —
- Monthly P&I
- —
- Monthly cashflow
- —
- DSCR
- —
- Eligible?
- —
No personal income docs; deal must DSCR.
Hard money
10% down · 12.0% · 12mo
- Down + closing
- —
- Monthly P&I
- —
- Monthly cashflow
- —
- DSCR
- —
- Eligible?
- —
Short-term bridge; refi at stabilization.
Rent comps 9 comps
| Address | Beds | Baths | Sqft | Rent | $/sqft | DOM | Units | Dist |
|---|---|---|---|---|---|---|---|---|
| 2069 Olivera Rd Concord, CA | 2.0 | 1.5 | 975 | $2,450 | $2.51 | 24d | 1 | 0.24mi |
| 2007 Olivera Rd Unit C Concord, CA | 2.0 | 1.5 | 975 | $2,700 | $2.77 | 5d | 1 | 0.35mi |
| 2225 Hillsborough Ct Apt 2 Concord, CA | 2.0 | 1.0 | 962 | $2,200 | $2.29 | 5d | 1 | 0.37mi |
| 2838 Loma Vista Ave Concord, CA | 3.0 | 2.0 | 1260 | $2,995 | $2.38 | 24d | 1 | 0.64mi |
| 2451 Olivera Rd Concord, CA | 1.0–2.0 | 1.0 | 815 | $2,475 | $3.04 | 1d | 6 | 0.69mi |
| 3412 Flamingo Dr #3410 Concord, CA | 3.0 | 2.0 | 1062 | $4,000 | $3.77 | 24d | 1 | 0.73mi |
| 2756 Argyll Ave Unit C Concord, CA | 2.0 | 1.0 | 900 | $2,000 | $2.22 | 24d | 1 | 0.93mi |
| 2627 Prestwick Ave Concord, CA | 4.0 | 2.0 | 1260 | $3,500 | $2.78 | 16d | 1 | 1.03mi |
| 3378 Moretti Dr Concord, CA | 3.0 | 2.0 | 1242 | $3,695 | $2.98 | 24d | 1 | 1.25mi |
Listing history 14 events
-
2026-06-18days on market $275,000 Active 29 DOM
-
2026-06-17days on market $275,000 Active 28 DOM
-
2026-06-16days on market $275,000 Active 27 DOM
-
2026-06-15days on market $275,000 Active 26 DOM
-
2026-06-13days on market $275,000 Active 24 DOM
-
2026-06-13days on market $275,000 Active 23 DOM
-
2026-06-10days on market $275,000 Active 20 DOM
-
2026-06-08days on market $275,000 Active 19 DOM
-
2026-06-07days on market $275,000 Active 18 DOM
-
2026-06-04days on market $275,000 Active 15 DOM
-
2026-06-03days on market $275,000 Active 14 DOM
-
2026-06-02days on market $275,000 Active 13 DOM
-
2026-06-02remarks 699-char remark
-
2026-06-02$275,000 Active 12 DOM
ⓘ Source: listings_history table (triggers on properties + properties_extension) + one-shot
backfill from property_details.listing_events for pre-trigger history.
Climate risk First Street
- Flood 8/10 Severe FEMA zone X (unshaded) · 99% chance over 30 yrs
- Wildfire 6/10 Major
- Heat 5/10 Major 7 d/yr ≥97°F today · 14 d/yr by 30 yrs out
- Wind 1/10 Low
- Air quality 9/10 Extreme 18 unhealthy d/yr today · 19 by 30 yrs out
Nearby sold comps map
Loading sold comps map…
Walkable amenities ~0.75 mi
Loading nearby amenities…
Taxation est. · year 1
- Rental income
- $33,525
- − Mortgage interest
- −$15,404
- − Property taxes
- −$4,125
- − Insurance
- −$2,172
- − Repairs & maintenance
- −$2,682
- − Management
- −$2,682
- − Depreciation
- −$8,000
- Taxable loss
- −$1,541
- Est. tax savings @ 24.0%
- +$370
- After-tax cash flow
- $3,251/yr
For passive investors: Depreciation is non-cash, so a rental often shows a tax loss while cash-flowing — sheltering income. Rental losses are passive: they offset passive income freely, and up to $25,000/yr can offset ordinary (W-2) income if you actively participate and your MAGI is under $100k (phasing out to $0 by $150k); unused losses carry forward. On sale, claimed depreciation is recaptured at up to 25%, and gains may owe capital-gains tax (a 1031 exchange can defer both). Figures are a year-1 estimate at your 24.0% rate — not tax advice; consult a CPA.
Schools (NCES district)
- District
- Mt. Diablo Unified
- NCES district ID
- 0626370
- Math proficiency
- 36% ▼ -2.00%
- Reading proficiency
- 45% ▼ -5.00%
- Median HH income
- $77,494
- Composite
- 37.5/100
- National rank
- #4401
- State rank
- #202 of 517 in CA
Livability — Concord
- Score
- 65/100
- State rank
- #397
- US rank
- #13519
Category grades
Schools grade is shown separately in the Schools card above.
Census & demographics
- Census place
- Concord, CA
- County
- Contra Costa County · 1,059,880 people
- City population
- 125,693
- Metro
- San Francisco-Oakland-Berkeley, CA
- Population (ZIP)
- 37,381
- Household income
- $82,479
- Rent vs Own
- Severe rent burden
- 2649.0
Population outlook (Contra Costa County) Hauer SSP2
- Today (2025)
- 1,287,720 people
- By 2030
- 1,364,937 · +6.0%
- By 2040
- 1,506,209 · +17.0%
- By 2050
- 1,624,373 · +26.1%
- By 2075
- 1,853,193 · +43.9%
- By 2100
- 1,901,231 · +47.6%
Race, ethnicity, and origin ACS 2023
- Neighborhood character
- Diverse neighborhood (Simpson 0.65)
- Race & ethnicity
- Hispanic / Latino 51% White 28% Two or more races 20% Asian 10% Black 4% Native American 2%
- Hispanic origin (detail)
- Mexican 35% Puerto Rican 3%
- Common ancestry
- Lithuanian 2% Italian 2% Russian 1%
- Foreign-born
- 35% · Canada, China, Vietnam
- Languages at home
- 43% English-only · Spanish 43% Tagalog/Filipino 3% Other Indo-European 2%
Political lean MEDSL · Contra Costa
- 2024 margin
- Solid D (+38.0) · D 67.3% · R 29.4% · Other 3.3%
- 2008→2024 swing
- +0.2pp no change · 2008: 37.8pp · 2024: 38.0pp
- All cycles
- 2024: D+38.0 2020: D+45.3 2016: D+43.5 2012: D+33.7 2008: D+37.8
Not yet ingested
- Civics
- —
Market trends
- HPI YoY
- ▼ -551.74%
- Current HPI
- 440.2872
- Rent YoY
- ▲ 1.59%
- Metro
- San Francisco-Oakland-Berkeley, CA
- State GDP YoY
- ▲ 3.21%
- F500 in state
- 116
Industry mix (Fortune 500 HQ in CA)
| Industry | F500 HQs | Revenue |
|---|---|---|
| Technology | 27 | $1,492B |
|
||
| Financial Services | 3 | $174B |
|
||
| Retail | 3 | $44B |
|
||
| Insurance | 3 | $26B |
|
||
| Media / Entertainment | 2 | $115B |
|
||
| Pharmaceuticals / Biotech | 2 | $62B |
|
||
Price history
-8.0% since first listed4 events — show timeline
- 2026-06-01 Relisted — bridgeMLS, Bay East AOR, or Contra Costa AOR
- 2026-06-01 Price Changed $275,000 bridgeMLS, Bay East AOR, or Contra Costa AOR
- 2026-05-13 Listing Removed — bridgeMLS, Bay East AOR, or Contra Costa AOR
- 2026-05-01 Listed $299,000 bridgeMLS, Bay East AOR, or Contra Costa AOR
Property tax history
-0.9%/yrLatest (2025): $257 · +2.9% YoY. Source: county tax records.
Cash-flow waterfall
monthlySold comps — $/sqft
last 12 mo · ≤1 miLoading sold comps…