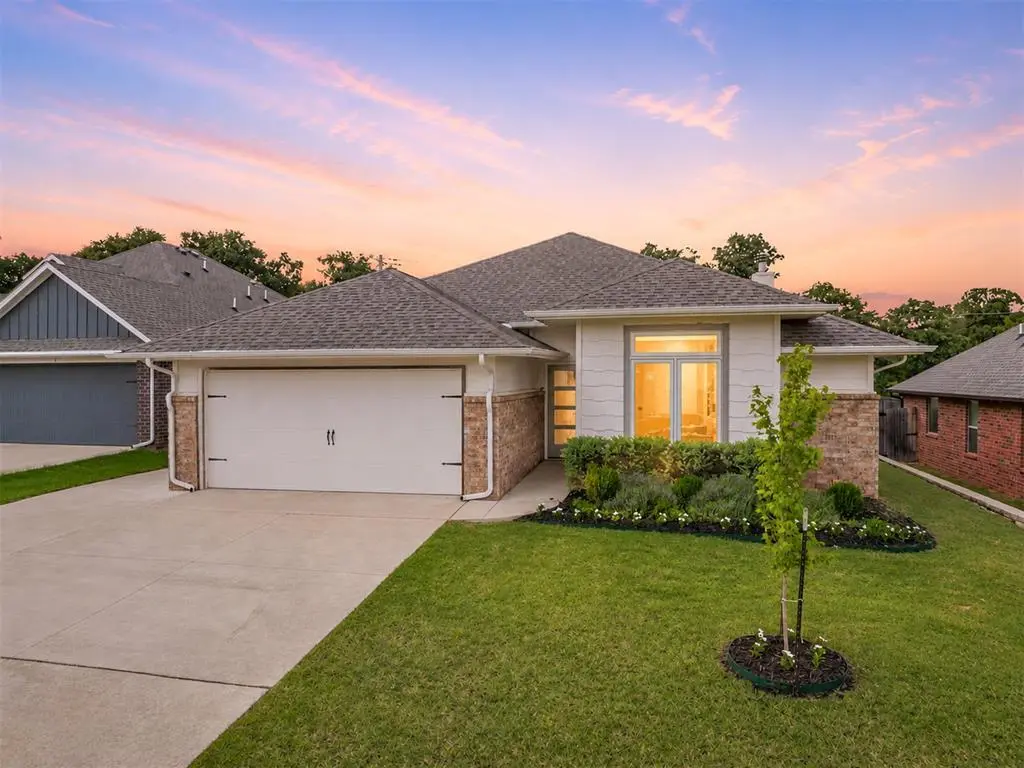
8517 Stark St · Edmond, OK
Flood risk 1/10 · Minimal
- FEMA flood zone
- X (unshaded)
- Chance of flooding over 30 yrs
- 0.0%
- Est. flood insurance / yr
- $507 – $1,088
Fire risk 4/10 · Minor
- Est. fire insurance / yr
- $2,463 – $4,575
Heat risk 5/10 · Moderate
- Hot days now (above 109°F)
- 7 days/yr
- Hot days in 30 yrs
- 19 days/yr
Wind risk 2/10 · Minimal
- Chance of severe wind over 30 yrs
- 4.0%
Air-quality risk 2/10 · Minimal
- Unhealthy air days now
- 2 days/yr
- Unhealthy air days in 30 yrs
- 2 days/yr
Risk factors via First Street. Map © Google.
Why this score? — see what drove the D- grade
The composite is a weighted blend of 9 inputs, each scored 0–100. Each bar is that input's sub-score; the figure is the points it added to the 100-point composite (weight × sub-score).
- Appreciation +10.0/10.0
- Cash flow +7.0/30.0
- ARV discount +4.3/15.0
- Livability +3.9/5.0
- Schools +3.6/10.0
- Rent growth +2.5/5.0
- Condition / age +2.5/5.0
- 1% rule +1.8/10.0
- DSCR +1.2/10.0
$339,000
🖨 Deal sheet (PDF) 📄 Offer letter ✓ Due diligence
Listing remarks MLS
This Brinklee floor plan includes 1,580 Sq Ft of total living space, which includes 1,500 Sq Ft of indoor living space and 80 Sq Ft of outdoor living space. This home has 3 bedrooms, 2 bathrooms and a 2 car garage with storm shelter installed. The living room provides a stack stone surround corner fireplaces, large windows, and is open to the kitchen! The kitchen is large corner pantry, 3CM granite counter tops, back splash, cabinets to the ceiling, and stunning pendent lighting. The master bedroom provides a raised ceiling detail, has an attached master bathroom with Jetta tub, spacious walk in shower, and huge master closet with access to the utility room! The outdoor living has a fireplace, gas line hook up, and cable outlet, this covered back patio is perfect for entertaining! Other amenities that this home provides are Smart Home Technology, a whole home air filtration system, Rinnai Tankless water heater, and R-44 insulation! Property is fully fenced!
Key facts
- Gated community
- Community pool
- Gym
Tags
Property features AI
Finance
- Other: Homestead eligible; Manual geocode source; Directions: Woods at HighGarden is located at the SW corner of Sorghum Mill & Douglas. Enter community from Douglas entrance just S of Sorghum Mill.
- Financial info: Accepts cash, conventional, FHA or VA, VA financing; Loan qualification possible
- HOA & community: Mandatory association dues; Association fee approximately $1,000 (includes gated entry, greenbelt, common area maintenance, pool, recreation facility)
Exterior
- Parking: Concrete driveway; 2-car garage
- Security: Security system
- Utilities: Public utilities; Electricity available; Natural gas available; Cable available; High speed internet available; Double glazed windows
- Home design: Single family residence; One-level property; Existing construction; Woods/Highgarden addition
- Construction: Brick and frame construction; Heavy composition roof; Low E windows; Conventional foundation; Built as an existing home
- Exterior features: Covered patio; Wood fencing; Interior lot; Storm shelter on garage floor; Gated entry (community amenity); Greenbelt (community amenity); Common area maintenance (community amenity); Pool (community amenity); Recreation facility (community amenity)
Interior
- Kitchen: Dishwasher; Disposal; Microwave; Free standing gas range; Free standing electric oven; Kitchen external exhaust
- Bedrooms: 3 bedrooms
- Flooring: Combination of carpet and tile
- Bathrooms: 2 full bathrooms
- Heating & cooling: Zoned heating; Smart house features; Smoke alarm
- Interior features: Ceiling fan(s); In-law plan; Gas log fireplace; Fireplace insert; Inside utility
- Laundry & utility: Inside utility; Tankless hot water
Neighborhood map
What this means for you Summary
Snapshot
- This is a 3-bed/2.0-bath single-family listed at $339k.
Deal economics
- At list price, monthly cash flow is $-503 ($-6k/yr) — negative.
- To cash-flow at today's rent, offer at most $250k (26.2% below list).
- To meet the 1% rule (rent ≥ 1% of price), the offer needs to be $230k (32.2% below list).
- Recommended offer: $230k (32.2% below list) — sets the bar for 1% rule.
- Cap rate 4.5% vs local median 3.4% in Edmond — top-decile yield for the area; either an underpriced asset or a hidden risk that comps aren't pricing in. Stress-test before assuming the spread holds.
Location & tenants
- Location reads 78/100 on livability (#6 in OK, #2,383 nationally) — a middle-class / working-renter tenant base. Strengths: employment A+, housing A+, crime A-; Watch: health & safety C-, commute F.
- Edmond (suburban): math 38% / reading 40% proficiency, ranked #11 of 270 in OK (top 4%) — families likely to look elsewhere, expect single-tenant / working-renter base with shorter leases.
- Zoned schools: Redbud Es (616 students, 0% FRL); Sequoyah Ms (math 40% / reading 34%, grade F, #17 of 345 statewide, top 6%, 1,006 students, 0% FRL); Memorial Hs (math 44% / reading 56%, grade D+, #4 of 447 statewide, top 1%, 2,605 students, 0% FRL) — zoned schools average 0% FRL vs 22% district-wide (22 pts lower); this property's tenant base skews higher-income than the district average.
- Market conditions: 192 active listings in the ZIP; 1 comparable units currently listed for rent nearby; 5,365 units permitted in Oklahoma County in 2024 (569 in 5+ unit buildings).
Forward outlook
- In year one you build about $36k of equity ($2k loan paydown + $34k appreciation (10.0% local appreciation)).
- Oklahoma County population projected at +41% by 2050 — long-run rental-demand tailwind backs the buy-and-hold thesis.
- By year 2, paydown + projected appreciation supports a ~$58k cash-out refi (75% LTV) — recoverable capital for the next deal without selling this one.
Negotiation context
- Only 9 days on market — expect competitive offers; lowballing is unlikely to land.
- 3 sale attempts since 5y ago with the ask held roughly flat each time — persistent listings suggest the price (not the market) is what's stuck; bring a comps-based counter.
- Current owner paid $273k; 24% above their basis — modest negotiation headroom, anchor on the comps not their cost.
Risks & watch-outs
- Climate carrying-cost: extreme-heat days projected 7→19/yr by 2055 (HVAC capex compounding) — expect insurance premiums to compound above CPI over the hold.
Questions for the listing agent
- What do current leases actually rent for vs. the listed asking? Can we see a recent rent roll and the last 12 months of T-12 income?
- What does the HOA fee cover, when was the last increase, and are there any pending special assessments or reserve-fund shortfalls?
- Is there a deadline driving the sale (1031 exchange, divorce, estate, relocation)? That informs how much negotiation room exists.
- Schools are A-rated — typically a magnet for longer-tenancy family renters. What's the average tenant stay here, and is there a school-zone premium baked into asking?
- The area grade is low — what's the realistic commute time and amenity access for the typical tenant pool here? Any planned neighborhood developments (good or bad) we should know about?
- What's the average days-on-market for RENTAL listings here right now (not sales)? A rising rental-DOM trend means longer vacancies and softer asking-rent achievability than the comps imply.
- What's the recent tenant-quality profile in this submarket — average credit score on applications, eviction rate, late-payment / NSF rate, and stable-employment percentage? A property-management company in the area should have these aggregated.
- How much new for-sale + rental construction is in the pipeline within 1–3 miles? Heavy new supply typically softens prices + rents 12–24 months out; constrained supply supports both.
Investment metrics
- 1% rule
- 0.68% ✗
- Cap rate
- 4.51%
- Cash-on-cash
- -6.36%
- DSCR
- 0.72
- GRM
- 12.3
CMA / ARV
- ARV (on-the-fly)
- $316,332
- Comps found
- 6
Show comp detail 6 sales within ~0.75 mi
| Address | Dist | Beds/Ba | Sqft | Sold | Price | $/sf | Match |
|---|---|---|---|---|---|---|---|
| 8209 Lambert Way | 0.24mi | 3/2.0 | 1,518 (-3%) | 2mo | $325,000 | $214 | 82 |
| 5316 Lannister Ln | 0.09mi | 3/2.0 | 1,582 (+1%) | 17mo | $320,000 | $202 | 80 |
| 5301 Lannister Ln | 0.11mi | 4/2.0 (+1) | 1,655 (+6%) | 8mo | $335,000 | $202 | 74 |
| 5300 Lannister Ln | 0.11mi | 4/2.0 (+1) | 1,700 (+9%) | 9mo | $340,000 | $200 | 68 |
| 5233 Riverrun Ct | 0.14mi | 4/2.0 (+1) | 1,655 (+6%) | 14mo | $333,000 | $201 | 67 |
| 5317 Lannister Ln | 0.09mi | 3/2.0 | 1,718 (+10%) | 15mo | $327,495 | $191 | 67 |
Match score weights: distance 35% · size 25% · config 20% · recency 20%. Top-matched comps best support the ARV.
Projected returns pro-forma
10.0% appreciation · 3.0% rent growth · sell at horizon
- IRR
- 19.8%
- Equity multiple
- 2.61×
- Total profit
- $152,611
- Equity at exit
- $305,398
- IRR
- 18.1%
- Equity multiple
- 6.00×
- Total profit
- $474,649
- Equity at exit
- $658,602
Cash invested: $94,920 (down + closing). Projections, not guarantees.
Landlord ↔ Tenant lean methodology
- Overall (STATE)
- 83 Strongly Landlord-Friendly
- State Oklahoma
- 83 Strongly Landlord-Friendly · R+20
- County
- — inherits STATE
- City
- — inherits STATE
ZIP-level market 73007
- Home prices YoY
- 4.0%
- Active inventory
- 192
- Price-to-rent
- 12.3×
Monthly cashflow live
- Estimated rent
- $2,300 medium interval (Pro) →
- Mortgage (P&I)
- −$1,778
- Tax from tax record
- −$318 /mo · $3,816/yr
- Insurance
- −$141
- HOA
- −$83
- Vacancy / Maint / Mgmt
- −$483
- Net cashflow
- $-503
Break-even live
Sensitivity live
| Price | -10% $-311 | -5% $-407 | +0% $-503 | +5% $-599 | +10% $-695 |
|---|---|---|---|---|---|
| Rent | -10% $-685 | -5% $-594 | +0% $-503 | +5% $-412 | +10% $-321 |
| Rate | -1.0pp $-332 | -0.5pp $-417 | base $-503 | +0.5pp $-591 | +1.0pp $-680 |
UW: 25.0% down · 7.5% · 30yr · 1.5% tax · 5.0% vac · 8.0% maint · 8.0% mgmt
Financing live
Cash to close
- Down payment
- $84,750
- Closing costs
- $10,170
- Reserves months
- —
- Total cash needed
- —
Loan-product check · same deal, 3 products live
Conventional
25% down · 7.5% · 30yr
- Down + closing
- —
- Monthly P&I
- —
- Monthly cashflow
- —
- DSCR
- —
- Eligible?
- —
Personal DTI + credit; lowest rate.
DSCR
20% down · 8.5% · 30yr
- Down + closing
- —
- Monthly P&I
- —
- Monthly cashflow
- —
- DSCR
- —
- Eligible?
- —
No personal income docs; deal must DSCR.
Hard money
10% down · 12.0% · 12mo
- Down + closing
- —
- Monthly P&I
- —
- Monthly cashflow
- —
- DSCR
- —
- Eligible?
- —
Short-term bridge; refi at stabilization.
Rent comps 1 comps
| Address | Beds | Baths | Sqft | Rent | $/sqft | DOM | Units | Dist |
|---|---|---|---|---|---|---|---|---|
| 5216 Bing Cir Edmond, OK | 3.0 | 2.0 | 1631 | $2,300 | $1.41 | 19d | 1 | 0.17mi |
HOA detail
- Monthly dues
- $83 · $996/yr
- Likely covers
- watergascable
Listing history 7 events
-
2026-06-21days on market $339,000 Active 9 DOM
-
2026-06-18days on market $339,000 Active 6 DOM
-
2026-06-17days on market $339,000 Active 5 DOM
-
2026-06-16days on market $339,000 Active 4 DOM
-
2026-06-15days on market $339,000 Active 3 DOM
-
2026-06-13remarks 687-char remark
-
2026-06-13$339,000 Active 1 DOM
ⓘ Source: listings_history table (triggers on properties + properties_extension) + one-shot
backfill from property_details.listing_events for pre-trigger history.
Tax reassessment forecast OK · Resets to sale price
- Current annual tax
- $3,816 · $318/mo
- Projected year-2 tax
- $3,816 · $318/mo
- Expected delta
- $0/yr ($0/mo · 0.0%)
ⓘ Screening estimate from a state-policy table — verify with the county assessor before closing.
Climate risk First Street
- Flood 1/10 Low FEMA zone X (unshaded) · 0% chance over 30 yrs
- Wildfire 4/10 Moderate
- Heat 5/10 Major 7 d/yr ≥109°F today · 19 d/yr by 30 yrs out
- Wind 2/10 Low 4% chance of damaging wind over 30 yrs
- Air quality 2/10 Low 2 unhealthy d/yr today · 2 by 30 yrs out
Nearby sold comps map
Loading sold comps map…
Walkable amenities ~0.75 mi
Loading nearby amenities…
Taxation est. · year 1
- Rental income
- $27,600
- − Mortgage interest
- −$18,989
- − Property taxes
- −$3,816
- − Insurance
- −$1,695
- − Repairs & maintenance
- −$2,208
- − Management
- −$2,208
- − HOA
- −$996
- − Depreciation
- −$9,862
- Taxable loss
- −$12,174
- Est. tax savings @ 24.0%
- +$2,922
- After-tax cash flow
- $-3,115/yr
For passive investors: Depreciation is non-cash, so a rental often shows a tax loss while cash-flowing — sheltering income. Rental losses are passive: they offset passive income freely, and up to $25,000/yr can offset ordinary (W-2) income if you actively participate and your MAGI is under $100k (phasing out to $0 by $150k); unused losses carry forward. On sale, claimed depreciation is recaptured at up to 25%, and gains may owe capital-gains tax (a 1031 exchange can defer both). Figures are a year-1 estimate at your 24.0% rate — not tax advice; consult a CPA.
Schools (NCES district)
- District
- Edmond
- NCES district ID
- 4010590
- Math proficiency
- 38% ▼ -12.00%
- Reading proficiency
- 40% ▼ -12.00%
- Median HH income
- $73,212
- Composite
- 35.88/100
- National rank
- #4814
- State rank
- #11 of 270 in OK
Livability — Edmond
- Score
- 78/100
- State rank
- #6
- US rank
- #2383
Category grades
Schools grade is shown separately in the Schools card above.
Census & demographics
- Census place
- Edmond, OK
- City population
- 177,083
- Population (ZIP)
- 2,945
Population outlook (Oklahoma County) Hauer SSP2
- Today (2025)
- 911,875 people
- By 2030
- 982,413 · +7.7%
- By 2040
- 1,130,468 · +24.0%
- By 2050
- 1,288,422 · +41.3%
- By 2075
- 1,711,482 · +87.7%
- By 2100
- 2,088,448 · +129.0%
Race, ethnicity, and origin ACS 2023
- Neighborhood character
- Predominantly White (80%)
- Race & ethnicity
- White 80% Two or more races 15% Hispanic / Latino 5% Black 2%
- Common ancestry
- Lithuanian 5% Romanian 3% Italian 2%
- Foreign-born
- 2% · Canada
- Languages at home
- 94% English-only · Spanish 2% Other Asian/Pacific 1%
Political lean MEDSL · Oklahoma
- 2024 margin
- Toss-up / Even · D 48.0% · R 49.7% · Other 2.3%
- 2008→2024 swing
- +15.1pp toward D · 2008: -16.8pp · 2024: -1.7pp
- All cycles
- 2024: R+1.7 2020: R+1.1 2016: R+10.5 2012: R+16.7 2008: R+16.8
Not yet ingested
- Civics
- —
Market trends
- HPI YoY
- ▲ 12.99%
- Current HPI
- 336.6015
- Rent YoY
- —
- Metro
- —
- State GDP YoY
- ▲ 1.55%
- F500 in state
- 6
Industry mix (Fortune 500 HQ in OK)
| Industry | F500 HQs | Revenue |
|---|---|---|
| Energy | 3 | $48B |
|
||
Price history
+32.4% since first listed13 events — show timeline
- 2026-06-12 Listed $339,000 MLSOK
- 2023-08-09 Listing Removed — MLSOK
- 2023-07-17 Price Changed $348,350 MLSOK
- 2023-07-12 Listed $352,350 MLSOK
- 2021-06-17 Sold (Public Records) $273,000 Public Records
- 2021-06-15 Sold (MLS) $272,990 MLSOK
- 2021-05-04 Price Changed $272,990 MLSOK
- 2021-05-04 Pending — MLSOK
- 2021-05-03 Price Changed $274,990 MLSOK
- 2021-04-19 Price Changed $272,990 MLSOK
- 2021-03-05 Price Changed $267,990 MLSOK
- 2021-02-01 Price Changed $257,990 MLSOK
- 2021-01-27 Listed $255,990 MLSOK
Property tax history
+142.0%/yrLatest (2025): $3,816 · +5.1% YoY. Source: county tax records.
Cash-flow waterfall
monthlySold comps — $/sqft
last 12 mo · ≤1 miLoading sold comps…