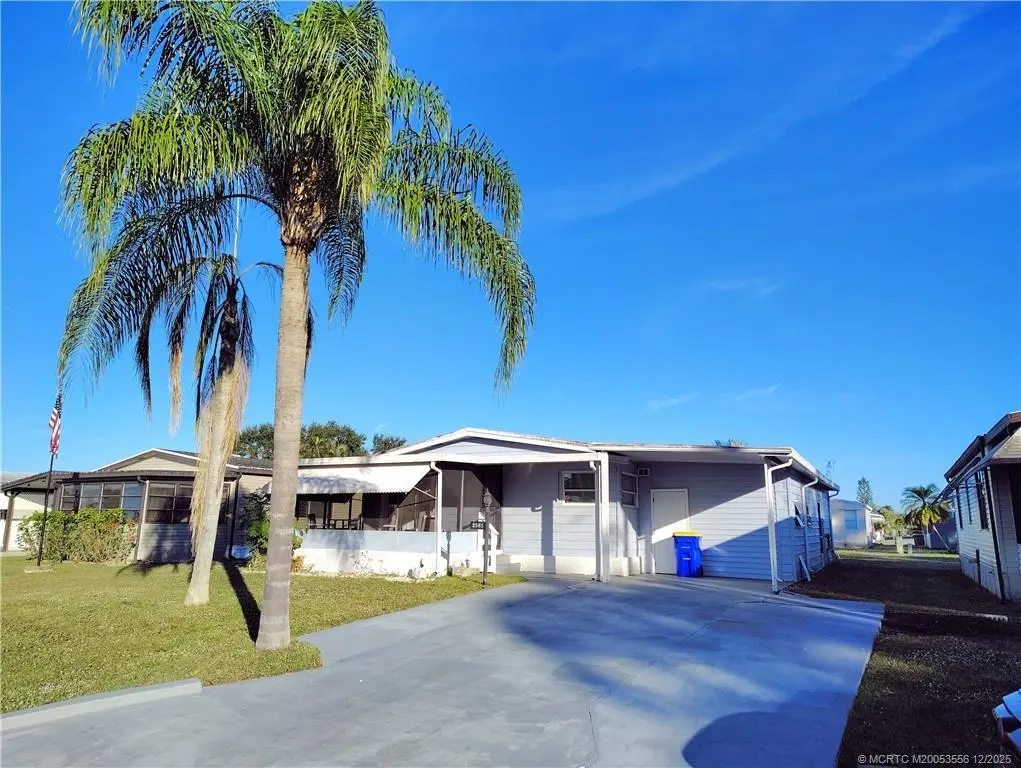
2581 SW Pontiac Pl · Palm City, FL
Flood risk 1/10 · Minimal
- FEMA flood zone
- X (unshaded)
- Chance of flooding over 30 yrs
- 0.0%
- Est. flood insurance / yr
- $507 – $1,088
Fire risk 3/10 · Minor
- Est. fire insurance / yr
- $947 – $1,759
Heat risk 10/10 · Severe
- Hot days now (above 107°F)
- 7 days/yr
- Hot days in 30 yrs
- 25 days/yr
Wind risk 10/10 · Severe
- Chance of severe wind over 30 yrs
- 99.0%
Air-quality risk 2/10 · Minimal
- Unhealthy air days now
- 1 days/yr
- Unhealthy air days in 30 yrs
- 1 days/yr
Risk factors via First Street. Map © Google.
Why this score? — see what drove the C+ grade
The composite is a weighted blend of 9 inputs, each scored 0–100. Each bar is that input's sub-score; the figure is the points it added to the 100-point composite (weight × sub-score).
- Cash flow +27.8/30.0
- DSCR +9.8/10.0
- 1% rule +8.4/10.0
- Schools +4.5/10.0
- ARV discount +4.1/15.0
- Livability +4.0/5.0
- Rent growth +3.2/5.0
- Condition / age +2.5/5.0
- Appreciation +0.0/10.0
$141,000
🖨 Deal sheet 📄 Offer letter ✓ Due diligence
Listing remarks MLS
Discover this pet friendly light & bright remodeled 2bd/2ba mfg. home in vibrant St Lucie Falls. Low HOA fee, you own the land. Skip the bank with owner financing available. Purchase would be subject to lease. Great opportunity to own a property with a great tenant already in place. Your updated kitchen offers a kitchen nook for eating, and is open to your living room. The nicely sized bedrooms with semi-updated bathrooms give you plenty of vanity space. Inside utility room with laundry tub opens to an extra room for storage, workshop, craft space. Your front screen porch offers a relaxing spot for morning coffee or refreshing solitude at the end of the day. This active retirement community offers two clubhouses, heated pools, billiards, one of which is on Pontiac. City water/sewer. Close to shopping, restaurants, doctors, and I-95.Background check and application plus interview required. 2 pets allowed.
Key facts
- Heated pools
- Remodeled
- Two clubhouses
Tags
Neighborhood map
What this means for you Summary
Snapshot
- This is a 2-bed/2.0-bath manufactured listed at $141k.
Deal economics
- At list price, monthly cash flow is $428 ($5k/yr) — positive.
- The deal already cash-flows at list — no discount required.
- Meets the 1% rule at list price ($2k rent vs $141k).
- Recommended offer: $124k (12.0% below list) — sets the bar for market timing.
- Cap rate 9.9% vs local median 2.6% in Palm City — top-decile yield for the area; either an underpriced asset or a hidden risk that comps aren't pricing in. Stress-test before assuming the spread holds.
Location & tenants
- Location reads 79/100 on livability (#140 in FL, #2,113 nationally) — a middle-class / working-renter tenant base. Strengths: schools A+, crime A+, employment A+; Watch: amenities F, commute F, cost of living F.
- Martin (suburban): math 52% / reading 53% proficiency, ranked #24 of 73 in FL (top 33%) — acceptable for families but not a draw, mixed tenant base, ~2y average lease.
- Market conditions: Rents rising (+2.7%/yr); 588 active listings in the ZIP; solid renter incomes; 737 units permitted in Martin County in 2024 (167 in 5+ unit buildings).
Forward outlook
- Local home prices are declining (-3.0%/yr); year-one equity from $975 of loan paydown is wiped out by about $4k of value loss. Plan a longer hold.
- Martin County population projected at +19% by 2050 — long-run rental-demand tailwind backs the buy-and-hold thesis.
- At projected returns (-3.0% appreciation + 2.7% rent growth), your $39k cash investment doubles in ~10 years — after that, you're playing with house money.
Negotiation context
- It's been on market 179 days — a 12% lower offer ($124k) is reasonable based on typical stale-listing flexibility.
- 16 sale attempts since 28y ago; this cycle's ask has dropped $10k (7%) from the opening price — seller is motivated, your offer sets the floor, not the list.
Risks & watch-outs
- Climate carrying-cost: severe wind risk, 99% chance of damaging wind over 30y; extreme-heat days projected 7→25/yr by 2055 (HVAC capex compounding) — expect insurance premiums to compound above CPI over the hold.
Questions for the listing agent
- It's been on market 179 days. Have you received any prior offers? Is the seller open to a 12% concession, seller financing, or rate buy-down credit?
- What does the HOA fee cover, when was the last increase, and are there any pending special assessments or reserve-fund shortfalls?
- Why hasn't it sold? Are there any deal-killer items the seller is aware of (foundation, flood, title, zoning, code violations)?
- Is there a deadline driving the sale (1031 exchange, divorce, estate, relocation)? That informs how much negotiation room exists.
- Schools are A-rated — typically a magnet for longer-tenancy family renters. What's the average tenant stay here, and is there a school-zone premium baked into asking?
- What's the average days-on-market for RENTAL listings here right now (not sales)? A rising rental-DOM trend means longer vacancies and softer asking-rent achievability than the comps imply.
- What's the recent tenant-quality profile in this submarket — average credit score on applications, eviction rate, late-payment / NSF rate, and stable-employment percentage? A property-management company in the area should have these aggregated.
- How much new for-sale + rental construction is in the pipeline within 1–3 miles? Heavy new supply typically softens prices + rents 12–24 months out; constrained supply supports both.
Investment metrics
- 1% rule
- 1.34% ✓
- Cap rate
- 9.94%
- Cash-on-cash
- 13.01%
- DSCR
- 1.58
- GRM
- 6.2
CMA / ARV
- ARV (median comp)
- $131,000
- List price
- $141,000
- Delta
- 7.63%
- Verdict
- FAIR
- Comps
- 13 within 1.0 mi
Show comp detail 7 sales within ~0.75 mi
| Address | Dist | Beds/Ba | Sqft | Sold | Price | $/sf | Match |
|---|---|---|---|---|---|---|---|
| 2596 SW Olds Pl | 0.04mi | 2/2.0 | 1,090 (+5%) | 12mo | $204,000 | $187 | 80 |
| 2554 SW Olds Pl | 0.03mi | 2/2.0 | 1,126 (+8%) | 11mo | $160,000 | $142 | 75 |
| 2671 SW Versailles Ter | 0.20mi | 2/2.0 | 948 (-9%) | 3mo | $180,000 | $190 | 73 |
| 2745 SW Toronado Trl | 0.18mi | 2/2.0 | 1,142 (+10%) | 2mo | $131,000 | $115 | 73 |
| 9353 SW Fleetwood Dr | 0.16mi | 2/2.0 | 1,152 (+11%) | 10mo | $115,000 | $100 | 66 |
| 8921 SW Chevy Cir | 0.33mi | 2/2.0 | 1,000 (-4%) | 19mo | $249,900 | $250 | 63 |
| 9273 SW Mary Dr | 0.72mi | 2/2.0 | 980 (-6%) | 5mo | $89,000 | $91 | 53 |
Match score weights: distance 35% · size 25% · config 20% · recency 20%. Top-matched comps best support the ARV.
Projected returns pro-forma
-3.0% appreciation · 2.71% rent growth · sell at horizon
- IRR
- 2.6%
- Equity multiple
- 1.10×
- Total profit
- $3,950
- Equity at exit
- $21,024
- IRR
- 11.9%
- Equity multiple
- 1.93×
- Total profit
- $36,647
- Equity at exit
- $12,191
Cash invested: $39,480 (down + closing). Projections, not guarantees.
Landlord ↔ Tenant lean methodology
- Overall (STATE)
- 87 Strongly Landlord-Friendly
- State Florida
- 87 Strongly Landlord-Friendly · R+3
- County
- — inherits STATE
- City
- — inherits STATE
ZIP-level market 34997
- Rents YoY
- 2.7%
- Active inventory
- 588
- Price-to-rent
- 6.2×
Monthly cashflow live
- Estimated rent
- $1,895 medium interval (Pro) →
- Mortgage (P&I)
- −$739
- Tax from tax record
- −$102 /mo · $1,220/yr
- Insurance
- −$59
- HOA
- −$169
- Vacancy / Maint / Mgmt
- −$398
- Net cashflow
- $428
Break-even live
UW: 25.0% down · 7.5% · 30yr · 1.5% tax · 5.0% vac · 8.0% maint · 8.0% mgmt
Financing live
Cash to close
- Down payment
- $35,250
- Closing costs
- $4,230
- Reserves months
- —
- Total cash needed
- —
Loan-product check · same deal, 3 products live
Conventional
25% down · 7.5% · 30yr
- Down + closing
- —
- Monthly P&I
- —
- Monthly cashflow
- —
- DSCR
- —
- Eligible?
- —
Personal DTI + credit; lowest rate.
DSCR
20% down · 8.5% · 30yr
- Down + closing
- —
- Monthly P&I
- —
- Monthly cashflow
- —
- DSCR
- —
- Eligible?
- —
No personal income docs; deal must DSCR.
Hard money
10% down · 12.0% · 12mo
- Down + closing
- —
- Monthly P&I
- —
- Monthly cashflow
- —
- DSCR
- —
- Eligible?
- —
Short-term bridge; refi at stabilization.
HOA detail
- Monthly dues
- $169 · $2,028/yr
- Likely covers
- watersewerpool
Listing history 50 events
-
2026-06-18days on market $141,000 Active 179 DOM
-
2026-06-17days on market $141,000 Active 178 DOM
-
2026-06-16days on market $141,000 Active 177 DOM
-
2026-06-15days on market $141,000 Active 176 DOM
-
2026-06-14days on market $141,000 Active 174 DOM
-
2026-06-13pricedays on market $141,000 Active 173 DOM
-
2026-06-10days on market $151,000 Active 171 DOM
-
2026-06-09days on market $151,000 Active 170 DOM
-
2026-06-08days on market $151,000 Active 169 DOM
-
2026-06-07days on market $151,000 Active 168 DOM
-
2026-06-03days on market $151,000 Active 164 DOM
-
2026-06-02days on market $151,000 Active 163 DOM
-
2026-06-01days on market $151,000 Active 162 DOM
-
2026-05-31days on market $151,000 Active 161 DOM
-
2026-05-31days on market $151,000 Active 160 DOM
-
2025-12-21$151,000 Active 923-char remark
Show marketing remark (923 chars)
Discover this pet friendly light & bright remodeled 2bd/2ba mfg. home in vibrant St Lucie Falls. Low HOA fee, you own the land. Skip the bank with owner financing available. Purchase would be subject to lease. Great opportunity to own a property with a great tenant already in place. Your updated kitchen offers a kitchen nook for eating, and is open to your living room. The nicely sized bedrooms with semi-updated bathrooms give you plenty of vanity space. Inside utility room with laundry tub opens to an extra room for storage, workshop, craft space. Your front screen porch offers a relaxing spot for morning coffee or refreshing solitude at the end of the day. This active retirement community offers two clubhouses, heated pools, billiards, one of which is on Pontiac. City water/sewer. Close to shopping, restaurants, doctors, and I-95.Background check and application plus interview required. 2 pets allowed.
-
2025-10-08soldstatus $130,000
-
2025-10-03soldstatus $130,000 Closed 261-char remark
Show marketing remark (261 chars)
Motivated Seller!! 2 Bedroom, 2 Bathroom, 1040 sq ft under air in the highly sought-after community of St. Lucie Falls. LOW HOA fee of $164 per month includes cable, two pools, two clubhouses, tennis/pickleball courts, bocce ball, billiards, and a workout room.
-
2025-09-19historical Active Under Contract 261-char remark
Show marketing remark (261 chars)
Motivated Seller!! 2 Bedroom, 2 Bathroom, 1040 sq ft under air in the highly sought-after community of St. Lucie Falls. LOW HOA fee of $164 per month includes cable, two pools, two clubhouses, tennis/pickleball courts, bocce ball, billiards, and a workout room.
-
2025-08-29status Active 261-char remark
Show marketing remark (261 chars)
Motivated Seller!! 2 Bedroom, 2 Bathroom, 1040 sq ft under air in the highly sought-after community of St. Lucie Falls. LOW HOA fee of $164 per month includes cable, two pools, two clubhouses, tennis/pickleball courts, bocce ball, billiards, and a workout room.
-
2025-08-28historical 261-char remark
Show marketing remark (261 chars)
Motivated Seller!! 2 Bedroom, 2 Bathroom, 1040 sq ft under air in the highly sought-after community of St. Lucie Falls. LOW HOA fee of $164 per month includes cable, two pools, two clubhouses, tennis/pickleball courts, bocce ball, billiards, and a workout room.
-
2025-03-28$150,000 Active 261-char remark
Show marketing remark (261 chars)
Motivated Seller!! 2 Bedroom, 2 Bathroom, 1040 sq ft under air in the highly sought-after community of St. Lucie Falls. LOW HOA fee of $164 per month includes cable, two pools, two clubhouses, tennis/pickleball courts, bocce ball, billiards, and a workout room.
-
2021-08-27soldstatus $115,000 Closed
-
2021-08-27soldstatus $115,000
-
2021-08-16status Pending
-
2021-07-09price $125,000
-
2021-07-09status Active
-
2021-05-13historical
-
2021-05-02status Pending
-
2021-04-06price $120,000
-
2021-02-19status Active
-
2020-12-18historical Contingent
-
2020-12-16status Active
-
2020-10-08historical Active Under Contract
-
2020-09-04status Active
-
2020-08-31status Pending
-
2020-07-23$125,000 Active
-
2019-07-02soldstatus $44,000 Closed
-
2019-05-22status Pending
-
2019-05-14$39,900 Active
-
2019-04-19historical
-
2019-03-21price $59,900
-
2019-03-08$73,000 Active
-
2019-03-05historical
-
2019-01-11$84,900 Active
-
2015-11-23historical
-
2015-11-13$49,900 Active
-
2015-10-11historical
-
2015-09-18price $49,900
-
2015-09-11$59,000 Active
ⓘ Source: listings_history table (triggers on properties + properties_extension) + one-shot
backfill from property_details.listing_events for pre-trigger history.
Tax reassessment forecast FL · Resets to sale price
- Current annual tax
- $1,220 · $102/mo
- Projected year-2 tax
- $1,220 · $102/mo
- Expected delta
- $0/yr ($0/mo · 0.0%)
ⓘ Screening estimate from a state-policy table — verify with the county assessor before closing.
Climate risk First Street
- Flood 1/10 Low FEMA zone X (unshaded) · 0% chance over 30 yrs
- Wildfire 3/10 Moderate
- Heat 10/10 Extreme 7 d/yr ≥107°F today · 25 d/yr by 30 yrs out
- Wind 10/10 Extreme 99% chance of damaging wind over 30 yrs
- Air quality 2/10 Low 1 unhealthy d/yr today · 1 by 30 yrs out
Nearby sold comps map
Loading sold comps map…
Walkable amenities ~0.75 mi
Loading nearby amenities…
Taxation est. · year 1
- Rental income
- $22,737
- − Mortgage interest
- −$7,898
- − Property taxes
- −$1,220
- − Insurance
- −$705
- − Repairs & maintenance
- −$1,819
- − Management
- −$1,819
- − HOA
- −$2,028
- − Depreciation
- −$4,102
- Taxable income
- $3,146
- Est. tax owed @ 24.0%
- −$755
- After-tax cash flow
- $4,381/yr
For passive investors: Depreciation is non-cash, so a rental often shows a tax loss while cash-flowing — sheltering income. Rental losses are passive: they offset passive income freely, and up to $25,000/yr can offset ordinary (W-2) income if you actively participate and your MAGI is under $100k (phasing out to $0 by $150k); unused losses carry forward. On sale, claimed depreciation is recaptured at up to 25%, and gains may owe capital-gains tax (a 1031 exchange can defer both). Figures are a year-1 estimate at your 24.0% rate — not tax advice; consult a CPA.
Schools (NCES district)
- District
- Martin
- NCES district ID
- 1201290
- Math proficiency
- 52% ▼ -14.00%
- Reading proficiency
- 53% ▼ -4.00%
- Median HH income
- $52,482
- Composite
- 45.1/100
- National rank
- #2690
- State rank
- #24 of 73 in FL
Livability — Palm City
- Score
- 79/100
- State rank
- #140
- US rank
- #2113
Category grades
Schools grade is shown separately in the Schools card above.
Census & demographics
- County
- Martin County · 165,223 people
- City population
- 30,592
- Metro
- Port St. Lucie, FL
- Population (ZIP)
- 47,075
- Household income
- $78,136
- Rent vs Own
- Severe rent burden
- 1323.0
Population outlook (Martin County) Hauer SSP2
- Today (2025)
- 172,383 people
- By 2030
- 180,192 · +4.5%
- By 2040
- 194,114 · +12.6%
- By 2050
- 204,992 · +18.9%
- By 2075
- 229,641 · +33.2%
- By 2100
- 232,146 · +34.7%
Race, ethnicity, and origin ACS 2023
- Neighborhood character
- Predominantly White (74%)
- Race & ethnicity
- White 74% Hispanic / Latino 19% Two or more races 9% Black 3% Asian 1%
- Hispanic origin (detail)
- Mexican 4% Puerto Rican 2% Cuban 3%
- Common ancestry
- Romanian 3% Lithuanian 3% Slovak 2%
- Foreign-born
- 14% · Canada, Jamaica, China
- Languages at home
- 81% English-only · Spanish 14% French/Haitian/Cajun 2% Other Indo-European 1%
Political lean MEDSL · Martin
- 2024 margin
- Solid R (+31.1) · D 34.1% · R 65.2%
- 2008→2024 swing
- -17.5pp toward R · 2008: -13.6pp · 2024: -31.1pp
- All cycles
- 2024: R+31.1 2020: R+24.6 2016: R+26.9 2012: R+22.9 2008: R+13.6
Not yet ingested
- Civics
- —
Market trends
- HPI YoY
- ▼ -319.78%
- Current HPI
- 336.7717
- Rent YoY
- ▲ 2.71%
- Metro
- Port St. Lucie, FL
- State GDP YoY
- ▲ 3.28%
- F500 in state
- 36
Industry mix (Fortune 500 HQ in FL)
| Industry | F500 HQs | Revenue |
|---|---|---|
| Industrial Technology | 2 | $29B |
|
||
| Insurance | 2 | $17B |
|
||
| Retail | 1 | $60B |
|
||
| Technology Distribution | 1 | $58B |
|
||
| Homebuilding | 1 | $35B |
|
||
| Technology Manufacturing | 1 | $35B |
|
||
Price history
+820.7% since first listed43 events — show timeline
- 2025-12-21 Listed $151,000 MCRTC
- 2025-10-08 Sold (Public Records) $130,000 Public Records
- 2025-10-03 Sold (MLS) $130,000 Beaches MLS
- 2025-09-19 Contingent — Beaches MLS
- 2025-08-29 Relisted — Beaches MLS
- 2025-08-28 Listing Removed — Beaches MLS
- 2025-03-28 Listed $150,000 Beaches MLS
- 2021-08-27 Sold (Public Records) $115,000 Public Records
- 2021-08-27 Sold (MLS) $115,000 Beaches MLS
- 2021-08-16 Pending — Beaches MLS
- 2021-07-09 Price Changed $125,000 Beaches MLS
- 2021-07-09 Relisted — Beaches MLS
- 2021-05-13 Listing Removed — Beaches MLS
- 2021-05-02 Pending — Beaches MLS
- 2021-04-06 Price Changed $120,000 Beaches MLS
- 2021-02-19 Relisted — Beaches MLS
- 2020-12-18 Contingent — Beaches MLS
- 2020-12-16 Relisted — Beaches MLS
- 2020-10-08 Contingent — Beaches MLS
- 2020-09-04 Relisted — Beaches MLS
- 2020-08-31 Pending — Beaches MLS
- 2020-07-23 Listed $125,000 Beaches MLS
- 2019-07-02 Sold (MLS) $44,000 Beaches MLS
- 2019-05-22 Pending — Beaches MLS
- 2019-05-14 Listed $39,900 Beaches MLS
- 2019-04-19 Listing Removed — MCRTC
- 2019-03-21 Price Changed $59,900 MCRTC
- 2019-03-08 Listed $73,000 MCRTC
- 2019-03-05 Listing Removed — MCRTC
- 2019-01-11 Listed $84,900 MCRTC
- 2015-11-23 Listing Removed — Beaches MLS
- 2015-11-13 Listed $49,900 Beaches MLS
- 2015-10-11 Listing Removed — Beaches MLS
- 2015-09-18 Price Changed $49,900 Beaches MLS
- 2015-09-11 Listed $59,000 Beaches MLS
- 2015-08-04 Listing Removed — Beaches MLS
- 2015-02-19 Price Changed $49,900 Beaches MLS
- 2014-08-13 Listed $59,900 Beaches MLS
- 2006-03-09 Listing Removed — MCRTC
- 2005-09-09 Listed $124,900 MCRTC
- 1998-11-08 Listing Removed — MCRTC
- 1998-05-08 Listed $58,900 MCRTC
- 1984-10-01 Sold (Public Records) $16,400 Public Records
Property tax history
+1.1%/yrLatest (2025): $1,220 · +1.1% YoY. Source: county tax records.
Cash-flow waterfall
monthlySold comps — $/sqft
last 12 mo · ≤1 miLoading sold comps…