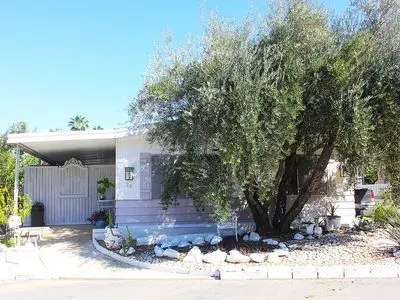
26 Diamond E Dr · Palm Desert, CA
Flood risk 1/10 · Minimal
- FEMA flood zone
- X
- Chance of flooding over 30 yrs
- 0.0%
- Est. flood insurance / yr
- $507 – $1,088
Fire risk 5/10 · Moderate
- Est. fire insurance / yr
- $659 – $1,223
Heat risk 9/10 · Severe
- Hot days now (above 107°F)
- 10 days/yr
- Hot days in 30 yrs
- 28 days/yr
Wind risk 1/10 · Minimal
- Chance of severe wind over 30 yrs
- —
Air-quality risk 4/10 · Minor
- Unhealthy air days now
- 5 days/yr
- Unhealthy air days in 30 yrs
- 6 days/yr
Risk factors via First Street. Map © Google.
Why this score? — see what drove the B+ grade
The composite is a weighted blend of 9 inputs, each scored 0–100. Each bar is that input's sub-score; the figure is the points it added to the 100-point composite (weight × sub-score).
- Cash flow +30.0/30.0
- ARV discount +15.0/15.0
- 1% rule +10.0/10.0
- DSCR +10.0/10.0
- Schools +3.8/10.0
- Rent growth +2.9/5.0
- Livability +2.6/5.0
- Condition / age +2.5/5.0
- Appreciation +0.0/10.0
$139,000
🖨 Deal sheet 📄 Offer letter ✓ Due diligence
Listing remarks MLS
Price Reduced !!! Submit all offers !!! Best buy in Silver Spur !! Dynamic mountain views, pride of ownership, clean, Southwest Palm Desert, family park, lrg outdoor spa, great entertaining area, close to club house, quiet neighborhood, great school district, close to El Paseo shopping and mall, across the street from Big Horn C. C.
Key facts
- Built 1976
Neighborhood map
What this means for you Summary
Snapshot
- This is a 3-bed/2.0-bath manufactured listed at $139k.
Deal economics
- At list price, monthly cash flow is $2k ($24k/yr) — positive.
- The deal already cash-flows at list — no discount required.
- Meets the 1% rule at list price ($4k rent vs $139k).
- Cap rate 23.5% vs local median 3.5% in Palm Desert — top-decile yield for the area; either an underpriced asset or a hidden risk that comps aren't pricing in. Stress-test before assuming the spread holds.
Location & tenants
- Location reads 51/100 on livability (#1,050 in CA) — a working-class tenant base; expect higher turnover. Strengths: schools A-, employment B+, housing B; Watch: crime D, amenities F, commute F.
- Desert Sands Unified (suburban): math 31% / reading 56% proficiency, ranked #199 of 517 in CA (top 38%) — families likely to look elsewhere, expect single-tenant / working-renter base with shorter leases.
- Market conditions: Rents rising (+1.6%/yr); 545 active listings in the ZIP; 33 comparable units currently listed for rent nearby; rentals at typical pace (median 24d on market — plan ~3-4 weeks tenant-placement turnaround); 9,195 units permitted in Riverside County in 2024 (1,512 in 5+ unit buildings).
- At $3,741/mo this rent would consume 64% of the median local household income ($70k/yr) (locally 1734% of renters already pay >50% of income on rent) — very limited rent-growth headroom before tenants either downsize or default.
Forward outlook
- Local home prices are declining (-3.0%/yr); year-one equity from $961 of loan paydown is wiped out by about $4k of value loss. Plan a longer hold.
- Riverside County population projected at +22% by 2050 — long-run rental-demand tailwind backs the buy-and-hold thesis.
- At projected returns (-3.0% appreciation + 1.6% rent growth), your $39k cash investment doubles in ~2 years — after that, you're playing with house money.
Negotiation context
- Only 1 days on market — expect competitive offers; lowballing is unlikely to land.
- 4 sale attempts since 21y ago with the ask held roughly flat each time — persistent listings suggest the price (not the market) is what's stuck; bring a comps-based counter.
- Current owner paid $14k; list at $139k implies a 893% gain — meaningful room to come down on a strong offer.
Risks & watch-outs
- Climate carrying-cost: moderate wildfire risk; extreme-heat days projected 10→28/yr by 2055 (HVAC capex compounding) — expect insurance premiums to compound above CPI over the hold.
Questions for the listing agent
- Built in 1976 — when were the roof, HVAC, electrical panel, plumbing, and water heater last replaced?
- Is there a deadline driving the sale (1031 exchange, divorce, estate, relocation)? That informs how much negotiation room exists.
- Schools are A-rated — typically a magnet for longer-tenancy family renters. What's the average tenant stay here, and is there a school-zone premium baked into asking?
- Crime grade is D in this area — have there been break-ins, vandalism, or insurance claims at this property in the last 3 years? What carrier currently insures it and at what premium?
- What's the average days-on-market for RENTAL listings here right now (not sales)? A rising rental-DOM trend means longer vacancies and softer asking-rent achievability than the comps imply.
- What's the recent tenant-quality profile in this submarket — average credit score on applications, eviction rate, late-payment / NSF rate, and stable-employment percentage? A property-management company in the area should have these aggregated.
- How much new for-sale + rental construction is in the pipeline within 1–3 miles? Heavy new supply typically softens prices + rents 12–24 months out; constrained supply supports both.
Investment metrics
- 1% rule
- 2.69% ✓
- Cap rate
- 23.51%
- Cash-on-cash
- 61.50%
- DSCR
- 3.74
- GRM
- 3.1
CMA / ARV
- ARV (on-the-fly)
- $219,072
- Comps found
- 12
Show comp detail 12 sales within ~0.75 mi
| Address | Dist | Beds/Ba | Sqft | Sold | Price | $/sf | Match |
|---|---|---|---|---|---|---|---|
| 49305 Highway 74 #86 | 0.18mi | 2/2.0 (-1) | 1,344 (0%) | 3mo | $225,000 | $167 | 84 |
| 49305 Hwy 74 #89 | 0.11mi | 2/2.0 (-1) | 1,440 (+7%) | 3mo | $131,000 | $91 | 75 |
| 23 Rustic Rock Ln | 0.08mi | 2/2.0 (-1) | 1,440 (+7%) | 6mo | $260,000 | $181 | 74 |
| 49305 Highway 74 Spc 33 | 0.18mi | 2/2.0 (-1) | 1,440 (+7%) | 0mo | $235,000 | $163 | 74 |
| 49305 Highway 74 #6 | 0.18mi | 2/2.0 (-1) | 1,440 (+7%) | 3mo | $248,500 | $173 | 72 |
| 49305 Highway 74 #173 | 0.16mi | 2/2.0 (-1) | 1,416 (+5%) | 8mo | $260,000 | $184 | 72 |
| 49305 Highway 74 #11 | 0.17mi | 2/2.0 (-1) | 1,440 (+7%) | 6mo | $208,500 | $145 | 70 |
| 49305 Highway 74 #117 | 0.16mi | 2/2.0 (-1) | 1,440 (+7%) | 9mo | $147,500 | $102 | 68 |
| 49305 Highway 74 #4 | 0.18mi | 2/2.0 (-1) | 1,488 (+11%) | 1mo | $229,000 | $154 | 68 |
| 25 Pampas Ln | 0.17mi | 2/2.0 (-1) | 1,536 (+14%) | 2mo | $155,000 | $101 | 61 |
| 49305 Highway 74 #158 | 0.16mi | 2/2.0 (-1) | 1,536 (+14%) | 3mo | $290,000 | $189 | 61 |
| 49305 Ca-74 #151 | 0.16mi | 2/2.0 (-1) | 1,536 (+14%) | 9mo | $144,000 | $94 | 56 |
Match score weights: distance 35% · size 25% · config 20% · recency 20%. Top-matched comps best support the ARV.
Projected returns pro-forma
-3.0% appreciation · 1.6% rent growth · sell at horizon
- IRR
- 58.8%
- Equity multiple
- 3.55×
- Total profit
- $99,374
- Equity at exit
- $20,725
- IRR
- 63.1%
- Equity multiple
- 6.90×
- Total profit
- $229,610
- Equity at exit
- $12,018
Cash invested: $38,920 (down + closing). Projections, not guarantees.
Landlord ↔ Tenant lean methodology
- Overall (STATE)
- 18 Strongly Tenant-Friendly
- State California
- 18 Strongly Tenant-Friendly · D+13
- County
- — inherits STATE
- City
- — inherits STATE
ZIP-level market 92260
- Rents YoY
- 1.6%
- Active inventory
- 545
- Price-to-rent
- 3.1×
Monthly cashflow live
- Estimated rent
- $3,741 high interval (Pro) →
- Mortgage (P&I)
- −$729
- Tax est. 1.5%
- −$174 /mo · $2,085/yr
- Insurance
- −$58
- HOA
- −$0
- Vacancy / Maint / Mgmt
- −$786
- Net cashflow
- $1,995
Break-even live
UW: 25.0% down · 7.5% · 30yr · 1.5% tax · 5.0% vac · 8.0% maint · 8.0% mgmt
Financing live
Cash to close
- Down payment
- $34,750
- Closing costs
- $4,170
- Reserves months
- —
- Total cash needed
- —
Loan-product check · same deal, 3 products live
Conventional
25% down · 7.5% · 30yr
- Down + closing
- —
- Monthly P&I
- —
- Monthly cashflow
- —
- DSCR
- —
- Eligible?
- —
Personal DTI + credit; lowest rate.
DSCR
20% down · 8.5% · 30yr
- Down + closing
- —
- Monthly P&I
- —
- Monthly cashflow
- —
- DSCR
- —
- Eligible?
- —
No personal income docs; deal must DSCR.
Hard money
10% down · 12.0% · 12mo
- Down + closing
- —
- Monthly P&I
- —
- Monthly cashflow
- —
- DSCR
- —
- Eligible?
- —
Short-term bridge; refi at stabilization.
Rent comps 33 comps
| Address | Beds | Baths | Sqft | Rent | $/sqft | DOM | Units | Dist |
|---|---|---|---|---|---|---|---|---|
| 73280 Avenida Descanso Palm Desert, CA | 3.0 | 2.0 | 1290 | $4,250 | $3.29 | 2d | 1 | 0.30mi |
| 72304 Blueridge Ct Palm Desert, CA | 2.0 | 2.0 | 1786 | $4,000 | $2.24 | 10d | 1 | 0.35mi |
| 48950 Desert Flower Dr Palm Desert, CA | 3.0 | 2.5 | 1348 | $5,000 | $3.71 | 1d | 1 | 0.37mi |
| 48828 Desert Flower Dr Palm Desert, CA | 2.0 | 1.0 | 1118 | $2,450 | $2.19 | 43d | 1 | 0.41mi |
| 48790 Desert Flower Dr Palm Desert, CA | 3.0 | 2.5 | 1348 | $2,500 | $1.85 | 24d | 1 | 0.43mi |
| 48790 Desert Flower Dr Palm Desert, CA | 3.0 | 2.5 | 1348 | $2,500 | $1.85 | 1d | 1 | 0.43mi |
| 48980 Wildwood Ln Palm Desert, CA | 2.0 | 2.0 | 1184 | $2,795 | $2.36 | 43d | 1 | 0.46mi |
| 48728 Desert Flower Dr Palm Desert, CA | 3.0 | 2.0 | 1348 | $2,400 | $1.78 | 24d | 1 | 0.46mi |
| 72417 Rolling Knolls Dr Palm Desert, CA | 3.0 | 2.0 | 1548 | $6,500 | $4.20 | 43d | 1 | 0.49mi |
| 72346 Sommerset Dr Palm Desert, CA | 2.0 | 2.0 | 1440 | $3,950 | $2.74 | 43d | 1 | 0.55mi |
| 48624 Moon Terrace Ln Palm Desert, CA | 2.0 | 2.0 | 1184 | $2,600 | $2.20 | 15d | 1 | 0.57mi |
| 72350 Rim Dr Palm Desert, CA | 3.0 | 3.0 | 1744 | $3,800 | $2.18 | 15d | 1 | 0.64mi |
| 72409 Glenview Cir Palm Desert, CA | 3.0 | 2.0 | 1786 | $2,700 | $1.51 | 18d | 1 | 0.67mi |
| 72499 Desert Flower Dr Palm Desert, CA | 3.0 | 2.0 | 1786 | $3,400 | $1.90 | 43d | 1 | 0.74mi |
| 73103 Ajo Ln Palm Desert, CA | 2.0 | 3.0 | 1689 | $8,250 | $4.88 | 1d | 1 | 0.79mi |
| 48624 Torrito Ct Palm Desert, CA | 2.0 | 2.0 | 1745 | $7,000 | $4.01 | 1d | 1 | 0.89mi |
| 73153 Ajo Ln Palm Desert, CA | 2.0 | 2.0 | 1585 | $4,500 | $2.84 | 3d | 1 | 1.03mi |
| 72818 Skyward Way Palm Desert, CA | 3.0 | 2.0 | 1810 | $4,000 | $2.21 | 43d | 1 | 1.11mi |
| 73422 Irontree Dr Palm Desert, CA | 2.0 | 2.5 | 1502 | $3,500 | $2.33 | 4d | 1 | 1.19mi |
| 73407 Foxtail Ln Palm Desert, CA | 2.0 | 2.0 | 1426 | $2,600 | $1.82 | 43d | 1 | 1.19mi |
| 73405 Foxtail Ln Palm Desert, CA | 3.0 | 2.5 | 1525 | $4,000 | $2.62 | 43d | 1 | 1.19mi |
| 73416 Mariposa Dr Palm Desert, CA | 2.0 | 2.0 | 1685 | $5,000 | $2.97 | 43d | 1 | 1.19mi |
| 73429 Foxtail Ln Palm Desert, CA | 2.0 | 3.0 | 1525 | $3,250 | $2.13 | 43d | 1 | 1.23mi |
| 73441 Foxtail Ln Palm Desert, CA | 2.0 | 2.0 | 1426 | $3,495 | $2.45 | 43d | 1 | 1.24mi |
| 73446 Dalea Ln Palm Desert, CA | 2.0 | 2.0 | 1202 | $6,500 | $5.41 | 17d | 1 | 1.29mi |
| 73335 Oriole Ct Palm Desert, CA | 2.0 | 2.0 | 1700 | $6,500 | $3.82 | 43d | 1 | 1.32mi |
| 73476 Dalea Ln Palm Desert, CA | 2.0 | 2.0 | 1271 | $5,000 | $3.93 | 43d | 1 | 1.33mi |
| 73503 Foxtail Ln Palm Desert, CA | 2.0 | 3.0 | 1502 | $2,800 | $1.86 | 18d | 1 | 1.35mi |
| 48910 Noline Pl Palm Desert, CA | 2.0 | 2.0 | 1512 | $7,000 | $4.63 | 3d | 1 | 1.38mi |
| 72546 Edgehill Dr #4 Palm Desert, CA | 2.0 | 1.0 | 924 | $2,330 | $2.52 | 24d | 1 | 1.40mi |
| 73680 Irontree Dr Palm Desert, CA | 2.0 | 2.5 | 1819 | $6,500 | $3.57 | 3d | 1 | 1.43mi |
| 48885 Mariposa Dr Palm Desert, CA | 2.0 | 2.0 | 1164 | $6,900 | $5.93 | 3d | 1 | 1.44mi |
| 73409 Little Bend Trl Palm Desert, CA | 3.0 | 3.0 | 1847 | $4,000 | $2.17 | 24d | 1 | 1.44mi |
Listing history 13 events
-
2026-05-26$139,000 Active
-
2012-05-21historical
-
2011-12-08$30,000 Active
-
2010-02-15soldstatus $14,000 Closed 334-char remark
Show marketing remark (334 chars)
Price Reduced !!! Submit all offers !!! Best buy in Silver Spur !! Dynamic mountain views, pride of ownership, clean, Southwest Palm Desert, family park, lrg outdoor spa, great entertaining area, close to club house, quiet neighborhood, great school district, close to El Paseo shopping and mall, across the street from Big Horn C. C.
-
2010-01-10historical 334-char remark
Show marketing remark (334 chars)
Price Reduced !!! Submit all offers !!! Best buy in Silver Spur !! Dynamic mountain views, pride of ownership, clean, Southwest Palm Desert, family park, lrg outdoor spa, great entertaining area, close to club house, quiet neighborhood, great school district, close to El Paseo shopping and mall, across the street from Big Horn C. C.
-
2010-01-04price $14,900 334-char remark
Show marketing remark (334 chars)
Price Reduced !!! Submit all offers !!! Best buy in Silver Spur !! Dynamic mountain views, pride of ownership, clean, Southwest Palm Desert, family park, lrg outdoor spa, great entertaining area, close to club house, quiet neighborhood, great school district, close to El Paseo shopping and mall, across the street from Big Horn C. C.
-
2009-12-09price $19,900 334-char remark
Show marketing remark (334 chars)
Price Reduced !!! Submit all offers !!! Best buy in Silver Spur !! Dynamic mountain views, pride of ownership, clean, Southwest Palm Desert, family park, lrg outdoor spa, great entertaining area, close to club house, quiet neighborhood, great school district, close to El Paseo shopping and mall, across the street from Big Horn C. C.
-
2009-10-30price $24,900 334-char remark
Show marketing remark (334 chars)
Price Reduced !!! Submit all offers !!! Best buy in Silver Spur !! Dynamic mountain views, pride of ownership, clean, Southwest Palm Desert, family park, lrg outdoor spa, great entertaining area, close to club house, quiet neighborhood, great school district, close to El Paseo shopping and mall, across the street from Big Horn C. C.
-
2009-09-26price $29,000 334-char remark
Show marketing remark (334 chars)
Price Reduced !!! Submit all offers !!! Best buy in Silver Spur !! Dynamic mountain views, pride of ownership, clean, Southwest Palm Desert, family park, lrg outdoor spa, great entertaining area, close to club house, quiet neighborhood, great school district, close to El Paseo shopping and mall, across the street from Big Horn C. C.
-
2009-08-05$35,000 Active 334-char remark
Show marketing remark (334 chars)
Price Reduced !!! Submit all offers !!! Best buy in Silver Spur !! Dynamic mountain views, pride of ownership, clean, Southwest Palm Desert, family park, lrg outdoor spa, great entertaining area, close to club house, quiet neighborhood, great school district, close to El Paseo shopping and mall, across the street from Big Horn C. C.
-
2005-10-16historical
-
2005-10-08$67,200
ⓘ Source: listings_history table (triggers on properties + properties_extension) + one-shot
backfill from property_details.listing_events for pre-trigger history.
Climate risk First Street
- Flood 1/10 Low FEMA zone X · 0% chance over 30 yrs
- Wildfire 5/10 Major
- Heat 9/10 Extreme 10 d/yr ≥107°F today · 28 d/yr by 30 yrs out
- Wind 1/10 Low
- Air quality 4/10 Moderate 5 unhealthy d/yr today · 6 by 30 yrs out
Nearby sold comps map
Loading sold comps map…
Walkable amenities ~0.75 mi
Loading nearby amenities…
Taxation est. · year 1
- Rental income
- $44,889
- − Mortgage interest
- −$7,786
- − Property taxes
- −$2,085
- − Insurance
- −$695
- − Repairs & maintenance
- −$3,591
- − Management
- −$3,591
- − Depreciation
- −$4,044
- Taxable income
- $23,097
- Est. tax owed @ 24.0%
- −$5,543
- After-tax cash flow
- $18,392/yr
For passive investors: Depreciation is non-cash, so a rental often shows a tax loss while cash-flowing — sheltering income. Rental losses are passive: they offset passive income freely, and up to $25,000/yr can offset ordinary (W-2) income if you actively participate and your MAGI is under $100k (phasing out to $0 by $150k); unused losses carry forward. On sale, claimed depreciation is recaptured at up to 25%, and gains may owe capital-gains tax (a 1031 exchange can defer both). Figures are a year-1 estimate at your 24.0% rate — not tax advice; consult a CPA.
Schools (NCES district)
- District
- Desert Sands Unified
- NCES district ID
- 0611110
- Math proficiency
- 31% ▼ -4.00%
- Reading proficiency
- 56% ▲ 7.00%
- Median HH income
- $54,957
- Composite
- 37.77/100
- National rank
- #4346
- State rank
- #199 of 517 in CA
Livability — Palm Desert
- Score
- 51/100
- State rank
- #1050
- US rank
- #25164
Category grades
Schools grade is shown separately in the Schools card above.
Census & demographics
- Census place
- Palm Desert, CA
- County
- Riverside County · 2,287,001 people
- City population
- 58,615
- Metro
- Riverside-San Bernardino-Ontario, CA
- Population (ZIP)
- 30,523
- Household income
- $70,091
- Rent vs Own
- Severe rent burden
- 1734.0
Population outlook (Riverside County) Hauer SSP2
- Today (2025)
- 2,664,475 people
- By 2030
- 2,802,692 · +5.2%
- By 2040
- 3,050,904 · +14.5%
- By 2050
- 3,256,783 · +22.2%
- By 2075
- 3,655,058 · +37.2%
- By 2100
- 3,766,594 · +41.4%
Race, ethnicity, and origin ACS 2023
- Neighborhood character
- Majority White (61%)
- Race & ethnicity
- White 61% Hispanic / Latino 31% Two or more races 20% Asian 4% Black 2%
- Hispanic origin (detail)
- Mexican 25%
- Common ancestry
- Italian 4% Lithuanian 3% Slovak 2%
- Foreign-born
- 18% · Canada, South Korea, Vietnam
- Languages at home
- 73% English-only · Spanish 22% French/Haitian/Cajun 1% Other Indo-European 1%
Political lean MEDSL · Riverside
- 2024 margin
- Toss-up / Even · D 48.0% · R 49.3% · Other 2.6%
- 2008→2024 swing
- -3.6pp toward R · 2008: 2.3pp · 2024: -1.3pp
- All cycles
- 2024: R+1.3 2020: D+8.0 2016: D+4.3 2012: R+0.4 2008: D+2.3
Not yet ingested
- Civics
- —
Market trends
- HPI YoY
- ▼ -364.94%
- Current HPI
- 294.9425
- Rent YoY
- ▲ 1.60%
- Metro
- Riverside-San Bernardino-Ontario, CA
- State GDP YoY
- ▲ 3.21%
- F500 in state
- 116
Industry mix (Fortune 500 HQ in CA)
| Industry | F500 HQs | Revenue |
|---|---|---|
| Technology | 27 | $1,492B |
|
||
| Financial Services | 3 | $174B |
|
||
| Retail | 3 | $44B |
|
||
| Insurance | 3 | $26B |
|
||
| Media / Entertainment | 2 | $115B |
|
||
| Pharmaceuticals / Biotech | 2 | $62B |
|
||
Price history
+106.8% since first listed13 events — show timeline
- 2026-05-26 Listed $139,000 FSBO.com
- 2012-05-21 Listing Removed — GPSMLS
- 2011-12-08 Listed $30,000 GPSMLS
- 2010-02-15 Sold (MLS) $14,000 GPSMLS
- 2010-02-15 Sold (MLS) $14,000 GPSMLS
- 2010-01-10 Listing Removed — GPSMLS
- 2010-01-04 Price Changed $14,900 GPSMLS
- 2009-12-09 Price Changed $19,900 GPSMLS
- 2009-10-30 Price Changed $24,900 GPSMLS
- 2009-09-26 Price Changed $29,000 GPSMLS
- 2009-08-05 Listed $35,000 GPSMLS
- 2005-10-16 Listing Removed — GPSMLS
- 2005-10-08 Listed $67,200 GPSMLS
Property tax history
-0.9%/yrLatest (2025): $169 · +2.9% YoY. Source: county tax records.
Cash-flow waterfall
monthlySold comps — $/sqft
last 12 mo · ≤1 miLoading sold comps…