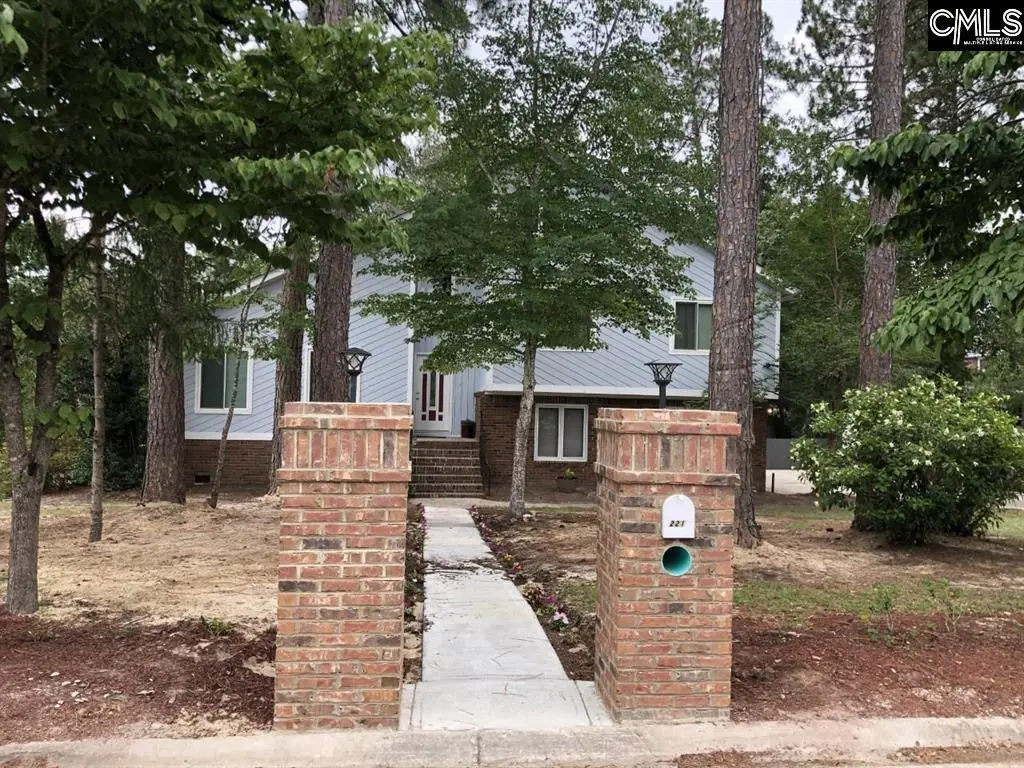
221 Hickory Hill Trl · Columbia, SC
Flood risk 1/10 · Minimal
- FEMA flood zone
- X (unshaded)
- Chance of flooding over 30 yrs
- 0.0%
- Est. flood insurance / yr
- $507 – $1,088
Fire risk 4/10 · Minor
- Est. fire insurance / yr
- $783 – $1,453
Heat risk 6/10 · Moderate
- Hot days now (above 107°F)
- 7 days/yr
- Hot days in 30 yrs
- 16 days/yr
Wind risk 6/10 · Moderate
- Chance of severe wind over 30 yrs
- 68.0%
Air-quality risk 3/10 · Minor
- Unhealthy air days now
- 3 days/yr
- Unhealthy air days in 30 yrs
- 3 days/yr
Risk factors via First Street. Map © Google.
Why this score? — see what drove the D- grade
The composite is a weighted blend of 9 inputs, each scored 0–100. Each bar is that input's sub-score; the figure is the points it added to the 100-point composite (weight × sub-score).
- Cash flow +10.8/30.0
- Appreciation +5.0/10.0
- ARV discount +3.9/15.0
- Livability +3.9/5.0
- Schools +3.6/10.0
- DSCR +3.1/10.0
- Rent growth +2.5/5.0
- Condition / age +2.5/5.0
- 1% rule +2.4/10.0
$265,000
🖨 Deal sheet (PDF) 📄 Offer letter ✓ Due diligence
Listing remarks
UPDATE: MOTIVATED SELLER!! Eligible for PATH loan program. PRICE REDUCTION! SELLER IS STILL WILLING TO ACCEPT OFFERS WITH PENDING STATUS. RECENT INSPECTION. ONE MAJOR ISSUE - DECK NEEDS REPAIRING, OTHER ISSUES ARE COSMETICS. PLEASE SCHEDULE VIA SHOWINGTIME. BACK -UP OFFERS WELCOMED. Five (5) Level Beautiful home, nestled in an established neighborhood - Briarcliffe Estates. Nice, quiet neighborhood with lake, and wide streets. Large main floor level deck and concrete patio for morning coffee, BBQs, gatherings or relaxing. Lots of living space in large Great Room (living room and dining room). Built-in shelves in Great Room and Master Bedroom located on upper level which includes full bathro
Key facts
- Concrete patio
- Great room
- Built-in shelves
Tags
Property features AI
Finance
- HOA & community: Property is part of an association
Exterior
- Parking: Four parking spaces total; Two-car attached side-entry garage located on the lower level
- Security: Owned security system
- Utilities: Public sewer; Public water
- Home design: 3.5-story home
- Construction: Crawlspace foundation
- Exterior features: Wood fiber/Masonite exterior finish; Chain link fencing; Paved road access; Public water
Interior
- Kitchen: Tiled backsplash; Dishwasher; Disposal; Refrigerator; Microwave above the stove; Free-standing gas range
- Bedrooms: Master bedroom on the second floor; Additional bedrooms on the second floor with ceiling fans and carpeted floors; One bedroom on the fourth level with ceiling fan and carpeted floor
- Flooring: Carpet in bedrooms
- Bathrooms: Three full bathrooms total (two full bathrooms on the second level and one full bathroom on the fourth level)
- Heating & cooling: Central heating; Central cooling
- Interior features: Attic storage with pull-down access; Owned security system; Wood stove fireplace (1)
- Laundry & utility: Laundry in utility room on the lower level
Neighborhood map
What this means for you Summary
Snapshot
- This is a 4-bed/3.0-bath single-family listed at $265k.
Deal economics
- At list price, monthly cash flow is $-121 ($-1k/yr) — negative.
- To cash-flow at today's rent, offer at most $244k (8.1% below list).
- To meet the 1% rule (rent ≥ 1% of price), the offer needs to be $197k (25.7% below list).
- Recommended offer: $197k (25.7% below list) — sets the bar for 1% rule.
Location & tenants
- Location reads 78/100 on livability (#18 in SC, #2,436 nationally) — a middle-class / working-renter tenant base. Strengths: amenities A+, commute A+, cost of living A+; Watch: employment D, crime F.
- Richland 02 (suburban): math 35% / reading 47% proficiency, ranked #29 of 80 in SC (top 36%) — families likely to look elsewhere, expect single-tenant / working-renter base with shorter leases.
- Zoned schools: Bookman Road Elementary (math 47% / reading 52%, grade D, #168 of 597 statewide, top 31%, 499 students, 62% FRL); Ridge View High (math 43% / reading 76%, grade C+, #110 of 196 statewide, top 58%, 1,711 students, 60% FRL) — zoned schools average 61% FRL vs 38% district-wide (23 pts higher); higher-poverty schools than district average — tighter screening recommended.
- Zoned-school proficiency averages 54% at this address vs 41% district-wide (+14 pts) — the actual schools serving this property are materially stronger than the Richland 02 average implies; a family-tenant draw the district grade alone would hide.
- Market conditions: 1 active listings in the ZIP; 9 comparable units currently listed for rent nearby; rentals leasing fast (median 5d on market — plan ~1-2 weeks tenant-placement turnaround); 3,472 units permitted in Richland County in 2024 (1,096 in 5+ unit buildings).
Forward outlook
- In year one you build about $10k of equity ($2k loan paydown + $8k appreciation (3.0% local appreciation)).
- Richland County population projected at +30% by 2050 — long-run rental-demand tailwind backs the buy-and-hold thesis.
- By year 4, paydown + projected appreciation supports a ~$33k cash-out refi (75% LTV) — recoverable capital for the next deal without selling this one.
Negotiation context
- Only 12 days on market — expect competitive offers; lowballing is unlikely to land.
- 3 sale attempts with the ask held roughly flat each time — persistent listings suggest the price (not the market) is what's stuck; bring a comps-based counter.
- Current owner paid $135k; list at $265k implies a 96% gain — meaningful room to come down on a strong offer.
Risks & watch-outs
- Climate carrying-cost: major wind risk, 68% chance of damaging wind over 30y; extreme-heat days projected 7→16/yr by 2055 (HVAC capex compounding) — expect insurance premiums to compound above CPI over the hold.
Questions for the listing agent
- What do current leases actually rent for vs. the listed asking? Can we see a recent rent roll and the last 12 months of T-12 income?
- Built in 1978 — when were the roof, HVAC, electrical panel, plumbing, and water heater last replaced?
- What does the HOA fee cover, when was the last increase, and are there any pending special assessments or reserve-fund shortfalls?
- Is there a deadline driving the sale (1031 exchange, divorce, estate, relocation)? That informs how much negotiation room exists.
- Schools are D-rated, which usually means shorter tenancies and higher turnover. Who's the typical renter profile here, and what's been the actual vacancy rate?
- Crime grade is F in this area — have there been break-ins, vandalism, or insurance claims at this property in the last 3 years? What carrier currently insures it and at what premium?
- The area grade is low — what's the realistic commute time and amenity access for the typical tenant pool here? Any planned neighborhood developments (good or bad) we should know about?
- What's the average days-on-market for RENTAL listings here right now (not sales)? A rising rental-DOM trend means longer vacancies and softer asking-rent achievability than the comps imply.
- What's the recent tenant-quality profile in this submarket — average credit score on applications, eviction rate, late-payment / NSF rate, and stable-employment percentage? A property-management company in the area should have these aggregated.
- How much new for-sale + rental construction is in the pipeline within 1–3 miles? Heavy new supply typically softens prices + rents 12–24 months out; constrained supply supports both.
Investment metrics
- 1% rule
- 0.74% ✗
- Cap rate
- 5.74%
- Cash-on-cash
- -1.96%
- DSCR
- 0.91
- GRM
- 11.2
CMA / ARV
- ARV (on-the-fly)
- $245,388
- Comps found
- 5
Show comp detail 5 sales within ~0.75 mi
| Address | Dist | Beds/Ba | Sqft | Sold | Price | $/sf | Match |
|---|---|---|---|---|---|---|---|
| 79 Loggerhead Dr | 0.48mi | 4/2.0 | 1,652 (-4%) | 7mo | $280,000 | $169 | 62 |
| 1 Loggerhead Dr | 0.46mi | 3/2.0 (-1) | 1,800 (+5%) | 11mo | $268,000 | $149 | 52 |
| 752 Jack Russell Ct | 0.71mi | 3/2.5 (-1) | 1,714 (-0%) | 13mo | $242,000 | $141 | 48 |
| 396 Longfellows Ln | 0.66mi | 4/2.5 | 1,648 (-4%) | 17mo | $235,000 | $143 | 47 |
| 732 Jack Russell Ct | 0.73mi | 4/2.5 | 1,920 (+12%) | 9mo | $234,990 | $122 | 36 |
Match score weights: distance 35% · size 25% · config 20% · recency 20%. Top-matched comps best support the ARV.
Projected returns pro-forma
3.0% appreciation · 3.0% rent growth · sell at horizon
- IRR
- 5.7%
- Equity multiple
- 1.33×
- Total profit
- $24,120
- Equity at exit
- $119,155
- IRR
- 8.6%
- Equity multiple
- 2.30×
- Total profit
- $96,660
- Equity at exit
- $183,633
Cash invested: $74,200 (down + closing). Projections, not guarantees.
Landlord ↔ Tenant lean methodology
- Overall (STATE)
- 90 Strongly Landlord-Friendly
- State South Carolina
- 90 Strongly Landlord-Friendly · R+6
- County
- — inherits STATE
- City
- — inherits STATE
ZIP-level market 29045-8614
- Active inventory
- 1
- Price-to-rent
- 11.2×
Monthly cashflow live
- Estimated rent
- $1,968 high interval (Pro) →
- Mortgage (P&I)
- −$1,390
- Tax from tax record
- −$171 /mo · $2,055/yr
- Insurance
- −$110
- HOA
- −$5
- Vacancy / Maint / Mgmt
- −$413
- Net cashflow
- $-121
Break-even live
Sensitivity live
| Price | -10% $29 | -5% $-46 | +0% $-121 | +5% $-196 | +10% $-271 |
|---|---|---|---|---|---|
| Rent | -10% $-277 | -5% $-199 | +0% $-121 | +5% $-44 | +10% $34 |
| Rate | -1.0pp $12 | -0.5pp $-54 | base $-121 | +0.5pp $-190 | +1.0pp $-260 |
UW: 25.0% down · 7.5% · 30yr · 1.5% tax · 5.0% vac · 8.0% maint · 8.0% mgmt
Financing live
Cash to close
- Down payment
- $66,250
- Closing costs
- $7,950
- Reserves months
- —
- Total cash needed
- —
Loan-product check · same deal, 3 products live
Conventional
25% down · 7.5% · 30yr
- Down + closing
- —
- Monthly P&I
- —
- Monthly cashflow
- —
- DSCR
- —
- Eligible?
- —
Personal DTI + credit; lowest rate.
DSCR
20% down · 8.5% · 30yr
- Down + closing
- —
- Monthly P&I
- —
- Monthly cashflow
- —
- DSCR
- —
- Eligible?
- —
No personal income docs; deal must DSCR.
Hard money
10% down · 12.0% · 12mo
- Down + closing
- —
- Monthly P&I
- —
- Monthly cashflow
- —
- DSCR
- —
- Eligible?
- —
Short-term bridge; refi at stabilization.
Rent comps 9 comps
| Address | Beds | Baths | Sqft | Rent | $/sqft | DOM | Units | Dist |
|---|---|---|---|---|---|---|---|---|
| 344 Longfellows Ln Elgin, SC | 3.0 | 2.5 | 1652 | $1,999 | $1.21 | 5d | 1 | 0.58mi |
| 304 Longfellows Ln Elgin, SC | 4.0 | 2.5 | 2050 | $2,269 | $1.11 | 5d | 1 | 0.64mi |
| 430 Grand National Ln Elgin, SC | 4.0 | 2.5 | 2060 | $2,049 | $0.99 | 4d | 1 | 0.69mi |
| 512 N Crossing Dr Columbia, SC | 3.0 | 2.0 | 1302 | $1,799 | $1.38 | 25d | 1 | 1.06mi |
| 499 Fox Trot Dr Columbia, SC | 4.0 | 2.5 | 2006 | $2,195 | $1.09 | 5d | 1 | 1.23mi |
| 112 Turnstone Way Columbia, SC | 3.0 | 2.0 | 1145 | $1,779 | $1.55 | 4d | 1 | 1.24mi |
| 352 White Gables Dr Columbia, SC | 3.0 | 2.0 | 1165 | $1,605 | $1.38 | 5d | 1 | 1.29mi |
| 221 Fox Grove Cir Unit 1 Columbia, SC | 4.0 | 2.0 | 2046 | $1,700 | $0.83 | 4d | 1 | 1.34mi |
| 10682 Two Notch Rd Elgin, SC | 1.0–3.0 | 1.0–2.0 | 1052 | $1,675 | $1.59 | 4d | 10 | 1.49mi |
HOA detail
- Monthly dues
- $5 · $60/yr
Listing history 14 events
-
2026-06-13price $265,000 Pending 12 DOM
-
2026-06-07statusdays on market $270,000 Pending 12 DOM
-
2026-06-05days on market $270,000 Active 10 DOM
-
2026-06-03days on market $270,000 Active 9 DOM
-
2026-06-03days on market $270,000 Active 8 DOM
-
2026-06-01days on market $270,000 Active 7 DOM
-
2026-05-31days on market $270,000 Active 6 DOM
-
2026-05-25$270,000 Active
-
2026-03-09historical
-
2026-02-06$296,000 Active
-
2025-05-07price $282,000
-
2025-04-28$289,000 Active
-
2016-05-16soldstatus $135,000
-
1991-08-14soldstatus $92,750
ⓘ Source: listings_history table (triggers on properties + properties_extension) + one-shot
backfill from property_details.listing_events for pre-trigger history.
Tax reassessment forecast SC · Resets to sale price
- Current annual tax
- $2,055 · $171/mo
- Projected year-2 tax
- $2,055 · $171/mo
- Expected delta
- $0/yr ($0/mo · 0.0%)
ⓘ Screening estimate from a state-policy table — verify with the county assessor before closing.
Climate risk First Street
- Flood 1/10 Low FEMA zone X (unshaded) · 0% chance over 30 yrs
- Wildfire 4/10 Moderate
- Heat 6/10 Major 7 d/yr ≥107°F today · 16 d/yr by 30 yrs out
- Wind 6/10 Major 68% chance of damaging wind over 30 yrs
- Air quality 3/10 Moderate 3 unhealthy d/yr today · 3 by 30 yrs out
Nearby sold comps map
Loading sold comps map…
Walkable amenities ~0.75 mi
Loading nearby amenities…
Taxation est. · year 1
- Rental income
- $23,618
- − Mortgage interest
- −$14,844
- − Property taxes
- −$2,055
- − Insurance
- −$1,325
- − Repairs & maintenance
- −$1,889
- − Management
- −$1,889
- − HOA
- −$60
- − Depreciation
- −$7,709
- Taxable loss
- −$6,154
- Est. tax savings @ 24.0%
- +$1,477
- After-tax cash flow
- $19/yr
For passive investors: Depreciation is non-cash, so a rental often shows a tax loss while cash-flowing — sheltering income. Rental losses are passive: they offset passive income freely, and up to $25,000/yr can offset ordinary (W-2) income if you actively participate and your MAGI is under $100k (phasing out to $0 by $150k); unused losses carry forward. On sale, claimed depreciation is recaptured at up to 25%, and gains may owe capital-gains tax (a 1031 exchange can defer both). Figures are a year-1 estimate at your 24.0% rate — not tax advice; consult a CPA.
Schools (NCES district)
- District
- Richland 02
- NCES district ID
- 4503390
- Math proficiency
- 35% ▼ -15.00%
- Reading proficiency
- 47% ▼ -5.00%
- Median HH income
- $59,684
- Composite
- 36.2/100
- National rank
- #4730
- State rank
- #29 of 80 in SC
Livability — Columbia
- Score
- 78/100
- State rank
- #18
- US rank
- #2436
Category grades
Schools grade is shown separately in the Schools card above.
Census & demographics
No demographic data for this ZIP.
Market trends
- HPI YoY
- —
- Current HPI
- —
- Rent YoY
- —
- Metro
- —
- State GDP YoY
- ▲ 4.51%
- F500 in state
- 2
Industry mix (Fortune 500 HQ in SC)
| Industry | F500 HQs | Revenue |
|---|---|---|
| Packaging | 1 | $7B |
|
||
Price history
+191.1% since first listed7 events — show timeline
- 2026-05-25 Listed $270,000 Consolidated MLS
- 2026-03-09 Delisted — Consolidated MLS
- 2026-02-06 Listed $296,000 Consolidated MLS
- 2025-05-07 Price Changed $282,000 Consolidated MLS
- 2025-04-28 Listed $289,000 Consolidated MLS
- 2016-05-16 Sold (Public Records) $135,000 Public Records
- 1991-08-14 Sold (Public Records) $92,750 Public Records
Property tax history
+7.4%/yrLatest (2025): $2,055 · +3.6% YoY. Source: county tax records.
Cash-flow waterfall
monthlySold comps — $/sqft
last 12 mo · ≤1 miLoading sold comps…