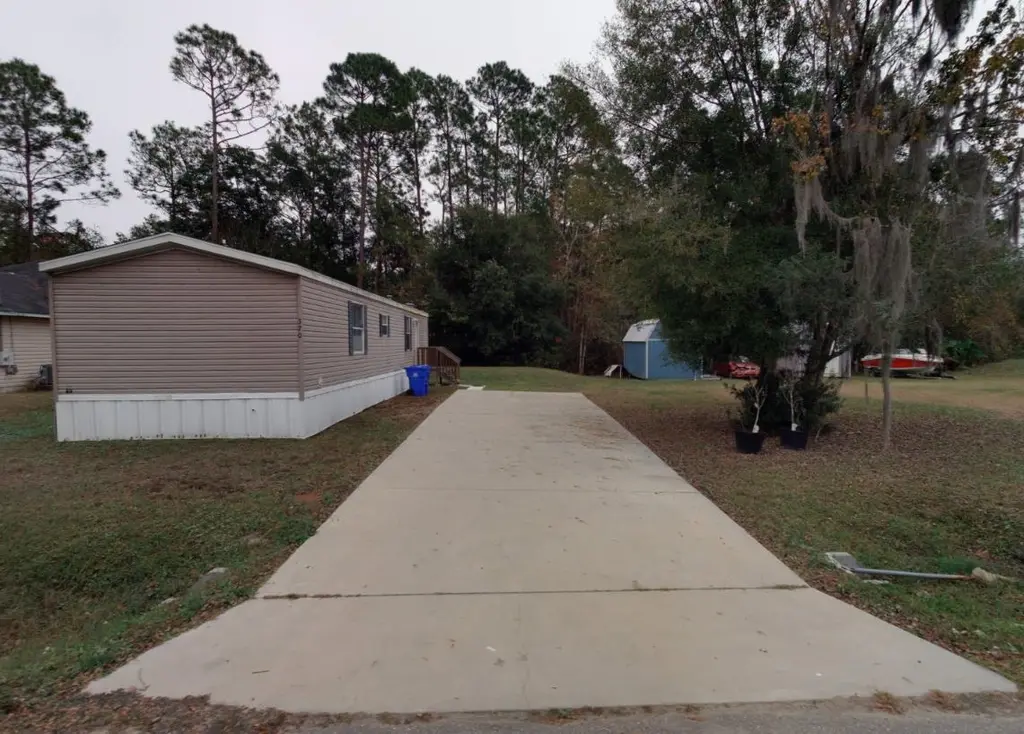
370 N Clay St · St. Augustine, FL
Flood risk 1/10 · Minimal
- FEMA flood zone
- X (unshaded)
- Chance of flooding over 30 yrs
- 0.0%
- Est. flood insurance / yr
- $507 – $1,088
Fire risk 5/10 · Moderate
- Est. fire insurance / yr
- $947 – $1,759
Heat risk 9/10 · Severe
- Hot days now (above 106°F)
- 7 days/yr
- Hot days in 30 yrs
- 20 days/yr
Wind risk 10/10 · Severe
- Chance of severe wind over 30 yrs
- 99.0%
Air-quality risk 3/10 · Minor
- Unhealthy air days now
- 3 days/yr
- Unhealthy air days in 30 yrs
- 3 days/yr
Risk factors via First Street. Map © Google.
Why this score? — see what drove the C+ grade
The composite is a weighted blend of 9 inputs, each scored 0–100. Each bar is that input's sub-score; the figure is the points it added to the 100-point composite (weight × sub-score).
- Cash flow +26.2/30.0
- DSCR +8.9/10.0
- ARV discount +7.5/15.0
- Schools +6.4/10.0
- 1% rule +5.7/10.0
- Rent growth +2.6/5.0
- Livability +2.5/5.0
- Condition / age +2.5/5.0
- Appreciation +0.0/10.0
$230,000
🖨 Deal sheet 📄 Offer letter ✓ Due diligence
Listing remarks MLS
This well-kept 3-bedroom, 2-bath mobile home offers comfort and convenience just minutes from downtown, shopping, and dining. A perfect option for those seeking value and accessibility in a prime location!
Key facts
- Additional lot
- Prime location
- Built 2014
Tags
Neighborhood map
What this means for you Summary
Snapshot
- This is a 3-bed/2.0-bath land listed at $230k.
Deal economics
- At list price, monthly cash flow is $588 ($7k/yr) — positive.
- The deal already cash-flows at list — no discount required.
- Meets the 1% rule at list price ($2k rent vs $230k).
- Recommended offer: $202k (12.0% below list) — sets the bar for market timing.
- Cap rate 9.4% vs local median 3.1% in St. Augustine — top-decile yield for the area; either an underpriced asset or a hidden risk that comps aren't pricing in. Stress-test before assuming the spread holds.
Location & tenants
- Location reads: area grade C — affects rentability + tenant quality, not the cash-flow math above.
- St. Johns (rural): math 75% / reading 73% proficiency, ranked #2 of 73 in FL (top 3%) — strong family-tenant draw, lease renewals of 3-5y typical; only 20% free/reduced lunch — higher-income household profile.
- Market conditions: Rents flat; 631 active listings in the ZIP; 10 comparable units currently listed for rent nearby; rentals at typical pace (median 17d on market — plan ~3-4 weeks tenant-placement turnaround); 5,575 units permitted in St. Johns County in 2024 (584 in 5+ unit buildings).
- This rent runs 40% of the median local income ($74k/yr) — at the standard rent-burdened threshold; future hikes will face affordability resistance.
Forward outlook
- Local home prices are declining (-3.0%/yr); year-one equity from $2k of loan paydown is wiped out by about $7k of value loss. Plan a longer hold.
- St. Johns County population projected at +60% by 2050 — long-run rental-demand tailwind backs the buy-and-hold thesis.
Negotiation context
- It's been on market 401 days — a 12% lower offer ($202k) is reasonable based on typical stale-listing flexibility.
- 2 sale attempts since 3y ago with the ask held roughly flat each time — persistent listings suggest the price (not the market) is what's stuck; bring a comps-based counter.
- Current owner paid $135k; list at $230k implies a 70% gain — meaningful room to come down on a strong offer.
Risks & watch-outs
- Climate carrying-cost: severe wind risk, 99% chance of damaging wind over 30y; moderate wildfire risk; extreme-heat days projected 7→20/yr by 2055 (HVAC capex compounding) — expect insurance premiums to compound above CPI over the hold.
Questions for the listing agent
- It's been on market 401 days. Have you received any prior offers? Is the seller open to a 12% concession, seller financing, or rate buy-down credit?
- Why hasn't it sold? Are there any deal-killer items the seller is aware of (foundation, flood, title, zoning, code violations)?
- Is there a deadline driving the sale (1031 exchange, divorce, estate, relocation)? That informs how much negotiation room exists.
- What's the average days-on-market for RENTAL listings here right now (not sales)? A rising rental-DOM trend means longer vacancies and softer asking-rent achievability than the comps imply.
- What's the recent tenant-quality profile in this submarket — average credit score on applications, eviction rate, late-payment / NSF rate, and stable-employment percentage? A property-management company in the area should have these aggregated.
- How much new for-sale + rental construction is in the pipeline within 1–3 miles? Heavy new supply typically softens prices + rents 12–24 months out; constrained supply supports both.
Investment metrics
- 1% rule
- 1.07% ✓
- Cap rate
- 9.36%
- Cash-on-cash
- 10.96%
- DSCR
- 1.49
- GRM
- 7.8
CMA / ARV
- ARV (median comp)
- $148,550
- List price
- $230,000
- Delta
- 54.83%
- Verdict
- OVERPRICED
- Comps
- 5 within 1.0 mi
Projected returns pro-forma
-3.0% appreciation · 0.25% rent growth · sell at horizon
- IRR
- -2.8%
- Equity multiple
- 0.90×
- Total profit
- $-6,535
- Equity at exit
- $34,294
- IRR
- 3.9%
- Equity multiple
- 1.25×
- Total profit
- $16,409
- Equity at exit
- $19,886
Cash invested: $64,400 (down + closing). Projections, not guarantees.
Landlord ↔ Tenant lean methodology
- Overall (STATE)
- 87 Strongly Landlord-Friendly
- State Florida
- 87 Strongly Landlord-Friendly · R+3
- County
- — inherits STATE
- City
- — inherits STATE
ZIP-level market 32084
- Rents YoY
- 0.2%
- Active inventory
- 631
- Price-to-rent
- 7.8×
Monthly cashflow live
- Estimated rent
- $2,457 high interval (Pro) →
- Mortgage (P&I)
- −$1,206
- Tax from tax record
- −$51 /mo · $609/yr
- Insurance
- −$96
- HOA
- −$0
- Vacancy / Maint / Mgmt
- −$516
- Net cashflow
- $588
Break-even live
UW: 25.0% down · 7.5% · 30yr · 1.5% tax · 5.0% vac · 8.0% maint · 8.0% mgmt
Financing live
Cash to close
- Down payment
- $57,500
- Closing costs
- $6,900
- Reserves months
- —
- Total cash needed
- —
Loan-product check · same deal, 3 products live
Conventional
25% down · 7.5% · 30yr
- Down + closing
- —
- Monthly P&I
- —
- Monthly cashflow
- —
- DSCR
- —
- Eligible?
- —
Personal DTI + credit; lowest rate.
DSCR
20% down · 8.5% · 30yr
- Down + closing
- —
- Monthly P&I
- —
- Monthly cashflow
- —
- DSCR
- —
- Eligible?
- —
No personal income docs; deal must DSCR.
Hard money
10% down · 12.0% · 12mo
- Down + closing
- —
- Monthly P&I
- —
- Monthly cashflow
- —
- DSCR
- —
- Eligible?
- —
Short-term bridge; refi at stabilization.
Rent comps 10 comps
| Address | Beds | Baths | Sqft | Rent | $/sqft | DOM | Units | Dist |
|---|---|---|---|---|---|---|---|---|
| 1004 Josiah St Unit 1281918P St. Augustine, FL | 3.0 | 2.0 | 1097 | $3,893 | $3.55 | 13d | 1 | 0.37mi |
| 1000 Josiah St Unit 1281953P St. Augustine, FL | 3.0 | 2.0 | 1097 | $3,526 | $3.21 | 12d | 1 | 0.38mi |
| 1040 W 7th St Saint Augustine, FL | 2.0 | 2.0 | 1108 | $2,195 | $1.98 | 1d | 1 | 0.46mi |
| 736 W King St Unit A St. Augustine, FL | 2.0 | 1.0 | 688 | $1,750 | $2.54 | 17d | 1 | 0.74mi |
| 289 W Jayce Way Saint Augustine, FL | 3.0 | 2.0 | 1102 | $1,851 | $1.68 | 13d | 1 | 0.94mi |
| 20 Rollins Ave Saint Augustine, FL | 3.0 | 1.0 | 828 | $1,500 | $1.81 | 23d | 1 | 1.23mi |
| 56 Masters Dr Unit D St. Augustine, FL | 2.0 | 1.5 | 900 | $1,300 | $1.44 | 23d | 1 | 1.24mi |
| 60 Masters Dr Unit C St. Augustine, FL | 2.0 | 1.5 | 900 | $1,300 | $1.44 | 23d | 1 | 1.24mi |
| 177 Palmer St Unit B St. Augustine, FL | 2.0 | 1.0 | 900 | $1,350 | $1.50 | 23d | 1 | 1.46mi |
| 228 Nesmith Ave Saint Augustine, FL | 2.0 | 2.0 | 1080 | $2,500 | $2.31 | 14d | 1 | 1.50mi |
Listing history 18 events
-
2026-06-18days on market $230,000 Active 401 DOM
-
2026-06-17days on market $230,000 Active 400 DOM
-
2026-06-16days on market $230,000 Active 399 DOM
-
2026-06-15days on market $230,000 Active 398 DOM
-
2026-06-13days on market $230,000 Active 396 DOM
-
2026-06-13days on market $230,000 Active 395 DOM
-
2026-06-10days on market $230,000 Active 392 DOM
-
2026-06-08days on market $230,000 Active 391 DOM
-
2026-06-07days on market $230,000 Active 390 DOM
-
2026-06-03days on market $230,000 Active 386 DOM
-
2026-06-02days on market $230,000 Active 385 DOM
-
2026-06-01days on market $230,000 Active 384 DOM
-
2026-05-31days on market $230,000 Active 383 DOM
-
2025-05-13$230,000 Active 205-char remark
Show marketing remark (205 chars)
This well-kept 3-bedroom, 2-bath mobile home offers comfort and convenience just minutes from downtown, shopping, and dining. A perfect option for those seeking value and accessibility in a prime location!
-
2024-08-15soldstatus $135,000
-
2023-09-26historical 517-char remark
Show marketing remark (517 chars)
Investor Alert!!!! This 2014 2 bedroom 2 bathroom manufactured home is up for grabs. Boasting a beautiful open concept floor plan just under 900 square feet. New items: A/C under 6months, off street concrete driveway, septic, and water hookups. Has an outstanding tenant currently. Nestled off King Street extension, near shopping, downtown, beach, schools, and private schools. This home is well-maintained, with in-house laundry. This is a turnkey investment or starter home all under $225,000 in St. John's county.
-
2023-07-19price $199,900 517-char remark
Show marketing remark (517 chars)
Investor Alert!!!! This 2014 2 bedroom 2 bathroom manufactured home is up for grabs. Boasting a beautiful open concept floor plan just under 900 square feet. New items: A/C under 6months, off street concrete driveway, septic, and water hookups. Has an outstanding tenant currently. Nestled off King Street extension, near shopping, downtown, beach, schools, and private schools. This home is well-maintained, with in-house laundry. This is a turnkey investment or starter home all under $225,000 in St. John's county.
-
2023-06-24$215,000 Active 517-char remark
Show marketing remark (517 chars)
Investor Alert!!!! This 2014 2 bedroom 2 bathroom manufactured home is up for grabs. Boasting a beautiful open concept floor plan just under 900 square feet. New items: A/C under 6months, off street concrete driveway, septic, and water hookups. Has an outstanding tenant currently. Nestled off King Street extension, near shopping, downtown, beach, schools, and private schools. This home is well-maintained, with in-house laundry. This is a turnkey investment or starter home all under $225,000 in St. John's county.
ⓘ Source: listings_history table (triggers on properties + properties_extension) + one-shot
backfill from property_details.listing_events for pre-trigger history.
Tax reassessment forecast FL · Resets to sale price
- Current annual tax
- $609 · $51/mo
- Projected year-2 tax
- $1,909 · $159/mo
- Expected delta
- +$1,300/yr (+$108/mo · 213.6%)
ⓘ Screening estimate from a state-policy table — verify with the county assessor before closing.
Climate risk First Street
- Flood 1/10 Low FEMA zone X (unshaded) · 0% chance over 30 yrs
- Wildfire 5/10 Major
- Heat 9/10 Extreme 7 d/yr ≥106°F today · 20 d/yr by 30 yrs out
- Wind 10/10 Extreme 99% chance of damaging wind over 30 yrs
- Air quality 3/10 Moderate 3 unhealthy d/yr today · 3 by 30 yrs out
Nearby sold comps map
Loading sold comps map…
Walkable amenities ~0.75 mi
Loading nearby amenities…
Taxation est. · year 1
- Rental income
- $29,481
- − Mortgage interest
- −$12,884
- − Property taxes
- −$609
- − Insurance
- −$1,150
- − Repairs & maintenance
- −$2,358
- − Management
- −$2,358
- − Depreciation
- −$6,691
- Taxable income
- $3,431
- Est. tax owed @ 24.0%
- −$823
- After-tax cash flow
- $6,234/yr
For passive investors: Depreciation is non-cash, so a rental often shows a tax loss while cash-flowing — sheltering income. Rental losses are passive: they offset passive income freely, and up to $25,000/yr can offset ordinary (W-2) income if you actively participate and your MAGI is under $100k (phasing out to $0 by $150k); unused losses carry forward. On sale, claimed depreciation is recaptured at up to 25%, and gains may owe capital-gains tax (a 1031 exchange can defer both). Figures are a year-1 estimate at your 24.0% rate — not tax advice; consult a CPA.
Schools (NCES district)
- District
- St. Johns
- NCES district ID
- 1201740
- Math proficiency
- 75% ▼ -5.00%
- Reading proficiency
- 73% ▼ -2.00%
- Median HH income
- $66,842
- Composite
- 64.31/100
- National rank
- #556
- State rank
- #2 of 73 in FL
Livability — St. Augustine
No livability data for this city. (Only ~50 U.S. cities are tracked.)
Census & demographics
- County
- Saint Johns County · 301,599 people
- Metro
- Jacksonville, FL
- Population (ZIP)
- 37,291
- Household income
- $73,837
- Rent vs Own
- Severe rent burden
- 1748.0
Population outlook (St. Johns County) Hauer SSP2
- Today (2025)
- 303,941 people
- By 2030
- 342,590 · +12.7%
- By 2040
- 417,328 · +37.3%
- By 2050
- 487,011 · +60.2%
- By 2075
- 635,395 · +109.1%
- By 2100
- 717,469 · +136.1%
Race, ethnicity, and origin ACS 2023
- Neighborhood character
- Predominantly White (73%)
- Race & ethnicity
- White 73% Hispanic / Latino 12% Black 11% Two or more races 8%
- Hispanic origin (detail)
- Mexican 2% Puerto Rican 4% Cuban 1%
- Common ancestry
- Lithuanian 3% Romanian 2% Slovak 2%
- Foreign-born
- 6% · Canada, Jamaica
- Languages at home
- 91% English-only · Spanish 6% Other Indo-European 1%
Political lean MEDSL · St. Johns
- 2024 margin
- Solid R (+31.4) · D 33.9% · R 65.2%
- 2008→2024 swing
- +0.2pp no change · 2008: -31.6pp · 2024: -31.4pp
- All cycles
- 2024: R+31.4 2020: R+26.7 2016: R+33.4 2012: R+37.8 2008: R+31.6
Not yet ingested
- Civics
- —
Market trends
- HPI YoY
- ▼ -287.02%
- Current HPI
- 330.9505
- Rent YoY
- ▲ 0.25%
- Metro
- Jacksonville, FL
- State GDP YoY
- ▲ 3.28%
- F500 in state
- 36
Industry mix (Fortune 500 HQ in FL)
| Industry | F500 HQs | Revenue |
|---|---|---|
| Industrial Technology | 2 | $29B |
|
||
| Insurance | 2 | $17B |
|
||
| Retail | 1 | $60B |
|
||
| Technology Distribution | 1 | $58B |
|
||
| Homebuilding | 1 | $35B |
|
||
| Technology Manufacturing | 1 | $35B |
|
||
Price history
+7.0% since first listed5 events — show timeline
- 2025-05-13 Listed $230,000 St. Augustine and St. Johns County Board of REALTORS®
- 2024-08-15 Sold (Public Records) $135,000 Public Records
- 2023-09-26 Listing Removed — realMLS
- 2023-07-19 Price Changed $199,900 realMLS
- 2023-06-24 Listed $215,000 realMLS
Property tax history
+6.6%/yrLatest (2025): $609 · +71.0% YoY. Source: county tax records.
Cash-flow waterfall
monthlySold comps — $/sqft
last 12 mo · ≤1 miLoading sold comps…