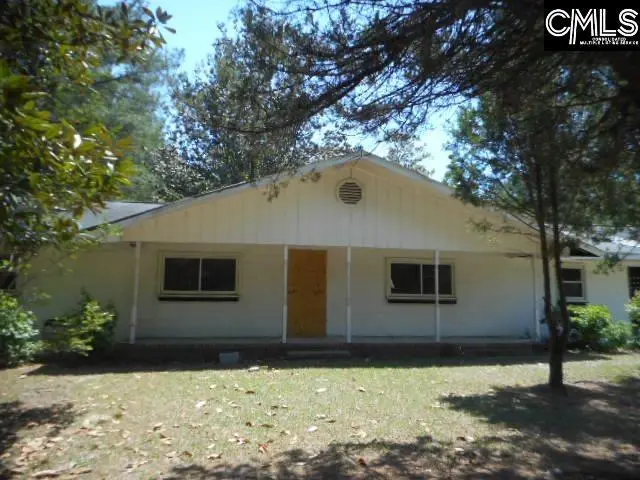
144 Gillins Terrace Rd · Gaston, SC
Flood risk 1/10 · Minimal
- FEMA flood zone
- X (unshaded)
- Chance of flooding over 30 yrs
- 0.0%
- Est. flood insurance / yr
- $507 – $1,088
Fire risk 6/10 · Moderate
- Est. fire insurance / yr
- $783 – $1,453
Heat risk 7/10 · Major
- Hot days now (above 108°F)
- 7 days/yr
- Hot days in 30 yrs
- 16 days/yr
Wind risk 6/10 · Moderate
- Chance of severe wind over 30 yrs
- 67.0%
Air-quality risk 3/10 · Minor
- Unhealthy air days now
- 2 days/yr
- Unhealthy air days in 30 yrs
- 2 days/yr
Risk factors via First Street. Map © Google.
Why this score? — see what drove the C- grade
The composite is a weighted blend of 9 inputs, each scored 0–100. Each bar is that input's sub-score; the figure is the points it added to the 100-point composite (weight × sub-score).
- Cash flow +15.0/30.0
- Appreciation +10.0/10.0
- ARV discount +7.5/15.0
- 1% rule +5.0/10.0
- DSCR +5.0/10.0
- Livability +3.2/5.0
- Schools +2.9/10.0
- Rent growth +2.5/5.0
- Condition / age +2.5/5.0
$19,900
🖨 Deal sheet 📄 Offer letter ✓ Due diligence
Listing remarks
Home has no value; land value only. No interior entry for any reason. AS IS sale check county records for plat. Do you own due diligence. Disclaimer: CMLS has not reviewed and, therefore, does not endorse vendors who may appear in listings.
Key facts
- 0.54 acre lot
- Garage
- Built 1960
Property features AI
Exterior
- Parking: Attached carport; One garage/carport space
- Utilities: Septic sewer; Well water
- Home design: Single-story home
- Construction: Crawlspace foundation
- Exterior features: Block exterior; Dirt road access; Approximately 0.54-acre lot; Well water
Interior
- Bedrooms: Master bedroom on the main level
- Bathrooms: Three full bathrooms; Two half bathrooms
- Heating & cooling: Central heating; Central cooling
- Interior features: Central heating and central air conditioning
Neighborhood map
What this means for you Summary
Snapshot
- This is a 3-bed/2.0-bath single-family listed at $20k.
Deal economics
- At list price, monthly cash flow is $1k ($13k/yr) — positive.
- The deal already cash-flows at list — no discount required.
- Meets the 1% rule at list price ($2k rent vs $20k).
Location & tenants
- Location reads 65/100 on livability (#142 in SC) — a middle-class / working-renter tenant base. Strengths: cost of living A+, housing A+, health & safety B; Watch: crime F, amenities F, commute F.
- Lexington 02 (suburban): math 30% / reading 38% proficiency, ranked #45 of 80 in SC (top 56%) — families likely to look elsewhere, expect single-tenant / working-renter base with shorter leases.
- Zoned schools: Cayce Elementary (math 24% / reading 22%, grade F, #469 of 597 statewide, top 79%, 998 students, 100% FRL); Airport High (math 40% / reading 79%, grade C+, #110 of 196 statewide, top 58%, 1,428 students, 84% FRL) — zoned schools average 92% FRL vs 59% district-wide (33 pts higher); higher-poverty schools than district average — tighter screening recommended.
- Market conditions: 56 active listings in the ZIP; 1 comparable units currently listed for rent nearby; 1,712 units permitted in Lexington County in 2024 (0 in 5+ unit buildings).
Forward outlook
- In year one you build about $2k of equity ($138 loan paydown + $2k appreciation (10.0% local appreciation)).
- Lexington County population projected at +26% by 2050 — long-run rental-demand tailwind backs the buy-and-hold thesis.
- At projected returns (10.0% appreciation + 3.0% rent growth), your $6k cash investment doubles in ~1 year — after that, you're playing with house money.
Negotiation context
- Only 14 days on market — expect competitive offers; lowballing is unlikely to land.
- 2 sale attempts with the ask held roughly flat each time — persistent listings suggest the price (not the market) is what's stuck; bring a comps-based counter.
Risks & watch-outs
- Climate carrying-cost: major wind risk, 67% chance of damaging wind over 30y; major wildfire risk; extreme-heat days projected 7→16/yr by 2055 (HVAC capex compounding) — expect insurance premiums to compound above CPI over the hold.
Questions for the listing agent
- Built in 1960 — when were the roof, HVAC, electrical panel, plumbing, and water heater last replaced?
- Is there a deadline driving the sale (1031 exchange, divorce, estate, relocation)? That informs how much negotiation room exists.
- Schools are F-rated, which usually means shorter tenancies and higher turnover. Who's the typical renter profile here, and what's been the actual vacancy rate?
- Crime grade is F in this area — have there been break-ins, vandalism, or insurance claims at this property in the last 3 years? What carrier currently insures it and at what premium?
- What's the average days-on-market for RENTAL listings here right now (not sales)? A rising rental-DOM trend means longer vacancies and softer asking-rent achievability than the comps imply.
- What's the recent tenant-quality profile in this submarket — average credit score on applications, eviction rate, late-payment / NSF rate, and stable-employment percentage? A property-management company in the area should have these aggregated.
- How much new for-sale + rental construction is in the pipeline within 1–3 miles? Heavy new supply typically softens prices + rents 12–24 months out; constrained supply supports both.
Investment metrics
- 1% rule
- 7.54% ✓
- Cap rate
- 70.08%
- Cash-on-cash
- 227.80%
- DSCR
- 11.14
- GRM
- 1.1
CMA / ARV
No comps found within radius.
Projected returns pro-forma
10.0% appreciation · 3.0% rent growth · sell at horizon
- IRR
- —
- Equity multiple
- 15.04×
- Total profit
- $78,223
- Equity at exit
- $17,927
- IRR
- —
- Equity multiple
- 32.84×
- Total profit
- $177,408
- Equity at exit
- $38,661
Cash invested: $5,572 (down + closing). Projections, not guarantees.
Landlord ↔ Tenant lean methodology
- Overall (STATE)
- 90 Strongly Landlord-Friendly
- State South Carolina
- 90 Strongly Landlord-Friendly · R+6
- County
- — inherits STATE
- City
- — inherits STATE
ZIP-level market 29172
- Home prices YoY
- 14.4%
- Active inventory
- 56
- Price-to-rent
- 1.1×
Monthly cashflow live
- Estimated rent
- $1,500 medium interval (Pro) →
- Mortgage (P&I)
- −$104
- Tax from tax record
- −$15 /mo · $175/yr
- Insurance
- −$8
- HOA
- −$0
- Vacancy / Maint / Mgmt
- −$315
- Net cashflow
- $1,058
Break-even live
UW: 25.0% down · 7.5% · 30yr · 1.5% tax · 5.0% vac · 8.0% maint · 8.0% mgmt
Financing live
Cash to close
- Down payment
- $4,975
- Closing costs
- $597
- Reserves months
- —
- Total cash needed
- —
Loan-product check · same deal, 3 products live
Conventional
25% down · 7.5% · 30yr
- Down + closing
- —
- Monthly P&I
- —
- Monthly cashflow
- —
- DSCR
- —
- Eligible?
- —
Personal DTI + credit; lowest rate.
DSCR
20% down · 8.5% · 30yr
- Down + closing
- —
- Monthly P&I
- —
- Monthly cashflow
- —
- DSCR
- —
- Eligible?
- —
No personal income docs; deal must DSCR.
Hard money
10% down · 12.0% · 12mo
- Down + closing
- —
- Monthly P&I
- —
- Monthly cashflow
- —
- DSCR
- —
- Eligible?
- —
Short-term bridge; refi at stabilization.
Rent comps 1 comps
| Address | Beds | Baths | Sqft | Rent | $/sqft | DOM | Units | Dist |
|---|---|---|---|---|---|---|---|---|
| 315 Gardners Terrace Rd West Columbia, SC | 2.0 | 1.0 | 1333 | $1,500 | $1.13 | 23d | 1 | 0.44mi |
Listing history 13 events
-
2026-06-18days on market $19,900 Active 14 DOM
-
2026-06-17days on market $19,900 Active 13 DOM
-
2026-06-16days on market $19,900 Active 12 DOM
-
2026-06-15days on market $19,900 Active 11 DOM
-
2026-06-14days on market $19,900 Active 9 DOM
-
2026-06-13remarks 241-char remark
-
2026-06-13days on market $19,900 Active 8 DOM
-
2026-06-10days on market $19,900 Active 6 DOM
-
2026-06-09days on market $19,900 Active 5 DOM
-
2026-06-08days on market $19,900 Active 4 DOM
-
2026-06-07days on market $19,900 Active 3 DOM
-
2026-06-05remarks 138-char remark
-
2026-06-05$19,900 Active 1 DOM
ⓘ Source: listings_history table (triggers on properties + properties_extension) + one-shot
backfill from property_details.listing_events for pre-trigger history.
Tax reassessment forecast SC · Resets to sale price
- Current annual tax
- $175 · $15/mo
- Projected year-2 tax
- $175 · $15/mo
- Expected delta
- $0/yr ($0/mo · 0.0%)
ⓘ Screening estimate from a state-policy table — verify with the county assessor before closing.
Climate risk First Street
- Flood 1/10 Low FEMA zone X (unshaded) · 0% chance over 30 yrs
- Wildfire 6/10 Major
- Heat 7/10 Severe 7 d/yr ≥108°F today · 16 d/yr by 30 yrs out
- Wind 6/10 Major 67% chance of damaging wind over 30 yrs
- Air quality 3/10 Moderate 2 unhealthy d/yr today · 2 by 30 yrs out
Nearby sold comps map
Loading sold comps map…
Walkable amenities ~0.75 mi
Loading nearby amenities…
Taxation est. · year 1
- Rental income
- $18,000
- − Mortgage interest
- −$1,115
- − Property taxes
- −$175
- − Insurance
- −$100
- − Repairs & maintenance
- −$1,440
- − Management
- −$1,440
- − Depreciation
- −$579
- Taxable income
- $13,152
- Est. tax owed @ 24.0%
- −$3,156
- After-tax cash flow
- $9,537/yr
For passive investors: Depreciation is non-cash, so a rental often shows a tax loss while cash-flowing — sheltering income. Rental losses are passive: they offset passive income freely, and up to $25,000/yr can offset ordinary (W-2) income if you actively participate and your MAGI is under $100k (phasing out to $0 by $150k); unused losses carry forward. On sale, claimed depreciation is recaptured at up to 25%, and gains may owe capital-gains tax (a 1031 exchange can defer both). Figures are a year-1 estimate at your 24.0% rate — not tax advice; consult a CPA.
Schools (NCES district)
- District
- Lexington 02
- NCES district ID
- 4502730
- Math proficiency
- 30% ▼ -6.00%
- Reading proficiency
- 38% ▬ 0.00%
- Median HH income
- $42,532
- Composite
- 28.78/100
- National rank
- #6669
- State rank
- #45 of 80 in SC
Livability — Gaston
- Score
- 65/100
- State rank
- #142
- US rank
- #13451
Category grades
Schools grade is shown separately in the Schools card above.
Census & demographics
- City population
- 20,818
- Population (ZIP)
- 9,354
Population outlook (Lexington County) Hauer SSP2
- Today (2025)
- 322,999 people
- By 2030
- 342,356 · +6.0%
- By 2040
- 377,715 · +16.9%
- By 2050
- 406,984 · +26.0%
- By 2075
- 465,447 · +44.1%
- By 2100
- 485,674 · +50.4%
Race, ethnicity, and origin ACS 2023
- Neighborhood character
- Diverse neighborhood (Simpson 0.55)
- Race & ethnicity
- White 60% Black 29% Two or more races 6% Hispanic / Latino 5% Asian 1%
- Hispanic origin (detail)
- Mexican 1% Puerto Rican 2%
- Common ancestry
- Serbian 7% Slovak 2% Italian 2%
- Foreign-born
- 3% · Canada
- Languages at home
- 95% English-only · Spanish 3% Other Asian/Pacific 1%
Political lean MEDSL · Lexington
- 2024 margin
- Solid R (+33.5) · D 32.5% · R 66.0% · Other 1.4%
- 2008→2024 swing
- +4.6pp toward D · 2008: -38.0pp · 2024: -33.5pp
- All cycles
- 2024: R+33.5 2020: R+30.1 2016: R+36.7 2012: R+37.8 2008: R+38.0
Not yet ingested
- Civics
- —
Market trends
- HPI YoY
- ▲ 45.94%
- Current HPI
- 364.73
- Rent YoY
- —
- Metro
- —
- State GDP YoY
- ▲ 4.51%
- F500 in state
- 2
Industry mix (Fortune 500 HQ in SC)
| Industry | F500 HQs | Revenue |
|---|---|---|
| Packaging | 1 | $7B |
|
||
Price history
-68.7% since first listed5 events — show timeline
- 2026-06-04 Listed $19,900 Consolidated MLS
- 2026-04-24 Price Changed $69,600 Consolidated MLS
- 2026-04-04 Price Changed $74,500 Consolidated MLS
- 2026-03-13 Listed $79,500 Consolidated MLS
- 2005-01-21 Sold (Public Records) $63,600 Public Records
Property tax history
-15.8%/yrLatest (2023): $175 · -9.1% YoY. Source: county tax records.
Cash-flow waterfall
monthlySold comps — $/sqft
last 12 mo · ≤1 miLoading sold comps…