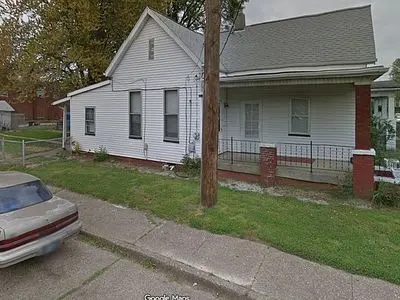
1021 Henning Ave · Evansville, IN
Flood risk 5/10 · Moderate
- FEMA flood zone
- X
- Chance of flooding over 30 yrs
- 0.66%
- Est. flood insurance / yr
- $473 – $860
Fire risk 1/10 · Minimal
- Est. fire insurance / yr
- $717 – $1,331
Heat risk 5/10 · Moderate
- Hot days now (above 107°F)
- 7 days/yr
- Hot days in 30 yrs
- 19 days/yr
Wind risk 2/10 · Minimal
- Chance of severe wind over 30 yrs
- 3.0%
Air-quality risk 3/10 · Minor
- Unhealthy air days now
- 3 days/yr
- Unhealthy air days in 30 yrs
- 4 days/yr
Risk factors via First Street. Map © Google.
Why this score? — see what drove the B grade
The composite is a weighted blend of 9 inputs, each scored 0–100. Each bar is that input's sub-score; the figure is the points it added to the 100-point composite (weight × sub-score).
- Cash flow +30.0/30.0
- 1% rule +10.0/10.0
- DSCR +10.0/10.0
- ARV discount +7.5/15.0
- Rent growth +4.5/5.0
- Schools +3.3/10.0
- Livability +3.2/5.0
- Condition / age +2.5/5.0
- Appreciation +0.0/10.0
$60,000
🖨 Deal sheet 📄 Offer letter ✓ Due diligence
Listing remarks
Investor Special! Solid 2 bed/1 bath fixer-upper on corner lot with garage. Priced AS-IS for a quick sale. Bank appraisal confirms good bones. Electric, plumbing, walls, ceilings all appear to be decent. Needs full kitchen & amp; bathroom remodel, new floors, and some roof/awning repair. 2 bedrooms, 1 bathroom, 905 sq ft Built 1915 on a 4,160 sq ft corner lot Detached old garage + fully fenced backyard Alley access + church behind + empty lot next door (church-owned, well maintained) The bank appraiser said the core of the house is in great shape for its age Original hardwood floors throughout (damaged but repairable or ready for new flooring over top) Walls, electrical, plumbing all fu
Key facts
- Basement cellar
- Corner lot
- Detached garage
Tags
Property features AI
Exterior
- Home design: Built in 1915
- Construction: Historic 1915 construction
- Exterior features: Located in the Presidents subdivision
Neighborhood map
What this means for you Summary
Snapshot
- This is a 2-bed/1.0-bath single-family listed at $60k.
Deal economics
- At list price, monthly cash flow is $345 ($4k/yr) — positive.
- The deal already cash-flows at list — no discount required.
- Meets the 1% rule at list price ($1k rent vs $60k).
- Recommended offer: $58k (3.0% below list) — sets the bar for market timing.
- Cap rate 13.2% vs local median 4.6% in Evansville — top-decile yield for the area; either an underpriced asset or a hidden risk that comps aren't pricing in. Stress-test before assuming the spread holds.
Location & tenants
- Location reads 63/100 on livability (#416 in IN) — a middle-class / working-renter tenant base. Strengths: cost of living A+, housing A+, health & safety A+; Watch: schools D+, crime F, commute F.
- Evansville Vanderburgh School Corporation (urban): math 36% / reading 43% proficiency, ranked #153 of 301 in IN (top 51%) — families likely to look elsewhere, expect single-tenant / working-renter base with shorter leases.
- Market conditions: Rents rising fast (+7.9%/yr); 188 active listings in the ZIP; 30 comparable units currently listed for rent nearby; rentals at typical pace (median 21d on market — plan ~3-4 weeks tenant-placement turnaround); 508 units permitted in Vanderburgh County in 2024 (32 in 5+ unit buildings).
Forward outlook
- Local home prices are declining (-3.0%/yr); year-one equity from $415 of loan paydown is wiped out by about $2k of value loss. Plan a longer hold.
- At projected returns (-3.0% appreciation + 7.9% rent growth), your $17k cash investment doubles in ~5 years — after that, you're playing with house money.
Negotiation context
- It's been on market 37 days — a 3% lower offer ($58k) is reasonable based on typical stale-listing flexibility.
Risks & watch-outs
- Watch-outs: built in 1915 — expect roof / HVAC / electrical / plumbing capex.
- Climate carrying-cost: moderate flood risk; extreme-heat days projected 7→19/yr by 2055 (HVAC capex compounding) — expect insurance premiums to compound above CPI over the hold.
Questions for the listing agent
- It's been on market 37 days. Have you received any prior offers? Is the seller open to a 3% concession, seller financing, or rate buy-down credit?
- Built in 1915 — when were the roof, HVAC, electrical panel, plumbing, and water heater last replaced?
- Is there a deadline driving the sale (1031 exchange, divorce, estate, relocation)? That informs how much negotiation room exists.
- Schools are D-rated, which usually means shorter tenancies and higher turnover. Who's the typical renter profile here, and what's been the actual vacancy rate?
- Crime grade is F in this area — have there been break-ins, vandalism, or insurance claims at this property in the last 3 years? What carrier currently insures it and at what premium?
- What's the average days-on-market for RENTAL listings here right now (not sales)? A rising rental-DOM trend means longer vacancies and softer asking-rent achievability than the comps imply.
- What's the recent tenant-quality profile in this submarket — average credit score on applications, eviction rate, late-payment / NSF rate, and stable-employment percentage? A property-management company in the area should have these aggregated.
- How much new for-sale + rental construction is in the pipeline within 1–3 miles? Heavy new supply typically softens prices + rents 12–24 months out; constrained supply supports both.
Investment metrics
- 1% rule
- 1.69% ✓
- Cap rate
- 13.20%
- Cash-on-cash
- 24.65%
- DSCR
- 2.10
- GRM
- 4.9
CMA / ARV
- ARV (on-the-fly)
- $139,370
- Comps found
- 12
Show comp detail 12 sales within ~0.75 mi
| Address | Dist | Beds/Ba | Sqft | Sold | Price | $/sf | Match |
|---|---|---|---|---|---|---|---|
| 1203 Lodge Ave | 0.18mi | 3/1.0 (+1) | 864 (-4%) | 4mo | $60,000 | $69 | 76 |
| 1801 E Powell Ave | 0.52mi | 2/1.0 | 880 (-3%) | 1mo | $168,500 | $191 | 70 |
| 1401 Lodge Ave | 0.29mi | 3/1.0 (+1) | 990 (+9%) | 0mo | $145,000 | $146 | 66 |
| 1152 E Chandler Ave | 0.29mi | 3/1.0 (+1) | 825 (-9%) | 4mo | $127,000 | $154 | 64 |
| 1913 Monroe Ave | 0.62mi | 2/1.0 | 936 (+3%) | 4mo | $155,900 | $167 | 62 |
| 1410 Sweetser Ave | 0.73mi | 2/1.0 | 928 (+2%) | 1mo | $165,000 | $178 | 61 |
| 1159 Sweetser Ave | 0.75mi | 2/1.0 | 888 (-2%) | 2mo | $82,500 | $93 | 60 |
| 1451 Bellemeade Ave | 0.44mi | 2/1.0 | 1,016 (+12%) | 2mo | $215,000 | $212 | 58 |
| 1505 Jackson Ave | 0.36mi | 2/1.0 | 780 (-14%) | 4mo | $38,750 | $50 | 57 |
| 1615 Ravenswood Dr | 0.52mi | 2/1.0 | 805 (-11%) | 1mo | $99,900 | $124 | 56 |
| 2020 E Blackford Ave | 0.70mi | 2/1.0 | 840 (-7%) | 3mo | $138,500 | $165 | 52 |
| 1407 Waggoner Ave | 0.55mi | 2/1.0 | 775 (-14%) | 1mo | $94,500 | $122 | 49 |
Match score weights: distance 35% · size 25% · config 20% · recency 20%. Top-matched comps best support the ARV.
Projected returns pro-forma
-3.0% appreciation · 7.86% rent growth · sell at horizon
- IRR
- 23.7%
- Equity multiple
- 2.04×
- Total profit
- $17,510
- Equity at exit
- $8,946
- IRR
- 34.7%
- Equity multiple
- 5.01×
- Total profit
- $67,363
- Equity at exit
- $5,188
Cash invested: $16,800 (down + closing). Projections, not guarantees.
Landlord ↔ Tenant lean methodology
- Overall (STATE)
- 90 Strongly Landlord-Friendly
- State Indiana
- 90 Strongly Landlord-Friendly · R+11
- County
- — inherits STATE
- City
- — inherits STATE
ZIP-level market 47714
- Rents YoY
- 7.9%
- Active inventory
- 188
- Price-to-rent
- 4.9×
Monthly cashflow live
- Estimated rent
- $1,016 high interval (Pro) →
- Mortgage (P&I)
- −$315
- Tax from tax record
- −$118 /mo · $1,411/yr
- Insurance
- −$25
- HOA
- −$0
- Vacancy / Maint / Mgmt
- −$213
- Net cashflow
- $345
Break-even live
UW: 25.0% down · 7.5% · 30yr · 1.5% tax · 5.0% vac · 8.0% maint · 8.0% mgmt
Financing live
Cash to close
- Down payment
- $15,000
- Closing costs
- $1,800
- Reserves months
- —
- Total cash needed
- —
Loan-product check · same deal, 3 products live
Conventional
25% down · 7.5% · 30yr
- Down + closing
- —
- Monthly P&I
- —
- Monthly cashflow
- —
- DSCR
- —
- Eligible?
- —
Personal DTI + credit; lowest rate.
DSCR
20% down · 8.5% · 30yr
- Down + closing
- —
- Monthly P&I
- —
- Monthly cashflow
- —
- DSCR
- —
- Eligible?
- —
No personal income docs; deal must DSCR.
Hard money
10% down · 12.0% · 12mo
- Down + closing
- —
- Monthly P&I
- —
- Monthly cashflow
- —
- DSCR
- —
- Eligible?
- —
Short-term bridge; refi at stabilization.
Rent comps 30 comps
| Address | Beds | Baths | Sqft | Rent | $/sqft | DOM | Units | Dist |
|---|---|---|---|---|---|---|---|---|
| 1021 Jefferson Ave Evansville, IN | 1.0 | 1.0 | 798 | $795 | $1.00 | 13d | 1 | 0.32mi |
| 1133 Bayard Park Dr Unit B Evansville, IN | 2.0 | 1.0 | 990 | $800 | $0.81 | 21d | 1 | 0.33mi |
| 1500 S Harlan Ave Evansville, IN | 2.0 | 1.0 | 712 | $900 | $1.26 | 13d | 1 | 0.33mi |
| 1505 Jackson Ave Evansville, IN | 2.0 | 1.0 | 780 | $995 | $1.28 | 21d | 1 | 0.36mi |
| 1909 Taylor Ave Evansville, IN | 2.0 | 1.0 | 700 | $1,200 | $1.71 | 13d | 1 | 0.64mi |
| 734 Bayard Park Dr Evansville, IN | 3.0 | 2.0 | 1000 | $1,425 | $1.43 | 21d | 1 | 0.75mi |
| 605 Madison Ave Evansville, IN | 2.0 | 1.0 | 1069 | $1,375 | $1.29 | 21d | 1 | 0.86mi |
| 715 E Riverside Dr Evansville, IN | 2.0 | 1.0 | 806 | $895 | $1.11 | 21d | 1 | 0.92mi |
| 507 S Evans Ave Evansville, IN | 2.0 | 1.0 | 750 | $795 | $1.06 | 21d | 1 | 0.92mi |
| 304 S Grand Ave Evansville, IN | 2.0 | 1.0 | 967 | $955 | $0.99 | 21d | 1 | 0.95mi |
| 1909 Plantation Ct Evansville, IN | 2.0 | 1.0 | 780 | $700 | $0.90 | 21d | 2 | 1.03mi |
| 1762 Spring Ct Evansville, IN | 2.0 | 1.0 | 975 | $1,450 | $1.49 | 21d | 1 | 1.04mi |
| 1952 Colts Ln Evansville, IN | 1.0–3.0 | 1.0 | 1146 | $1,035 | $0.90 | 21d | 8 | 1.07mi |
| 1440 E Division St Evansville, IN | 2.0 | 1.0 | 689 | $1,250 | $1.81 | 13d | 1 | 1.08mi |
| 1321 E Indiana St Evansville, IN | 2.0 | 1.0 | 964 | $1,050 | $1.09 | 13d | 1 | 1.10mi |
| 1303 E Indiana St Evansville, IN | 2.0 | 1.0 | 975 | $1,195 | $1.23 | 13d | 1 | 1.10mi |
| 210 S Weinbach Ave Evansville, IN | 3.0 | 1.0 | 1080 | $1,450 | $1.34 | 21d | 1 | 1.10mi |
| 1415 E Indiana St Evansville, IN | 2.0 | 1.0 | 814 | $795 | $0.98 | 13d | 1 | 1.11mi |
| 827 Judson St Evansville, IN | 3.0 | 1.0 | 1008 | $1,295 | $1.28 | 13d | 1 | 1.15mi |
| 1231 Culver Dr Unit C Evansville, IN | 1.0 | 1.0 | 575 | $625 | $1.09 | 21d | 1 | 1.20mi |
| 924 SE 6th St Unit A Evansville, IN | 1.0 | 1.0 | 800 | $875 | $1.09 | 21d | 1 | 1.24mi |
| 1421 SE 2nd St Unit A Evansville, IN | 1.0 | 1.0 | 800 | $695 | $0.87 | 13d | 1 | 1.24mi |
| 2340 Sunburst Blvd Unit 2210-104 Evansville, IN | 1.0 | 1.0 | 631 | $785 | $1.24 | 21d | 1 | 1.29mi |
| 2340 Sunburst Blvd Unit 2270-318 Evansville, IN | 2.0 | 1.0 | 815 | $900 | $1.10 | 21d | 1 | 1.29mi |
| 2340 Sunburst Blvd Unit 2200-202 Evansville, IN | 3.0 | 1.0 | 973 | $1,050 | $1.08 | 21d | 1 | 1.29mi |
| 900 S Saint James Blvd Evansville, IN | 3.0 | 2.0 | 1118 | $1,450 | $1.30 | 21d | 1 | 1.32mi |
| 17 Washington Ave Evansville, IN | 2.0 | 1.0 | 882 | $1,455 | $1.65 | 21d | 1 | 1.33mi |
| 8 E Blackford Ave Evansville, IN | 1.0 | 1.0 | 750 | $825 | $1.10 | 21d | 1 | 1.35mi |
| 1680 E Franklin St #1682 Evansville, IN | 2.0 | 1.0 | 675 | $855 | $1.27 | 21d | 7 | 1.35mi |
| 615 SE 3rd St Unit D Evansville, IN | 1.0 | 1.0 | 1122 | $895 | $0.80 | 21d | 1 | 1.49mi |
Listing history 15 events
-
2026-06-18days on market $60,000 Active 37 DOM
-
2026-06-17days on market $60,000 Active 36 DOM
-
2026-06-16days on market $60,000 Active 35 DOM
-
2026-06-15days on market $60,000 Active 34 DOM
-
2026-06-14days on market $60,000 Active 32 DOM
-
2026-06-13days on market $60,000 Active 31 DOM
-
2026-06-10days on market $60,000 Active 29 DOM
-
2026-06-09days on market $60,000 Active 28 DOM
-
2026-06-08days on market $60,000 Active 27 DOM
-
2026-06-07days on market $60,000 Active 26 DOM
-
2026-06-02days on market $60,000 Active 21 DOM
-
2026-06-01days on market $60,000 Active 20 DOM
-
2026-05-31days on market $60,000 Active 19 DOM
-
2026-05-30days on market $60,000 Active 18 DOM
-
2026-05-12$60,000 Active
ⓘ Source: listings_history table (triggers on properties + properties_extension) + one-shot
backfill from property_details.listing_events for pre-trigger history.
Tax reassessment forecast IN · Partial reset (capped growth)
- Current annual tax
- $1,411 · $118/mo
- Projected year-2 tax
- $1,411 · $118/mo
- Expected delta
- $0/yr ($0/mo · 0.0%)
ⓘ Screening estimate from a state-policy table — verify with the county assessor before closing.
Climate risk First Street
- Flood 5/10 Major FEMA zone X · 66% chance over 30 yrs
- Wildfire 1/10 Low
- Heat 5/10 Major 7 d/yr ≥107°F today · 19 d/yr by 30 yrs out
- Wind 2/10 Low 3% chance of damaging wind over 30 yrs
- Air quality 3/10 Moderate 3 unhealthy d/yr today · 4 by 30 yrs out
Nearby sold comps map
Loading sold comps map…
Walkable amenities ~0.75 mi
Loading nearby amenities…
Taxation est. · year 1
- Rental income
- $12,188
- − Mortgage interest
- −$3,361
- − Property taxes
- −$1,411
- − Insurance
- −$300
- − Repairs & maintenance
- −$975
- − Management
- −$975
- − Depreciation
- −$1,745
- Taxable income
- $3,420
- Est. tax owed @ 24.0%
- −$821
- After-tax cash flow
- $3,321/yr
For passive investors: Depreciation is non-cash, so a rental often shows a tax loss while cash-flowing — sheltering income. Rental losses are passive: they offset passive income freely, and up to $25,000/yr can offset ordinary (W-2) income if you actively participate and your MAGI is under $100k (phasing out to $0 by $150k); unused losses carry forward. On sale, claimed depreciation is recaptured at up to 25%, and gains may owe capital-gains tax (a 1031 exchange can defer both). Figures are a year-1 estimate at your 24.0% rate — not tax advice; consult a CPA.
Schools (NCES district)
- District
- Evansville Vanderburgh School Corporation
- NCES district ID
- 1803450
- Math proficiency
- 36% ▼ -7.00%
- Reading proficiency
- 43% ▼ -3.00%
- Median HH income
- $43,270
- Composite
- 33.41/100
- National rank
- #5471
- State rank
- #153 of 301 in IN
Livability — Evansville
- Score
- 63/100
- State rank
- #416
- US rank
- #15047
Category grades
Schools grade is shown separately in the Schools card above.
Census & demographics
- Census place
- Evansville, IN
- County
- Vanderburgh County · 146,793 people
- City population
- 146,793
- Metro
- Evansville, IN-KY
- Population (ZIP)
- 32,132
- Household income
- $55,910
- Rent vs Own
- Severe rent burden
- 1394.0
Population outlook (Vanderburgh County) Hauer SSP2
- Today (2025)
- 187,038 people
- By 2030
- 188,907 · +1.0%
- By 2040
- 190,272 · +1.7%
- By 2050
- 188,871 · +1.0%
- By 2075
- 180,751 · -3.4%
- By 2100
- 163,015 · -12.8%
Race, ethnicity, and origin ACS 2023
- Neighborhood character
- Predominantly White (71%)
- Race & ethnicity
- White 71% Black 17% Two or more races 6% Hispanic / Latino 6% Asian 1%
- Hispanic origin (detail)
- Mexican 3%
- Common ancestry
- Italian 3% Lithuanian 2% Slovak 1%
- Foreign-born
- 6% · Canada, China
- Languages at home
- 92% English-only · Spanish 4% Other Asian/Pacific 1% French/Haitian/Cajun 1%
Political lean MEDSL · Vanderburgh
- 2024 margin
- R (+12.7) · D 43.0% · R 55.6% · Other 1.4%
- 2008→2024 swing
- -15.1pp toward R · 2008: 2.5pp · 2024: -12.7pp
- All cycles
- 2024: R+12.7 2020: R+9.6 2016: R+16.9 2012: R+10.8 2008: D+2.5
Not yet ingested
- Civics
- —
Market trends
- HPI YoY
- ▼ -124.80%
- Current HPI
- 211.1755
- Rent YoY
- ▲ 7.86%
- Metro
- Evansville, IN-KY
- State GDP YoY
- ▲ 2.90%
- F500 in state
- 18
Industry mix (Fortune 500 HQ in IN)
| Industry | F500 HQs | Revenue |
|---|---|---|
| Industrial Machinery | 2 | $37B |
|
||
| Healthcare | 1 | $177B |
|
||
| Pharmaceuticals | 1 | $45B |
|
||
| Metals / Steel | 1 | $18B |
|
||
| Agriculture | 1 | $17B |
|
||
| Packaging | 1 | $12B |
|
||
Price history
1 event — show timeline
- 2026-05-12 Listed $60,000 FSBO.com
Property tax history
+2.6%/yrLatest (2024): $1,411 · -0.8% YoY. Source: county tax records.
Cash-flow waterfall
monthlySold comps — $/sqft
last 12 mo · ≤1 miLoading sold comps…