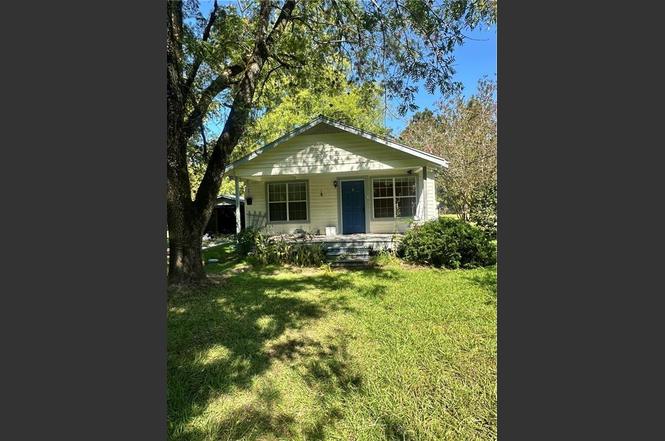
649 Andrus St. St · Marksville, LA
Flood risk 1/10 · Minimal
- FEMA flood zone
- X
- Chance of flooding over 30 yrs
- 0.0%
- Est. flood insurance / yr
- $507 – $1,088
Fire risk 3/10 · Minor
- Est. fire insurance / yr
- $1,269 – $2,357
Heat risk 8/10 · Major
- Hot days now (above 111°F)
- 7 days/yr
- Hot days in 30 yrs
- 19 days/yr
Wind risk 8/10 · Major
- Chance of severe wind over 30 yrs
- 99.0%
Air-quality risk 1/10 · Minimal
- Unhealthy air days now
- 0 days/yr
- Unhealthy air days in 30 yrs
- 0 days/yr
Risk factors via First Street. Map © Google.
Why this score? — see what drove the B- grade
The composite is a weighted blend of 9 inputs, each scored 0–100. Each bar is that input's sub-score; the figure is the points it added to the 100-point composite (weight × sub-score).
- Cash flow +30.0/30.0
- DSCR +10.0/10.0
- 1% rule +9.0/10.0
- ARV discount +7.5/15.0
- Livability +2.6/5.0
- Rent growth +2.5/5.0
- Condition / age +2.5/5.0
- Schools +2.1/10.0
- Appreciation +0.0/10.0
$60,000
🖨 Deal sheet 📄 Offer letter ✓ Due diligence
Listing remarks
This cozy cottage sits on a beautiful shaded . 75-acre lot with large trees, a detached two car carport, and separate storage shed. Windows have been updated and offer an abundance of natural light. Will work for a first-time home buyer, a downsize, or investment. All appliances including washer and dryer will remain.
Key facts
- Shaded lot
- Detached carport
- Updated windows
Tags
Property features AI
Exterior
- Parking: Detached parking
- Home design: Single-family residence
- Construction: Wood siding; Block and frame construction; Metal roof
- Exterior features: Chain link fencing; Workshop; Acreage
Interior
- Kitchen: Refrigerator
- Bedrooms: Two bedrooms (Bedroom 1, Bedroom 2)
- Bathrooms: 1 full bathroom
- Heating & cooling: Window air conditioning units; Other heating
- Interior features: Living room; Bedroom 1; Bedroom 2
- Laundry & utility: Washer; Dryer
Neighborhood map
What this means for you Summary
Snapshot
- This is a 2-bed/1.0-bath single-family listed at $60k.
Deal economics
- At list price, monthly cash flow is $283 ($3k/yr) — positive.
- The deal already cash-flows at list — no discount required.
- Meets the 1% rule at list price ($840 rent vs $60k).
- Recommended offer: $53k (12.0% below list) — sets the bar for market timing.
- Cap rate 11.9% vs local median 6.5% in Marksville — top-decile yield for the area; either an underpriced asset or a hidden risk that comps aren't pricing in. Stress-test before assuming the spread holds.
Location & tenants
- Location reads 52/100 on livability (#415 in LA) — a working-class tenant base; expect higher turnover. Strengths: cost of living A+; Watch: health & safety C-, schools D, crime F.
- Avoyelles Parish (rural): math 22% / reading 30% proficiency, ranked #56 of 98 in LA (top 57%) — low school quality limits family demand, transient renter base, plan for 1-2y turnover; 75% free/reduced lunch — lower-income household profile, screen leases tightly.
- Market conditions: 75 active listings in the ZIP; 15 units permitted in Avoyelles Parish in 2024 (0 in 5+ unit buildings).
Forward outlook
- Local home prices are declining (-3.0%/yr); year-one equity from $415 of loan paydown is wiped out by about $2k of value loss. Plan a longer hold.
- Avoyelles County population projected at -18% by 2050 — secular population decline; favor cash flow + early exit over multi-decade hold.
- At projected returns (-3.0% appreciation + 3.0% rent growth), your $17k cash investment doubles in ~7 years — after that, you're playing with house money.
Negotiation context
- It's been on market 260 days — a 12% lower offer ($53k) is reasonable based on typical stale-listing flexibility.
- 3 sale attempts since 10y ago; this cycle's ask has dropped $30k (33%) from the opening price — seller is motivated, your offer sets the floor, not the list.
Risks & watch-outs
- Watch-outs: built in 1947 — expect roof / HVAC / electrical / plumbing capex.
- Climate carrying-cost: severe wind risk, 99% chance of damaging wind over 30y; extreme-heat days projected 7→19/yr by 2055 (HVAC capex compounding) — expect insurance premiums to compound above CPI over the hold.
Questions for the listing agent
- It's been on market 260 days. Have you received any prior offers? Is the seller open to a 12% concession, seller financing, or rate buy-down credit?
- Built in 1947 — when were the roof, HVAC, electrical panel, plumbing, and water heater last replaced?
- Why hasn't it sold? Are there any deal-killer items the seller is aware of (foundation, flood, title, zoning, code violations)?
- Is there a deadline driving the sale (1031 exchange, divorce, estate, relocation)? That informs how much negotiation room exists.
- Schools are D-rated, which usually means shorter tenancies and higher turnover. Who's the typical renter profile here, and what's been the actual vacancy rate?
- Crime grade is F in this area — have there been break-ins, vandalism, or insurance claims at this property in the last 3 years? What carrier currently insures it and at what premium?
- What's the average days-on-market for RENTAL listings here right now (not sales)? A rising rental-DOM trend means longer vacancies and softer asking-rent achievability than the comps imply.
- What's the recent tenant-quality profile in this submarket — average credit score on applications, eviction rate, late-payment / NSF rate, and stable-employment percentage? A property-management company in the area should have these aggregated.
- How much new for-sale + rental construction is in the pipeline within 1–3 miles? Heavy new supply typically softens prices + rents 12–24 months out; constrained supply supports both.
Investment metrics
- 1% rule
- 1.40% ✓
- Cap rate
- 11.94%
- Cash-on-cash
- 20.18%
- DSCR
- 1.90
- GRM
- 6.0
CMA / ARV
No comps found within radius.
Projected returns pro-forma
-3.0% appreciation · 3.0% rent growth · sell at horizon
- IRR
- 12.4%
- Equity multiple
- 1.49×
- Total profit
- $8,265
- Equity at exit
- $8,946
- IRR
- 21.3%
- Equity multiple
- 2.81×
- Total profit
- $30,335
- Equity at exit
- $5,188
Cash invested: $16,800 (down + closing). Projections, not guarantees.
Landlord ↔ Tenant lean methodology
- Overall (STATE)
- 90 Strongly Landlord-Friendly
- State Louisiana
- 90 Strongly Landlord-Friendly · R+12
- County
- — inherits STATE
- City
- — inherits STATE
ZIP-level market 71351
- Active inventory
- 75
- Price-to-rent
- 6.0×
Monthly cashflow live
- Estimated rent
- $840 medium interval (Pro) →
- Mortgage (P&I)
- −$315
- Tax from tax record
- −$41 /mo · $494/yr
- Insurance
- −$25
- HOA
- −$0
- Vacancy / Maint / Mgmt
- −$176
- Net cashflow
- $283
Break-even live
UW: 25.0% down · 7.5% · 30yr · 1.5% tax · 5.0% vac · 8.0% maint · 8.0% mgmt
Financing live
Cash to close
- Down payment
- $15,000
- Closing costs
- $1,800
- Reserves months
- —
- Total cash needed
- —
Loan-product check · same deal, 3 products live
Conventional
25% down · 7.5% · 30yr
- Down + closing
- —
- Monthly P&I
- —
- Monthly cashflow
- —
- DSCR
- —
- Eligible?
- —
Personal DTI + credit; lowest rate.
DSCR
20% down · 8.5% · 30yr
- Down + closing
- —
- Monthly P&I
- —
- Monthly cashflow
- —
- DSCR
- —
- Eligible?
- —
No personal income docs; deal must DSCR.
Hard money
10% down · 12.0% · 12mo
- Down + closing
- —
- Monthly P&I
- —
- Monthly cashflow
- —
- DSCR
- —
- Eligible?
- —
Short-term bridge; refi at stabilization.
Listing history 25 events
-
2026-06-19days on market $60,000 Active 260 DOM
-
2026-06-18days on market $60,000 Active 259 DOM
-
2026-06-17days on market $60,000 Active 258 DOM
-
2026-06-16days on market $60,000 Active 257 DOM
-
2026-06-15days on market $60,000 Active 256 DOM
-
2026-06-14days on market $60,000 Active 254 DOM
-
2026-06-13days on market $60,000 Active 253 DOM
-
2026-06-10days on market $60,000 Active 251 DOM
-
2026-06-09days on market $60,000 Active 250 DOM
-
2026-06-08days on market $60,000 Active 249 DOM
-
2026-06-07days on market $60,000 Active 248 DOM
-
2026-06-03days on market $60,000 Active 244 DOM
-
2026-06-02days on market $60,000 Active 243 DOM
-
2026-06-01days on market $60,000 Active 242 DOM
-
2026-05-31days on market $60,000 Active 241 DOM
-
2026-05-30days on market $60,000 Active 240 DOM
-
2026-04-29price $60,000
-
2026-03-26price $65,000
-
2026-03-03price $70,000
-
2026-01-12price $78,000
-
2025-11-21price $85,000
-
2025-10-02$90,000 Active
-
2023-09-18soldstatus $83,500
-
2023-08-01$89,900
-
2016-10-19$10,000
ⓘ Source: listings_history table (triggers on properties + properties_extension) + one-shot
backfill from property_details.listing_events for pre-trigger history.
Tax reassessment forecast LA · Resets to sale price
- Current annual tax
- $494 · $41/mo
- Projected year-2 tax
- $494 · $41/mo
- Expected delta
- $0/yr ($0/mo · 0.0%)
ⓘ Screening estimate from a state-policy table — verify with the county assessor before closing.
Climate risk First Street
- Flood 1/10 Low FEMA zone X · 0% chance over 30 yrs
- Wildfire 3/10 Moderate
- Heat 8/10 Severe 7 d/yr ≥111°F today · 19 d/yr by 30 yrs out
- Wind 8/10 Severe 99% chance of damaging wind over 30 yrs
- Air quality 1/10 Low 0 unhealthy d/yr today · 0 by 30 yrs out
Nearby sold comps map
Loading sold comps map…
Walkable amenities ~0.75 mi
Loading nearby amenities…
Taxation est. · year 1
- Rental income
- $10,076
- − Mortgage interest
- −$3,361
- − Property taxes
- −$494
- − Insurance
- −$300
- − Repairs & maintenance
- −$806
- − Management
- −$806
- − Depreciation
- −$1,745
- Taxable income
- $2,564
- Est. tax owed @ 24.0%
- −$615
- After-tax cash flow
- $2,775/yr
For passive investors: Depreciation is non-cash, so a rental often shows a tax loss while cash-flowing — sheltering income. Rental losses are passive: they offset passive income freely, and up to $25,000/yr can offset ordinary (W-2) income if you actively participate and your MAGI is under $100k (phasing out to $0 by $150k); unused losses carry forward. On sale, claimed depreciation is recaptured at up to 25%, and gains may owe capital-gains tax (a 1031 exchange can defer both). Figures are a year-1 estimate at your 24.0% rate — not tax advice; consult a CPA.
Schools (NCES district)
- District
- Avoyelles Parish
- NCES district ID
- 2200150
- Math proficiency
- 22% ▼ -32.00%
- Reading proficiency
- 30% ▼ -29.00%
- Median HH income
- $33,891
- Composite
- 21.32/100
- National rank
- #8378
- State rank
- #56 of 98 in LA
Livability — Marksville
- Score
- 52/100
- State rank
- #415
- US rank
- #25114
Category grades
Schools grade is shown separately in the Schools card above.
Census & demographics
- Census place
- Marksville, LA
- Population (ZIP)
- 11,494
Population outlook (Avoyelles County) Hauer SSP2
- Today (2025)
- 39,084 people
- By 2030
- 37,784 · -3.3%
- By 2040
- 35,049 · -10.3%
- By 2050
- 32,225 · -17.5%
- By 2075
- 25,695 · -34.3%
- By 2100
- 18,985 · -51.4%
Race, ethnicity, and origin ACS 2023
- Neighborhood character
- Majority White (62%)
- Race & ethnicity
- White 62% Black 25% Two or more races 8% Hispanic / Latino 2% Native American 2% Asian 1%
- Common ancestry
- Lithuanian 22% Iranian 1%
- Foreign-born
- 2% · Canada, China, Vietnam
- Languages at home
- 91% English-only · French/Haitian/Cajun 7% Spanish 1% Chinese 1%
Political lean MEDSL · Avoyelles
- 2024 margin
- Solid R (+43.1) · D 27.8% · R 71.0% · Other 1.2%
- 2008→2024 swing
- -20.1pp toward R · 2008: -23.1pp · 2024: -43.1pp
- All cycles
- 2024: R+43.1 2020: R+40.8 2016: R+37.0 2012: R+27.0 2008: R+23.1
Not yet ingested
- Civics
- —
Market trends
- HPI YoY
- ▼ -66.16%
- Current HPI
- 95.5318
- Rent YoY
- —
- Metro
- —
- State GDP YoY
- ▲ 3.29%
- F500 in state
- 10
Industry mix (Fortune 500 HQ in LA)
| Industry | F500 HQs | Revenue |
|---|---|---|
| Telecommunications | 2 | $23B |
|
||
| Utilities | 1 | $12B |
|
||
| Wholesale / Distribution | 1 | $5B |
|
||
| Advertising | 1 | $2B |
|
||
Price history
+500.0% since first listed9 events — show timeline
- 2026-04-29 Price Changed $60,000 AcadianaMLS
- 2026-03-26 Price Changed $65,000 AcadianaMLS
- 2026-03-03 Price Changed $70,000 AcadianaMLS
- 2026-01-12 Price Changed $78,000 AcadianaMLS
- 2025-11-21 Price Changed $85,000 AcadianaMLS
- 2025-10-02 Listed $90,000 AcadianaMLS
- 2023-09-18 Sold (Public Records) $83,500 Public Records
- 2023-08-01 Listed $89,900 AcadianaMLS
- 2016-10-19 Listed $10,000 AcadianaMLS
Property tax history
+7.9%/yrLatest (2025): $494 · +0.0% YoY. Source: county tax records.
Cash-flow waterfall
monthlySold comps — $/sqft
last 12 mo · ≤1 miLoading sold comps…