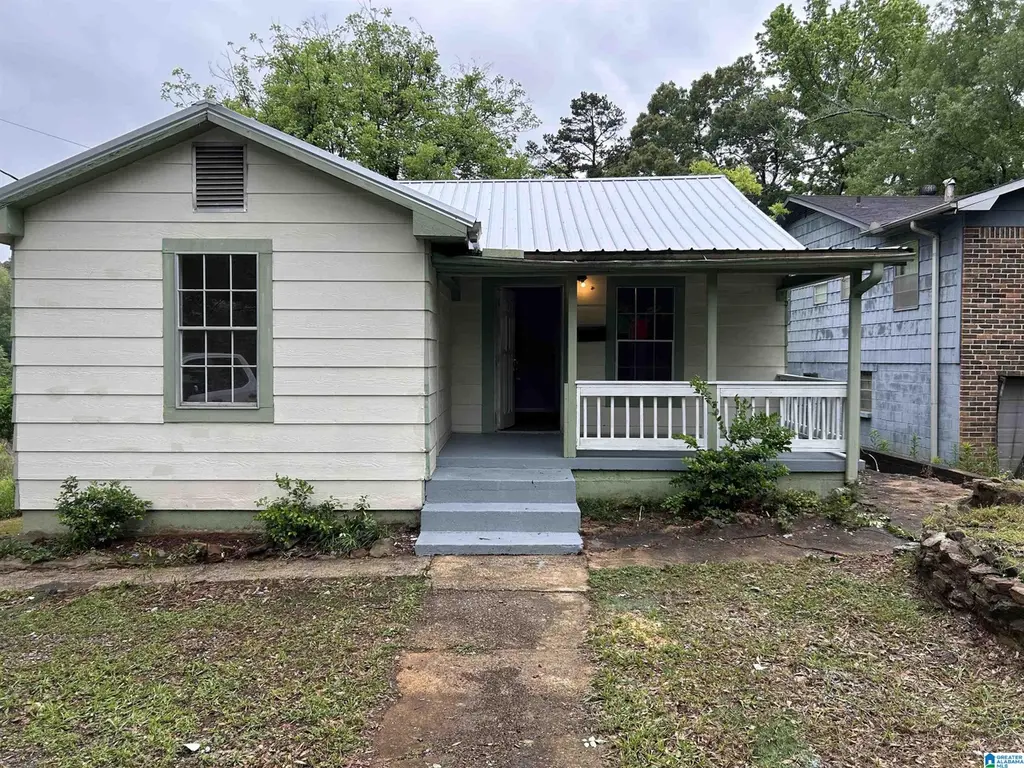
116 Avalon Ave · Hueytown, AL
Flood risk 1/10 · Minimal
- FEMA flood zone
- X (unshaded)
- Chance of flooding over 30 yrs
- 0.0%
- Est. flood insurance / yr
- $473 – $860
Fire risk 2/10 · Minimal
- Est. fire insurance / yr
- $916 – $1,700
Heat risk 6/10 · Moderate
- Hot days now (above 109°F)
- 7 days/yr
- Hot days in 30 yrs
- 19 days/yr
Wind risk 6/10 · Moderate
- Chance of severe wind over 30 yrs
- 27.0%
Air-quality risk 3/10 · Minor
- Unhealthy air days now
- 2 days/yr
- Unhealthy air days in 30 yrs
- 5 days/yr
Risk factors via First Street. Map © Google.
Why this score? — see what drove the C- grade
The composite is a weighted blend of 9 inputs, each scored 0–100. Each bar is that input's sub-score; the figure is the points it added to the 100-point composite (weight × sub-score).
- Cash flow +19.6/30.0
- ARV discount +7.6/15.0
- DSCR +6.2/10.0
- 1% rule +4.7/10.0
- Appreciation +4.7/10.0
- Rent growth +2.9/5.0
- Livability +2.9/5.0
- Condition / age +2.5/5.0
- Schools +1.8/10.0
$129,900
🖨 Deal sheet 📄 Offer letter ✓ Due diligence
Listing remarks
Great Investment Opportunity! TURN-KEY 4-bedroom home offers strong potential for rental income or start home. Featuring a functional floor plan, spacious bedrooms, and solid bones, this property is ideal for investors. Over 43k in updates. See in photos. Section 8 Approved and awaiting an incoming tenant.
Key facts
- 9,147 sq ft lot
- Built 1946
- Listed 10 days
Property features AI
Finance
- Other: Lot size approximately 0.21 acres; Parcel ID: 30-00-31-1-008-012.000
Exterior
- Parking: Off-street parking
- Utilities: Public water; Connected sewer; Electric water heater; Internet service available
- Home design: Existing construction; Single-story main level living; Minor subdivision: Hueytown
- Construction: Siding (other); Crawl space foundation
- Exterior features: No pool, patio, deck, or garden/patio reported; Not waterfront
Interior
- Kitchen: Laminate countertops
- Bedrooms: Four bedrooms, all on main level
- Flooring: Hardwood
- Bathrooms: One full bathroom with tub/shower combo, on main level
- Heating & cooling: Gas heating; Electric cooling
- Interior features: Hardwood floors; Ceilings: see remarks; Attic with walk-up access; No other interior amenities listed
- Laundry & utility: Laundry on main level; Washer hookup provided; Electric dryer hookup
Neighborhood map
What this means for you Summary
Snapshot
- This is a 3-bed/1.0-bath single-family listed at $130k.
Deal economics
- At list price, monthly cash flow is $150 ($2k/yr) — positive.
- The deal already cash-flows at list — no discount required.
- To meet the 1% rule (rent ≥ 1% of price), the offer needs to be $126k (3.1% below list).
- Recommended offer: $126k (3.1% below list) — sets the bar for 1% rule.
- Cap rate 7.7% vs local median 5.9% in Hueytown — top-decile yield for the area; either an underpriced asset or a hidden risk that comps aren't pricing in. Stress-test before assuming the spread holds.
Location & tenants
- Location reads 57/100 on livability (#378 in AL) — a working-class tenant base; expect higher turnover. Strengths: cost of living A+, housing A+; Watch: employment D, crime F, amenities F.
- Jefferson County (suburban): math 9% / reading 32% proficiency, ranked #104 of 129 in AL (top 81%) — low school quality limits family demand, transient renter base, plan for 1-2y turnover.
- Zoned schools: Hueytown Primary School (653 students, 64% FRL); Hueytown High School (math 7% / reading 20%, grade F, #235 of 305 statewide, top 77%, 1,210 students, 79% FRL) — zoned schools average 72% FRL vs 49% district-wide (23 pts higher); higher-poverty schools than district average — tighter screening recommended.
- Market conditions: Rents rising (+1.6%/yr); 250 active listings in the ZIP; 19 comparable units currently listed for rent nearby; rentals at typical pace (median 22d on market — plan ~3-4 weeks tenant-placement turnaround); 42% of comp listings sitting > 30 days — soft ceiling on asking rent; 2,114 units permitted in Jefferson County in 2024 (556 in 5+ unit buildings).
Forward outlook
- In year one you build about $119 of equity ($898 loan paydown + $-779 appreciation (-0.6% local appreciation)).
- Jefferson County population projected to shrink 4% by 2050 — rents likely to lag national; underwrite the cash flow, not the appreciation.
Negotiation context
- Only 10 days on market — expect competitive offers; lowballing is unlikely to land.
- 5 sale attempts with the ask held roughly flat each time — persistent listings suggest the price (not the market) is what's stuck; bring a comps-based counter.
- Current owner paid $78k; list at $130k implies a 67% gain — meaningful room to come down on a strong offer.
Risks & watch-outs
- Watch-outs: built in 1946 — expect roof / HVAC / electrical / plumbing capex.
- Climate carrying-cost: major wind risk, 27% chance of damaging wind over 30y; extreme-heat days projected 7→19/yr by 2055 (HVAC capex compounding) — expect insurance premiums to compound above CPI over the hold.
Questions for the listing agent
- Built in 1946 — when were the roof, HVAC, electrical panel, plumbing, and water heater last replaced?
- Is there a deadline driving the sale (1031 exchange, divorce, estate, relocation)? That informs how much negotiation room exists.
- Schools are F-rated, which usually means shorter tenancies and higher turnover. Who's the typical renter profile here, and what's been the actual vacancy rate?
- Crime grade is F in this area — have there been break-ins, vandalism, or insurance claims at this property in the last 3 years? What carrier currently insures it and at what premium?
- What's the average days-on-market for RENTAL listings here right now (not sales)? A rising rental-DOM trend means longer vacancies and softer asking-rent achievability than the comps imply.
- What's the recent tenant-quality profile in this submarket — average credit score on applications, eviction rate, late-payment / NSF rate, and stable-employment percentage? A property-management company in the area should have these aggregated.
- How much new for-sale + rental construction is in the pipeline within 1–3 miles? Heavy new supply typically softens prices + rents 12–24 months out; constrained supply supports both.
Investment metrics
- 1% rule
- 0.97% ✗
- Cap rate
- 7.68%
- Cash-on-cash
- 4.96%
- DSCR
- 1.22
- GRM
- 8.6
CMA / ARV
- ARV (on-the-fly)
- $130,104
- Comps found
- 12
Show comp detail 12 sales within ~0.75 mi
| Address | Dist | Beds/Ba | Sqft | Sold | Price | $/sf | Match |
|---|---|---|---|---|---|---|---|
| 120 Avalon Ave | 0.02mi | 3/1.0 | 1,140 (+2%) | 1mo | $56,000 | $49 | 94 |
| 1802 Devon Rd | 0.32mi | 3/1.0 | 1,168 (+5%) | 1mo | $94,000 | $80 | 76 |
| 3219 Circle Dr | 0.22mi | 2/1.0 (-1) | 1,064 (-4%) | 4mo | $135,000 | $127 | 74 |
| 2905 Circle Dr | 0.45mi | 2/2.0 (-1) | 1,157 (+4%) | 1mo | $134,800 | $117 | 62 |
| 2032 Shady Ln | 0.27mi | 2/1.0 (-1) | 1,262 (+14%) | 4mo | $112,000 | $89 | 57 |
| 121 Meadowood Ave | 0.74mi | 3/1.0 | 1,053 (-5%) | 2mo | $155,670 | $148 | 55 |
| 3368 Crescent Dr | 0.35mi | 2/2.0 (-1) | 1,242 (+12%) | 1mo | $177,000 | $143 | 55 |
| 304 Sunrise Blvd | 0.62mi | 2/2.0 (-1) | 1,099 (-1%) | 11mo | $108,000 | $98 | 51 |
| 209 Nabors Ave | 0.62mi | 3/2.0 | 1,160 (+4%) | 11mo | $205,000 | $177 | 50 |
| 2731 19th St | 0.55mi | 2/1.0 (-1) | 1,184 (+6%) | 10mo | $153,000 | $129 | 50 |
| 153 24th St | 0.60mi | 3/2.0 | 1,236 (+11%) | 3mo | $90,250 | $73 | 47 |
| 2838 Brooklane Dr | 0.67mi | 3/2.0 | 975 (-12%) | 8mo | $98,150 | $101 | 37 |
Match score weights: distance 35% · size 25% · config 20% · recency 20%. Top-matched comps best support the ARV.
Projected returns pro-forma
-0.6% appreciation · 1.6% rent growth · sell at horizon
- IRR
- 0.2%
- Equity multiple
- 1.01×
- Total profit
- $390
- Equity at exit
- $33,868
- IRR
- 5.3%
- Equity multiple
- 1.51×
- Total profit
- $18,694
- Equity at exit
- $37,753
Cash invested: $36,372 (down + closing). Projections, not guarantees.
Landlord ↔ Tenant lean methodology
- Overall (STATE)
- 90 Strongly Landlord-Friendly
- State Alabama
- 90 Strongly Landlord-Friendly · R+15
- County
- — inherits STATE
- City
- — inherits STATE
ZIP-level market 35023
- Home prices YoY
- -0.1%
- Rents YoY
- 1.6%
- Active inventory
- 250
- Price-to-rent
- 8.6×
Monthly cashflow live
- Estimated rent
- $1,259 high interval (Pro) →
- Mortgage (P&I)
- −$681
- Tax from tax record
- −$109 /mo · $1,305/yr
- Insurance
- −$54
- HOA
- −$0
- Vacancy / Maint / Mgmt
- −$264
- Net cashflow
- $150
Break-even live
UW: 25.0% down · 7.5% · 30yr · 1.5% tax · 5.0% vac · 8.0% maint · 8.0% mgmt
Financing live
Cash to close
- Down payment
- $32,475
- Closing costs
- $3,897
- Reserves months
- —
- Total cash needed
- —
Loan-product check · same deal, 3 products live
Conventional
25% down · 7.5% · 30yr
- Down + closing
- —
- Monthly P&I
- —
- Monthly cashflow
- —
- DSCR
- —
- Eligible?
- —
Personal DTI + credit; lowest rate.
DSCR
20% down · 8.5% · 30yr
- Down + closing
- —
- Monthly P&I
- —
- Monthly cashflow
- —
- DSCR
- —
- Eligible?
- —
No personal income docs; deal must DSCR.
Hard money
10% down · 12.0% · 12mo
- Down + closing
- —
- Monthly P&I
- —
- Monthly cashflow
- —
- DSCR
- —
- Eligible?
- —
Short-term bridge; refi at stabilization.
Rent comps 19 comps
| Address | Beds | Baths | Sqft | Rent | $/sqft | DOM | Units | Dist |
|---|---|---|---|---|---|---|---|---|
| 116 Avalon Ave Bessemer, AL | 4.0 | 1.0 | 1207 | $1,200 | $0.99 | 43d | 1 | 0.03mi |
| 2109 29th Ave N Bessemer, AL | 4.0 | 2.0 | 1217 | $1,323 | $1.09 | 3d | 1 | 0.50mi |
| 309 Sunrise Blvd Bessemer, AL | 2.0 | 1.0 | 1105 | $1,160 | $1.05 | 11d | 1 | 0.56mi |
| 216 Meadowood Ave Bessemer, AL | 3.0 | 1.0 | 1430 | $1,250 | $0.87 | 3d | 1 | 0.63mi |
| 2822 Brooklane Dr Bessemer, AL | 2.0 | 1.0 | 975 | $1,000 | $1.03 | 43d | 1 | 0.68mi |
| 2832 Clyburne St Bessemer, AL | 3.0 | 2.0 | 1295 | $1,650 | $1.27 | 1d | 1 | 0.76mi |
| 208 Kentwood Ave Bessemer, AL | 3.0 | 1.0 | 1177 | $1,075 | $0.91 | 43d | 1 | 0.77mi |
| 119 Lakeland Ave Bessemer, AL | 3.0 | 1.0 | 1042 | $1,125 | $1.08 | 23d | 1 | 0.78mi |
| 2423 Circle Dr Bessemer, AL | 2.0 | 1.0 | 732 | $1,050 | $1.43 | 43d | 1 | 0.91mi |
| 1623 26th Ave N Bessemer, AL | 2.0 | 1.0 | 1004 | $1,095 | $1.09 | 11d | 1 | 0.95mi |
| 110 Ray Ave Apt 7 Hueytown, AL | 2.0 | 2.0 | 900 | $875 | $0.97 | 3d | 1 | 1.09mi |
| 116 Vail Ave Bessemer, AL | 2.0 | 1.0 | 1008 | $975 | $0.97 | 19d | 1 | 1.16mi |
| 2234 19th St N Bessemer, AL | 2.0 | 1.0 | 1106 | $975 | $0.88 | 43d | 1 | 1.19mi |
| 1036 Rose Hill Cir Bessemer, AL | 3.0 | 2.0 | 1277 | $1,300 | $1.02 | 21d | 1 | 1.24mi |
| 2020 High School Rd Unit C Bessemer, AL | 2.0 | 1.0 | 733 | $750 | $1.02 | 14d | 1 | 1.38mi |
| 1409 Hueytown Rd Apt 63 Bessemer, AL | 2.0 | 1.0 | 876 | $995 | $1.14 | 43d | 1 | 1.41mi |
| 1409 Hueytown Rd Unit 76 Bessemer, AL | 2.0 | 1.0 | 876 | $995 | $1.14 | 3d | 1 | 1.41mi |
| 622 S Parkell Ave Bessemer, AL | 3.0 | 1.0 | 963 | $1,200 | $1.25 | 43d | 1 | 1.41mi |
| 123 Westbrook Rd Bessemer, AL | 3.0 | 2.0 | 1427 | $1,275 | $0.89 | 44d | 1 | 1.42mi |
Listing history 8 events
-
2026-06-18days on market $129,900 Active 10 DOM
-
2026-06-17days on market $129,900 Active 9 DOM
-
2026-06-16days on market $129,900 Active 8 DOM
-
2026-06-15days on market $129,900 Active 7 DOM
-
2026-06-13days on market $129,900 Active 5 DOM
-
2026-06-10days on market $129,900 Active 2 DOM
-
2026-06-09remarks 307-char remark
-
2026-06-09$129,900 Active 1 DOM
ⓘ Source: listings_history table (triggers on properties + properties_extension) + one-shot
backfill from property_details.listing_events for pre-trigger history.
Tax reassessment forecast AL · Resets to sale price
- Current annual tax
- $1,305 · $109/mo
- Projected year-2 tax
- $1,305 · $109/mo
- Expected delta
- $0/yr ($0/mo · 0.0%)
ⓘ Screening estimate from a state-policy table — verify with the county assessor before closing.
Climate risk First Street
- Flood 1/10 Low FEMA zone X (unshaded) · 0% chance over 30 yrs
- Wildfire 2/10 Low
- Heat 6/10 Major 7 d/yr ≥109°F today · 19 d/yr by 30 yrs out
- Wind 6/10 Major 27% chance of damaging wind over 30 yrs
- Air quality 3/10 Moderate 2 unhealthy d/yr today · 5 by 30 yrs out
Nearby sold comps map
Loading sold comps map…
Walkable amenities ~0.75 mi
Loading nearby amenities…
Taxation est. · year 1
- Rental income
- $15,105
- − Mortgage interest
- −$7,276
- − Property taxes
- −$1,305
- − Insurance
- −$650
- − Repairs & maintenance
- −$1,208
- − Management
- −$1,208
- − Depreciation
- −$3,779
- Taxable loss
- −$322
- Est. tax savings @ 24.0%
- +$77
- After-tax cash flow
- $1,881/yr
For passive investors: Depreciation is non-cash, so a rental often shows a tax loss while cash-flowing — sheltering income. Rental losses are passive: they offset passive income freely, and up to $25,000/yr can offset ordinary (W-2) income if you actively participate and your MAGI is under $100k (phasing out to $0 by $150k); unused losses carry forward. On sale, claimed depreciation is recaptured at up to 25%, and gains may owe capital-gains tax (a 1031 exchange can defer both). Figures are a year-1 estimate at your 24.0% rate — not tax advice; consult a CPA.
Schools (NCES district)
- District
- Jefferson County
- NCES district ID
- 0101920
- Math proficiency
- 9% ▼ -24.00%
- Reading proficiency
- 32% ▼ -5.00%
- Median HH income
- $51,712
- Composite
- 18.4/100
- National rank
- #8937
- State rank
- #104 of 129 in AL
Livability — Hueytown
- Score
- 57/100
- State rank
- #378
- US rank
- #21611
Category grades
Schools grade is shown separately in the Schools card above.
Census & demographics
- Census place
- Hueytown, AL
- County
- Jefferson County · 527,445 people
- Metro
- Birmingham-Hoover, AL
- Population (ZIP)
- 25,533
- Household income
- $69,863
- Rent vs Own
- Severe rent burden
- 247.0
Population outlook (Jefferson County) Hauer SSP2
- Today (2025)
- 669,185 people
- By 2030
- 669,694 · +0.1%
- By 2040
- 661,388 · -1.2%
- By 2050
- 643,086 · -3.9%
- By 2075
- 577,267 · -13.7%
- By 2100
- 474,758 · -29.1%
Race, ethnicity, and origin ACS 2023
- Neighborhood character
- Diverse neighborhood (Simpson 0.56)
- Race & ethnicity
- White 58% Black 30% Hispanic / Latino 7% Two or more races 3%
- Hispanic origin (detail)
- Mexican 5%
- Common ancestry
- Slovak 1% Lithuanian 1% Serbian 1%
- Foreign-born
- 4% · Canada
- Languages at home
- 93% English-only · Spanish 7%
Political lean MEDSL · Jefferson
- 2024 margin
- D (+10.4) · D 54.6% · R 44.2% · Other 1.2%
- 2008→2024 swing
- +5.4pp toward D · 2008: 5.1pp · 2024: 10.4pp
- All cycles
- 2024: D+10.4 2020: D+13.2 2016: D+7.2 2012: D+6.0 2008: D+5.1
Not yet ingested
- Civics
- —
Market trends
- HPI YoY
- ▼ -0.60%
- Current HPI
- 389.38
- Rent YoY
- ▲ 1.60%
- Metro
- Birmingham-Hoover, AL
- State GDP YoY
- ▲ 2.94%
- F500 in state
- 4
Industry mix (Fortune 500 HQ in AL)
| Industry | F500 HQs | Revenue |
|---|---|---|
| Financial Services | 1 | $8B |
|
||
| Healthcare | 1 | $5B |
|
||
Price history
+66.5% since first listed12 events — show timeline
- 2026-06-08 Listed $129,900 Greater Alabama MLS
- 2026-01-21 Listed for Rent $1,200 BUILDIUM
- 2026-01-21 Rental Removed $1,200 TENANTTURNER2
- 2025-12-06 Listed for Rent $1,200 TENANTTURNER2
- 2025-08-14 Rental Removed $1,200 BUILDIUM
- 2025-07-21 Listed for Rent $1,200 BUILDIUM
- 2025-07-21 Rental Removed $1,200 TENANTTURNER2
- 2025-06-26 Price Changed $1,200 TENANTTURNER2
- 2025-06-11 Price Changed $1,250 TENANTTURNER2
- 2025-06-05 Price Changed $1,300 TENANTTURNER2
- 2025-05-20 Listed for Rent $1,400 TENANTTURNER2
- 2025-02-07 Sold (Public Records) $78,000 Public Records
Property tax history
+23.8%/yrLatest (2025): $1,305 · +0.0% YoY. Source: county tax records.
Cash-flow waterfall
monthlySold comps — $/sqft
last 12 mo · ≤1 miLoading sold comps…