 Fourplex
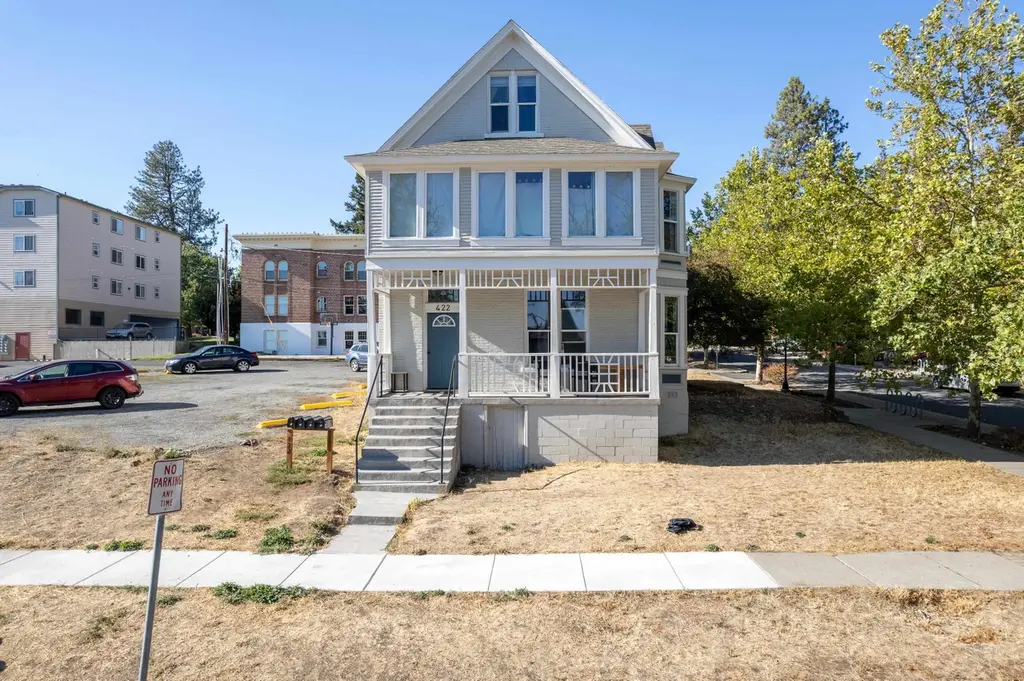
422 4th St · Cheney, WA
Flood risk 1/10 · Minimal
- FEMA flood zone
- X (unshaded)
- Chance of flooding over 30 yrs
- 0.0%
- Est. flood insurance / yr
- $473 – $860
Fire risk 8/10 · Major
- Est. fire insurance / yr
- $604 – $1,122
Heat risk 2/10 · Minimal
- Hot days now (above 94°F)
- 7 days/yr
- Hot days in 30 yrs
- 15 days/yr
Wind risk 1/10 · Minimal
- Chance of severe wind over 30 yrs
- —
Air-quality risk 8/10 · Major
- Unhealthy air days now
- 13 days/yr
- Unhealthy air days in 30 yrs
- 14 days/yr
Risk factors via First Street. Map © Google.
Why this score? — see what drove the B- grade
The composite is a weighted blend of 9 inputs, each scored 0–100. Each bar is that input's sub-score; the figure is the points it added to the 100-point composite (weight × sub-score).
- Cash flow +30.0/30.0
- 1% rule +10.0/10.0
- DSCR +10.0/10.0
- Schools +4.6/10.0
- Livability +4.0/5.0
- Condition / age +3.8/5.0
- Rent growth +3.1/5.0
- ARV discount +0.0/15.0
- Appreciation +0.0/10.0
$450,000
🖨 Deal sheet 📄 Offer letter ✓ Due diligence
Multi-family units
County records classify this as Multi-Family (2-4 Unit). Listing-text estimate: 4 units. confirmed
Listing remarks MLS
Attention Investors! Exceptional 4-Unit Rental Income Property near EWU!This well-maintained Victorian home, converted into a charming 4-plex, is situated in a prime location right on Greek Row, just one block from campus. Perfect for students & visitors alike! All currently occupied. Each unit is unique in its own way, offering character & individual charm that sets this property apart. A couple of the units have also served as successful Airbnbs. Enjoy outdoor relaxation on two inviting porches. Recent updates: new appliances, fixtures, flooring, & fresh paint throughout. The exterior of home has been freshly painted. All units have individual electric meters, w/ landlord covering Wi-Fi & water. Tenants responsible for electric, sewer, & garbage. Roof and windows replaced within the last 18 years. Newly remodeled tiled bathrooms. Window A/C units in all units. Unfinished basement offers additional storage potential. 5 parking spots. This is a rare opportunity in a sought after rental market.
Key facts
- Charming 4 plex
- Unique units
- Victorian home
Tags
Neighborhood map
What this means for you Summary
Snapshot
- This is a 4 × 4-bed/4.0-bath units multifamily listed at $450k. Condition is rated good.
Deal economics
- At list price, monthly cash flow is $3k ($33k/yr) — positive. Per door: $681/mo.
- The deal already cash-flows at list — no discount required.
- Meets the 1% rule at list price ($7k rent vs $450k).
- Recommended offer: $396k (12.0% below list) — sets the bar for market timing.
- Cap rate 13.6% vs local median 2.2% in Cheney — top-decile yield for the area; either an underpriced asset or a hidden risk that comps aren't pricing in. Stress-test before assuming the spread holds.
Location & tenants
- Location reads 79/100 on livability (#108 in WA, #2,146 nationally) — a middle-class / working-renter tenant base. Strengths: commute A+, health & safety A+, schools B+; Watch: crime C-, amenities C-, employment D.
- Cheney School District (town): math 47% / reading 56% proficiency, ranked #140 of 291 in WA (top 48%) — acceptable for families but not a draw, mixed tenant base, ~2y average lease.
- Market conditions: Rents rising (+2.3%/yr); 316 active listings in the ZIP; 3,608 units permitted in Spokane County in 2024 (1,792 in 5+ unit buildings).
- At $7,386/mo this rent would consume 132% of the median local household income ($67k/yr) (locally 1045% of renters already pay >50% of income on rent) — very limited rent-growth headroom before tenants either downsize or default.
Forward outlook
- Local home prices are declining (-3.0%/yr); year-one equity from $3k of loan paydown is wiped out by about $14k of value loss. Plan a longer hold.
- Spokane County population projected at +13% by 2050 — modest demand growth; plan on rents tracking national, not racing it.
- At projected returns (-3.0% appreciation + 2.3% rent growth), your $126k cash investment doubles in ~5 years — after that, you're playing with house money.
Negotiation context
- It's been on market 133 days — a 12% lower offer ($396k) is reasonable based on typical stale-listing flexibility.
- 9 sale attempts since 14y ago with the ask held roughly flat each time — persistent listings suggest the price (not the market) is what's stuck; bring a comps-based counter.
- Current owner paid $285k; list at $450k implies a 58% gain — meaningful room to come down on a strong offer.
Risks & watch-outs
- Watch-outs: built in 1895 — expect roof / HVAC / electrical / plumbing capex.
- Climate carrying-cost: severe wildfire risk — expect insurance premiums to compound above CPI over the hold.
Questions for the listing agent
- It's been on market 133 days. Have you received any prior offers? Is the seller open to a 12% concession, seller financing, or rate buy-down credit?
- Can we see the unit-by-unit rent roll, current vacancy, and any below-market leases? What's the average tenancy length?
- What capital expenditures (roof, boiler, parking lot, exteriors) have been made in the last 5 years, and what's planned in the next 2?
- Built in 1895 — when were the roof, HVAC, electrical panel, plumbing, and water heater last replaced?
- Why hasn't it sold? Are there any deal-killer items the seller is aware of (foundation, flood, title, zoning, code violations)?
- Is there a deadline driving the sale (1031 exchange, divorce, estate, relocation)? That informs how much negotiation room exists.
- Schools are B-rated — typically a magnet for longer-tenancy family renters. What's the average tenant stay here, and is there a school-zone premium baked into asking?
- What's the average days-on-market for RENTAL listings here right now (not sales)? A rising rental-DOM trend means longer vacancies and softer asking-rent achievability than the comps imply.
- What's the recent tenant-quality profile in this submarket — average credit score on applications, eviction rate, late-payment / NSF rate, and stable-employment percentage? A property-management company in the area should have these aggregated.
- How much new apartment / multifamily construction is in the pipeline within 1–3 miles? Heavy new supply (>2% of stock underway) typically softens rents 12–24 months out; light construction supports rent growth.
Investment metrics
- 1% rule
- 1.64% ✓
- Cap rate
- 13.56%
- Cash-on-cash
- 25.95%
- DSCR
- 2.15
- GRM
- 5.1
CMA / ARV
- ARV (median comp)
- $333,062
- List price
- $450,000
- Delta
- 35.11%
- Verdict
- OVERPRICED
- Comps
- 20 within 1.0 mi
Projected returns pro-forma
-3.0% appreciation · 2.31% rent growth · sell at horizon
- IRR
- 18.9%
- Equity multiple
- 1.76×
- Total profit
- $95,662
- Equity at exit
- $67,096
- IRR
- 26.7%
- Equity multiple
- 3.27×
- Total profit
- $286,633
- Equity at exit
- $38,908
Cash invested: $126,000 (down + closing). Projections, not guarantees.
Landlord ↔ Tenant lean methodology
- Overall (STATE)
- 28 Tenant-Leaning
- State Washington
- 28 Tenant-Leaning · D+8
- County
- — inherits STATE
- City
- — inherits STATE
ZIP-level market 99004
- Home prices YoY
- -22.5%
- Rents YoY
- 2.3%
- Active inventory
- 316
- Price-to-rent
- 20.3×
Monthly cashflow live
- Estimated rent
- $7,386 medium interval (Pro) →
- Mortgage (P&I)
- −$2,360
- Tax est. 1.5%
- −$562 /mo · $6,750/yr
- Insurance
- −$188
- HOA
- −$0
- Vacancy / Maint / Mgmt
- −$1,551
- Net cashflow
- $2,725
Break-even live
4-unit breakdown (identical units grouped — click to expand)
| Units | Beds | Baths | Est. rent |
|---|---|---|---|
| 4× units | 4 | 4 | $7,384 |
| #1 | 4 | 4 | $1,846 |
| #2 | 4 | 4 | $1,846 |
| #3 | 4 | 4 | $1,846 |
| #4 | 4 | 4 | $1,846 |
| Total (4 units) | $7,386 | ||
UW: 25.0% down · 7.5% · 30yr · 1.5% tax · 5.0% vac · 8.0% maint · 8.0% mgmt
Financing live
Cash to close
- Down payment
- $112,500
- Closing costs
- $13,500
- Reserves months
- —
- Total cash needed
- —
Loan-product check · same deal, 3 products live
Conventional
25% down · 7.5% · 30yr
- Down + closing
- —
- Monthly P&I
- —
- Monthly cashflow
- —
- DSCR
- —
- Eligible?
- —
Personal DTI + credit; lowest rate.
DSCR
20% down · 8.5% · 30yr
- Down + closing
- —
- Monthly P&I
- —
- Monthly cashflow
- —
- DSCR
- —
- Eligible?
- —
No personal income docs; deal must DSCR.
Hard money
10% down · 12.0% · 12mo
- Down + closing
- —
- Monthly P&I
- —
- Monthly cashflow
- —
- DSCR
- —
- Eligible?
- —
Short-term bridge; refi at stabilization.
Listing history 36 events
-
2026-06-18days on market $450,000 Active 133 DOM
-
2026-06-17days on market $450,000 Active 132 DOM
-
2026-06-16days on market $450,000 Active 131 DOM
-
2026-06-15days on market $450,000 Active 130 DOM
-
2026-06-14days on market $450,000 Active 128 DOM
-
2026-06-13days on market $450,000 Active 127 DOM
-
2026-06-10days on market $450,000 Active 125 DOM
-
2026-06-09days on market $450,000 Active 124 DOM
-
2026-06-08days on market $450,000 Active 123 DOM
-
2026-06-07days on market $450,000 Active 122 DOM
-
2026-06-05days on market $450,000 Active 119 DOM
-
2026-06-03days on market $450,000 Active 118 DOM
-
2026-06-02days on market $450,000 Active 117 DOM
-
2026-06-01days on market $450,000 Active 116 DOM
-
2026-05-31days on market $450,000 Active 115 DOM
-
2026-05-31days on market $450,000 Active 114 DOM
-
2026-02-05$450,000 Active 1037-char remark
Show marketing remark (1037 chars)
Attention Investors! Exceptional 4-Unit Rental Income Property near EWU!This well-maintained Victorian home, converted into a charming 4-plex, is situated in a prime location right on Greek Row, just one block from campus. Perfect for students & visitors alike! All currently occupied. Each unit is unique in its own way, offering character & individual charm that sets this property apart. A couple of the units have also served as successful Airbnbs. Enjoy outdoor relaxation on two inviting porches. Recent updates: new appliances, fixtures, flooring, & fresh paint throughout. The exterior of home has been freshly painted. All units have individual electric meters, w/ landlord covering Wi-Fi & water. Tenants responsible for electric, sewer, & garbage. Roof and windows replaced within the last 18 years. Newly remodeled tiled bathrooms. Window A/C units in all units. Unfinished basement offers additional storage potential. 5 parking spots. This is a rare opportunity in a sought after rental market.
-
2024-10-08$450,000 Active
-
2021-02-02soldstatus $285,000 Sold
-
2021-01-11status Pending
-
2020-12-29status Pending on Inspection
-
2020-11-30status Back On Market
-
2020-11-24status Pending on Inspection
-
2020-11-20$299,000 New
-
2018-06-05soldstatus $212,500
-
2018-05-29historical
-
2018-04-02$210,000
-
2016-07-05soldstatus $180,000
-
2016-06-24historical
-
2015-09-13$195,500
-
2015-09-11historical
-
2015-09-11$196,500
-
2015-08-31historical
-
2015-06-11$196,500
-
2014-06-27historical
-
2012-06-19$235,000
ⓘ Source: listings_history table (triggers on properties + properties_extension) + one-shot
backfill from property_details.listing_events for pre-trigger history.
Climate risk First Street
- Flood 1/10 Low FEMA zone X (unshaded) · 0% chance over 30 yrs
- Wildfire 8/10 Severe
- Heat 2/10 Low 7 d/yr ≥94°F today · 15 d/yr by 30 yrs out
- Wind 1/10 Low
- Air quality 8/10 Severe 13 unhealthy d/yr today · 14 by 30 yrs out
Nearby sold comps map
Loading sold comps map…
Walkable amenities ~0.75 mi
Loading nearby amenities…
Taxation est. · year 1
- Rental income
- $88,632
- − Mortgage interest
- −$25,207
- − Property taxes
- −$6,750
- − Insurance
- −$2,250
- − Repairs & maintenance
- −$7,091
- − Management
- −$7,091
- − Depreciation
- −$13,091
- Taxable income
- $27,153
- Est. tax owed @ 24.0%
- −$6,517
- After-tax cash flow
- $26,184/yr
For passive investors: Depreciation is non-cash, so a rental often shows a tax loss while cash-flowing — sheltering income. Rental losses are passive: they offset passive income freely, and up to $25,000/yr can offset ordinary (W-2) income if you actively participate and your MAGI is under $100k (phasing out to $0 by $150k); unused losses carry forward. On sale, claimed depreciation is recaptured at up to 25%, and gains may owe capital-gains tax (a 1031 exchange can defer both). Figures are a year-1 estimate at your 24.0% rate — not tax advice; consult a CPA.
Condition & rehab AI · 13 photos
This well-maintained 4-unit rental property is in good condition with recent updates. It offers a good investment opportunity with potential for further value enhancement through exterior painting and flooring updates.
Value-add opportunities
- Both Paint exterior again — Fresh paint enhances curb appeal and value
- Both Replace flooring in common areas — New flooring in common areas improves aesthetics and value
Renovation cost estimate screening
Value-add ROI direction
- Both Paint exterior again — Fresh paint enhances curb appeal and value ↑
- Both Replace flooring in common areas — New flooring in common areas improves aesthetics and value ↑
ⓘ Cost ranges are severity-bucket heuristics (US national rule-of-thumb). Get contractor quotes + a written scope before underwriting a rehab budget.
Schools (NCES district)
- District
- Cheney School District
- NCES district ID
- 5301230
- Math proficiency
- 47% ▲ 1.00%
- Reading proficiency
- 56% ▲ 1.00%
- Median HH income
- $46,800
- Composite
- 45.66/100
- National rank
- #5637
- State rank
- #140 of 291 in WA
Livability — Cheney
- Score
- 79/100
- State rank
- #108
- US rank
- #2146
Category grades
Schools grade is shown separately in the Schools card above.
Census & demographics
- Census place
- Cheney, WA
- County
- Spokane County · 496,401 people
- City population
- 22,871
- Metro
- Spokane-Spokane Valley, WA
- Population (ZIP)
- 22,871
- Household income
- $67,337
- Rent vs Own
- Severe rent burden
- 1045.0
Population outlook (Spokane County) Hauer SSP2
- Today (2025)
- 531,314 people
- By 2030
- 549,278 · +3.4%
- By 2040
- 577,822 · +8.8%
- By 2050
- 598,188 · +12.6%
- By 2075
- 630,744 · +18.7%
- By 2100
- 622,360 · +17.1%
Race, ethnicity, and origin ACS 2023
- Neighborhood character
- Predominantly White (79%)
- Race & ethnicity
- White 79% Two or more races 10% Hispanic / Latino 8% Asian 2% Black 2%
- Hispanic origin (detail)
- Mexican 6%
- Common ancestry
- Portuguese 4% Lithuanian 3% Slovak 3%
- Foreign-born
- 6% · Canada, Vietnam
- Languages at home
- 91% English-only · Spanish 4% Russian/Polish/Slavic 1% Arabic 1%
Political lean MEDSL · Spokane
- 2024 margin
- Toss-up / Even · D 46.0% · R 51.0% · Other 3.0%
- 2008→2024 swing
- -3.8pp toward R · 2008: -1.1pp · 2024: -5.0pp
- All cycles
- 2024: R+5.0 2020: R+4.3 2016: R+8.3 2012: R+6.3 2008: R+1.1
Not yet ingested
- Civics
- —
Market trends
- HPI YoY
- ▼ -91.31%
- Current HPI
- 314.1254
- Rent YoY
- ▲ 2.31%
- Metro
- Spokane-Spokane Valley, WA
- State GDP YoY
- ▲ 4.65%
- F500 in state
- 22
Industry mix (Fortune 500 HQ in WA)
| Industry | F500 HQs | Revenue |
|---|---|---|
| Retail | 2 | $269B |
|
||
| Technology / Retail | 1 | $638B |
|
||
| Technology | 1 | $245B |
|
||
| Telecommunications | 1 | $38B |
|
||
| Food / Beverage | 1 | $36B |
|
||
| Automotive / Trucks | 1 | $34B |
|
||
Price history
+91.5% since first listed20 events — show timeline
- 2026-02-05 Listed $450,000 SPOKANEMLS as Distributed by MLS Grid
- 2024-10-08 Listed $450,000 SPOKANEMLS as Distributed by MLS Grid
- 2021-02-02 Sold (MLS) $285,000 SPOKANEMLS as Distributed by MLS Grid
- 2021-01-11 Pending — SPOKANEMLS as Distributed by MLS Grid
- 2020-12-29 Pending — SPOKANEMLS as Distributed by MLS Grid
- 2020-11-30 Relisted — SPOKANEMLS as Distributed by MLS Grid
- 2020-11-24 Pending — SPOKANEMLS as Distributed by MLS Grid
- 2020-11-20 Listed $299,000 SPOKANEMLS as Distributed by MLS Grid
- 2018-06-05 Sold (MLS) $212,500 SPOKANEMLS as Distributed by MLS Grid
- 2018-05-29 Listing Removed — SPOKANEMLS as Distributed by MLS Grid
- 2018-04-02 Listed $210,000 SPOKANEMLS as Distributed by MLS Grid
- 2016-07-05 Sold (MLS) $180,000 SPOKANEMLS as Distributed by MLS Grid
- 2016-06-24 Listing Removed — SPOKANEMLS as Distributed by MLS Grid
- 2015-09-13 Listed $195,500 SPOKANEMLS as Distributed by MLS Grid
- 2015-09-11 Listed $196,500 SPOKANEMLS as Distributed by MLS Grid
- 2015-09-11 Listing Removed — SPOKANEMLS as Distributed by MLS Grid
- 2015-08-31 Listing Removed — SPOKANEMLS as Distributed by MLS Grid
- 2015-06-11 Listed $196,500 SPOKANEMLS as Distributed by MLS Grid
- 2014-06-27 Listing Removed — SPOKANEMLS as Distributed by MLS Grid
- 2012-06-19 Listed $235,000 SPOKANEMLS as Distributed by MLS Grid
Cash-flow waterfall
monthlySold comps — $/sqft
last 12 mo · ≤1 miLoading sold comps…