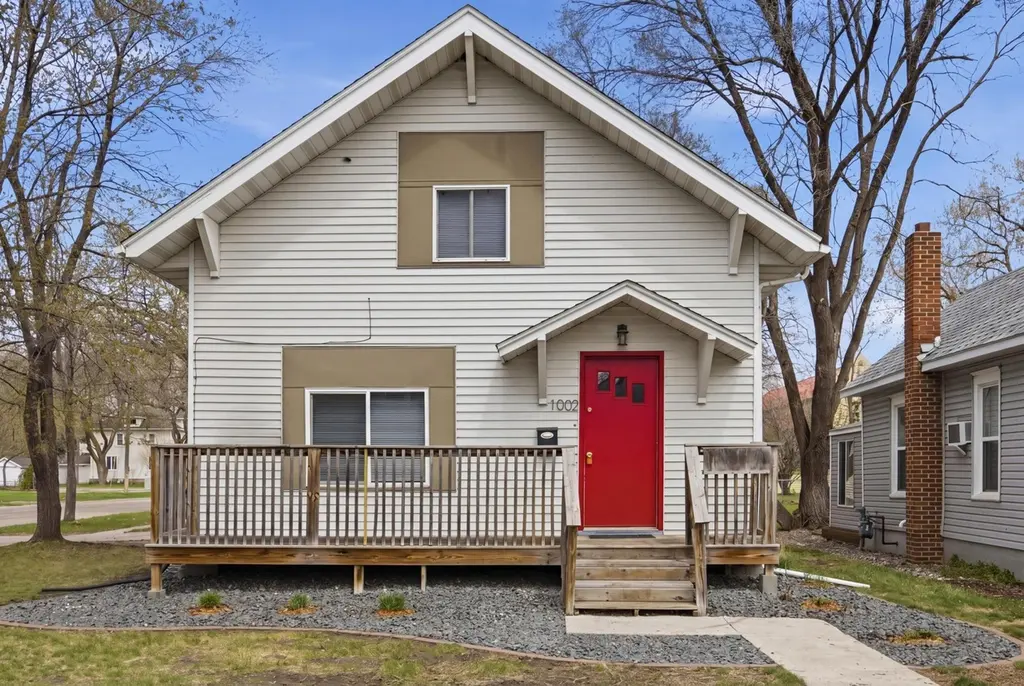
1002 4th Ave S · Moorhead, MN
Flood risk 1/10 · Minimal
- FEMA flood zone
- X (shaded)
- Chance of flooding over 30 yrs
- 0.0%
- Est. flood insurance / yr
- $473 – $860
Fire risk 1/10 · Minimal
- Est. fire insurance / yr
- $888 – $1,650
Heat risk 2/10 · Minimal
- Hot days now (above 98°F)
- 7 days/yr
- Hot days in 30 yrs
- 12 days/yr
Wind risk 2/10 · Minimal
- Chance of severe wind over 30 yrs
- —
Air-quality risk 3/10 · Minor
- Unhealthy air days now
- 3 days/yr
- Unhealthy air days in 30 yrs
- 3 days/yr
Risk factors via First Street. Map © Google.
Why this score? — see what drove the D grade
The composite is a weighted blend of 9 inputs, each scored 0–100. Each bar is that input's sub-score; the figure is the points it added to the 100-point composite (weight × sub-score).
- ARV discount +13.6/15.0
- Cash flow +10.4/30.0
- Livability +3.9/5.0
- Schools +3.7/10.0
- DSCR +3.0/10.0
- Rent growth +2.9/5.0
- 1% rule +2.8/10.0
- Condition / age +2.5/5.0
- Appreciation +0.0/10.0
$259,900
🖨 Deal sheet 📄 Offer letter ✓ Due diligence
Listing remarks MLS
Looking for a completed renovated gem in South Moorhead?? This beauty has are you ready for the list....newly sheet rocked, textured, painted walls, new flooring, new trim, new doors, brand new kitchen with stainless steal appliances, full bathroom completed gutted and redone, all new windows throughout, brand new porch, new water heater, all duct work has been cleaned, new concrete slab, basement floor and sidewalk. Basement ready for you to finish they way you would like. There is so much more, you just have to see this place for yourself!!
Key facts
- Steel siding
- Updated landscaping
- Functional layout
Tags
Property features AI
Finance
- Other: Total living area approximately 2,979 square feet; Main level finished area approximately 1,001; Above-grade finished area approximately 2,079; below-grade finished area approximately 900; Foundation area approximately 1,001
Exterior
- Parking: On-street parking only
- Utilities: City water connected; City sewer connected; Natural gas service
- Home design: Residential property; Two levels (main and upper) with lower-level finished space; Entry/main living on main level
- Construction: Block foundation
- Exterior features: Irregular lot; City water and city sewer connections
Interior
- Kitchen: Main-level kitchen
- Bedrooms: 6 bedrooms (beds located on Main, Upper and Lower levels)
- Bathrooms: 2 full bathrooms (located on Upper and Lower levels)
- Heating & cooling: Forced air heating; Central air and window unit(s) for cooling
- Interior features: Partially finished basement with block foundation; Door lever handles for accessibility
- Laundry & utility: Basement utility area
Neighborhood map
What this means for you Summary
Snapshot
- This is a 6-bed/2.0-bath single-family listed at $260k.
Deal economics
- At list price, monthly cash flow is $-138 ($-2k/yr) — negative.
- To cash-flow at today's rent, offer at most $236k (9.4% below list).
- To meet the 1% rule (rent ≥ 1% of price), the offer needs to be $203k (21.9% below list).
- Recommended offer: $203k (21.9% below list) — sets the bar for 1% rule.
- Cap rate 5.7% vs local median 3.7% in Moorhead — top-decile yield for the area; either an underpriced asset or a hidden risk that comps aren't pricing in. Stress-test before assuming the spread holds.
Location & tenants
- Location reads 77/100 on livability (#143 in MN, #3,111 nationally) — a middle-class / working-renter tenant base. Strengths: housing A+, health & safety A+, cost of living A-; Watch: crime C-, amenities F, commute F.
- Moorhead Public School District (suburban): math 39% / reading 46% proficiency, ranked #202 of 301 in MN (top 67%) — families likely to look elsewhere, expect single-tenant / working-renter base with shorter leases.
- Market conditions: Rents rising (+1.4%/yr); 390 active listings in the ZIP; solid renter incomes; 269 units permitted in Clay County in 2024 (153 in 5+ unit buildings).
- This rent runs 32% of the median local income ($75k/yr) — at the standard rent-burdened threshold; future hikes will face affordability resistance.
Forward outlook
- Local home prices are declining (-3.0%/yr); year-one equity from $2k of loan paydown is wiped out by about $8k of value loss. Plan a longer hold.
- Clay County population projected at +23% by 2050 — long-run rental-demand tailwind backs the buy-and-hold thesis.
Negotiation context
- It's been on market 43 days — a 3% lower offer ($252k) is reasonable based on typical stale-listing flexibility.
- 4 sale attempts since 11y ago; this cycle's ask is 11741% above the opening price — seller raised mid-cycle; expect resistance to lowballs.
- Current owner paid $142k; list at $260k implies a 83% gain — meaningful room to come down on a strong offer.
Risks & watch-outs
- Watch-outs: built in 1920 — expect roof / HVAC / electrical / plumbing capex.
Questions for the listing agent
- What do current leases actually rent for vs. the listed asking? Can we see a recent rent roll and the last 12 months of T-12 income?
- It's been on market 43 days. Have you received any prior offers? Is the seller open to a 22% concession, seller financing, or rate buy-down credit?
- Built in 1920 — when were the roof, HVAC, electrical panel, plumbing, and water heater last replaced?
- Is there a deadline driving the sale (1031 exchange, divorce, estate, relocation)? That informs how much negotiation room exists.
- Schools are B-rated — typically a magnet for longer-tenancy family renters. What's the average tenant stay here, and is there a school-zone premium baked into asking?
- The area grade is low — what's the realistic commute time and amenity access for the typical tenant pool here? Any planned neighborhood developments (good or bad) we should know about?
- What's the average days-on-market for RENTAL listings here right now (not sales)? A rising rental-DOM trend means longer vacancies and softer asking-rent achievability than the comps imply.
- What's the recent tenant-quality profile in this submarket — average credit score on applications, eviction rate, late-payment / NSF rate, and stable-employment percentage? A property-management company in the area should have these aggregated.
- How much new for-sale + rental construction is in the pipeline within 1–3 miles? Heavy new supply typically softens prices + rents 12–24 months out; constrained supply supports both.
Investment metrics
- 1% rule
- 0.78% ✗
- Cap rate
- 5.66%
- Cash-on-cash
- -2.28%
- DSCR
- 0.90
- GRM
- 10.7
CMA / ARV
- ARV (median comp)
- $300,591
- List price
- $259,900
- Delta
- -13.54%
- Verdict
- UNDERPRICED
- Comps
- 1 within 2.0 mi
Projected returns pro-forma
-3.0% appreciation · 1.41% rent growth · sell at horizon
- IRR
- -21.8%
- Equity multiple
- 0.26×
- Total profit
- $-54,106
- Equity at exit
- $38,752
- IRR
- -19.8%
- Equity multiple
- 0.02×
- Total profit
- $-71,153
- Equity at exit
- $22,471
Cash invested: $72,772 (down + closing). Projections, not guarantees.
Landlord ↔ Tenant lean methodology
- Overall (STATE)
- 46 Balanced
- State Minnesota
- 46 Balanced · D+2
- County
- — inherits STATE
- City
- — inherits STATE
ZIP-level market 56560
- Rents YoY
- 1.4%
- Active inventory
- 390
- Price-to-rent
- 10.7×
Monthly cashflow live
- Estimated rent
- $2,030 medium interval (Pro) →
- Mortgage (P&I)
- −$1,363
- Tax from tax record
- −$270 /mo · $3,246/yr
- Insurance
- −$108
- HOA
- −$0
- Vacancy / Maint / Mgmt
- −$426
- Net cashflow
- $-138
Break-even live
UW: 25.0% down · 7.5% · 30yr · 1.5% tax · 5.0% vac · 8.0% maint · 8.0% mgmt
Financing live
Cash to close
- Down payment
- $64,975
- Closing costs
- $7,797
- Reserves months
- —
- Total cash needed
- —
Loan-product check · same deal, 3 products live
Conventional
25% down · 7.5% · 30yr
- Down + closing
- —
- Monthly P&I
- —
- Monthly cashflow
- —
- DSCR
- —
- Eligible?
- —
Personal DTI + credit; lowest rate.
DSCR
20% down · 8.5% · 30yr
- Down + closing
- —
- Monthly P&I
- —
- Monthly cashflow
- —
- DSCR
- —
- Eligible?
- —
No personal income docs; deal must DSCR.
Hard money
10% down · 12.0% · 12mo
- Down + closing
- —
- Monthly P&I
- —
- Monthly cashflow
- —
- DSCR
- —
- Eligible?
- —
Short-term bridge; refi at stabilization.
Listing history 24 events
-
2026-06-18days on market $259,900 Active 43 DOM
-
2026-06-17days on market $259,900 Active 42 DOM
-
2026-06-16days on market $259,900 Active 41 DOM
-
2026-06-15days on market $259,900 Active 40 DOM
-
2026-06-14days on market $259,900 Active 38 DOM
-
2026-06-13days on market $259,900 Active 37 DOM
-
2026-06-10days on market $259,900 Active 35 DOM
-
2026-06-09days on market $259,900 Active 34 DOM
-
2026-06-08days on market $259,900 Active 33 DOM
-
2026-06-07days on market $259,900 Active 32 DOM
-
2026-06-05days on market $259,900 Active 29 DOM
-
2026-06-03days on market $259,900 Active 28 DOM
-
2026-06-02days on market $259,900 Active 27 DOM
-
2026-06-01days on market $259,900 Active 26 DOM
-
2026-05-31days on market $259,900 Active 25 DOM
-
2026-05-30days on market $259,900 Active 24 DOM
-
2026-05-06$259,900 Active 762-char remark
-
2022-03-14price $1,695
-
2016-03-07soldstatus $142,000
-
2016-03-04soldstatus $142,000 550-char remark
Show marketing remark (550 chars)
Looking for a completed renovated gem in South Moorhead?? This beauty has are you ready for the list....newly sheet rocked, textured, painted walls, new flooring, new trim, new doors, brand new kitchen with stainless steal appliances, full bathroom completed gutted and redone, all new windows throughout, brand new porch, new water heater, all duct work has been cleaned, new concrete slab, basement floor and sidewalk. Basement ready for you to finish they way you would like. There is so much more, you just have to see this place for yourself!!
-
2015-09-29$150,000 550-char remark
Show marketing remark (550 chars)
Looking for a completed renovated gem in South Moorhead?? This beauty has are you ready for the list....newly sheet rocked, textured, painted walls, new flooring, new trim, new doors, brand new kitchen with stainless steal appliances, full bathroom completed gutted and redone, all new windows throughout, brand new porch, new water heater, all duct work has been cleaned, new concrete slab, basement floor and sidewalk. Basement ready for you to finish they way you would like. There is so much more, you just have to see this place for yourself!!
-
2015-07-22historical
-
2015-04-22$105,000
-
2008-05-28soldstatus $80,000
ⓘ Source: listings_history table (triggers on properties + properties_extension) + one-shot
backfill from property_details.listing_events for pre-trigger history.
Tax reassessment forecast MN · Partial reset (capped growth)
- Current annual tax
- $3,246 · $270/mo
- Projected year-2 tax
- $3,246 · $270/mo
- Expected delta
- $0/yr ($0/mo · 0.0%)
ⓘ Screening estimate from a state-policy table — verify with the county assessor before closing.
Climate risk First Street
- Flood 1/10 Low FEMA zone X (shaded) · 0% chance over 30 yrs
- Wildfire 1/10 Low
- Heat 2/10 Low 7 d/yr ≥98°F today · 12 d/yr by 30 yrs out
- Wind 2/10 Low
- Air quality 3/10 Moderate 3 unhealthy d/yr today · 3 by 30 yrs out
Nearby sold comps map
Loading sold comps map…
Walkable amenities ~0.75 mi
Loading nearby amenities…
Taxation est. · year 1
- Rental income
- $24,360
- − Mortgage interest
- −$14,558
- − Property taxes
- −$3,246
- − Insurance
- −$1,300
- − Repairs & maintenance
- −$1,949
- − Management
- −$1,949
- − Depreciation
- −$7,561
- Taxable loss
- −$6,202
- Est. tax savings @ 24.0%
- +$1,489
- After-tax cash flow
- $-168/yr
For passive investors: Depreciation is non-cash, so a rental often shows a tax loss while cash-flowing — sheltering income. Rental losses are passive: they offset passive income freely, and up to $25,000/yr can offset ordinary (W-2) income if you actively participate and your MAGI is under $100k (phasing out to $0 by $150k); unused losses carry forward. On sale, claimed depreciation is recaptured at up to 25%, and gains may owe capital-gains tax (a 1031 exchange can defer both). Figures are a year-1 estimate at your 24.0% rate — not tax advice; consult a CPA.
Schools (NCES district)
- District
- Moorhead Public School District
- NCES district ID
- 2721420
- Math proficiency
- 39% ▼ -8.00%
- Reading proficiency
- 46% ▼ -6.00%
- Median HH income
- $53,009
- Composite
- 36.83/100
- National rank
- #4560
- State rank
- #202 of 301 in MN
Livability — Moorhead
- Score
- 77/100
- State rank
- #143
- US rank
- #3111
Category grades
Schools grade is shown separately in the Schools card above.
Census & demographics
- Census place
- Moorhead, MN
- County
- Clay County · 44,405 people
- City population
- 44,405
- Metro
- Fargo, ND-MN
- Population (ZIP)
- 44,405
- Household income
- $75,406
- Rent vs Own
- Severe rent burden
- 2229.0
Population outlook (Clay County) Hauer SSP2
- Today (2025)
- 67,880 people
- By 2030
- 70,881 · +4.4%
- By 2040
- 76,865 · +13.2%
- By 2050
- 83,205 · +22.6%
- By 2075
- 98,719 · +45.4%
- By 2100
- 111,657 · +64.5%
Race, ethnicity, and origin ACS 2023
- Neighborhood character
- Predominantly White (81%)
- Race & ethnicity
- White 81% Black 6% Two or more races 6% Hispanic / Latino 6% Asian 2%
- Hispanic origin (detail)
- Mexican 4%
- Common ancestry
- Portuguese 26% Lithuanian 3% Scottish 3%
- Foreign-born
- 6% · Canada, Vietnam
- Languages at home
- 91% English-only · Spanish 2% Other Indo-European 2% Arabic 1%
Political lean MEDSL · Clay
- 2024 margin
- Toss-up / Even · D 49.2% · R 48.8% · Other 2.0%
- 2008→2024 swing
- -15.5pp toward R · 2008: 16.0pp · 2024: 0.5pp
- All cycles
- 2024: D+0.5 2020: D+4.1 2016: R+2.0 2012: D+8.0 2008: D+16.0
Not yet ingested
- Civics
- —
Market trends
- HPI YoY
- ▼ -108.32%
- Current HPI
- 177.038
- Rent YoY
- ▲ 1.41%
- Metro
- Fargo, ND-MN
- State GDP YoY
- ▲ 2.41%
- F500 in state
- 34
Industry mix (Fortune 500 HQ in MN)
| Industry | F500 HQs | Revenue |
|---|---|---|
| Healthcare | 2 | $407B |
|
||
| Retail | 2 | $150B |
|
||
| Consumer Goods | 2 | $32B |
|
||
| Industrial Machinery | 2 | $6B |
|
||
| Agriculture | 1 | $40B |
|
||
| Healthcare / Medical Devices | 1 | $32B |
|
||
Price history
-97.3% since first listed9 events — show timeline
- 2026-06-12 Listed for Rent $2,195 APPFOLIO
- 2026-05-06 Listed $259,900 NORTHSTARMLS as Distributed by MLS Grid
- 2022-03-14 Price Changed $1,695 RENT.
- 2016-03-07 Sold (Public Records) $142,000 Public Records
- 2016-03-04 Sold (MLS) $142,000 NORTHSTARMLS as Distributed by MLS Grid
- 2015-09-29 Listed $150,000 NORTHSTARMLS as Distributed by MLS Grid
- 2015-07-22 Listing Removed — NORTHSTARMLS as Distributed by MLS Grid
- 2015-04-22 Listed $105,000 NORTHSTARMLS as Distributed by MLS Grid
- 2008-05-28 Sold (Public Records) $80,000 Public Records
Property tax history
+5.9%/yrLatest (2026): $3,246 · +18.3% YoY. Source: county tax records.
Cash-flow waterfall
monthlySold comps — $/sqft
last 12 mo · ≤1 miLoading sold comps…